Natural Hazards Analysis - Chapter 5 potx
Bạn đang xem bản rút gọn của tài liệu. Xem và tải ngay bản đầy đủ của tài liệu tại đây (645 KB, 27 trang )
© 2009 by Taylor & Francis Group, LLC
107
5Chapter
Risk Analysis
Assessing the Risks of
Natural Hazards
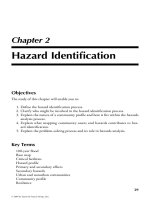
Objectives
1. Explain the process of risk analysis.
2. Explain what is risk.
3. Compare and contrast quantitative and qualitative approaches to risk analysis.
4. Identify and discuss approaches related to using historical data in determin-
ing risk.
5. Explain the concept of uncertainty and how it impacts risk analysis.
6. Discuss the concept of acceptable risk and how we determine it.
7. Explain how we describe the likelihood and consequences of risks.
Key Terms
Risk
Quantitative analyses and qualitative analyses
Acceptable risk
Voluntary risks
Involuntary risks
Flood flow frequency
© 2009 by Taylor & Francis Group, LLC
108 Natural Hazards Analysis: Reducing the Impact of Disasters
Flood discharge
Uncertainty
Ambiguity
Introduction
Once we have characterized the nature and extent of hazards by preparing a com-
munity profile and a hazards profile for the hazards in the community, we do an
analysis of the risks present by identifying vulnerability indicators and the hazards
probability. By doing so we explore the likely impact of the hazards on the com-
munity. Risk analysis is the determination of likelihood and possible consequences
from a disaster. is analysis must be accomplished in a systematic basis so as to
provide useful and accurate information for decision makers through risk manage-
ment or community hazard mitigation initiatives. Our goal is to provide the right
information, at the right level of complexity and detail, to decision makers at the
right time.
The Process of Risk Analysis
Risk analysis, therefore, takes information from the hazards identification and
examines not only the probability of the event but also explores the social-cultural,
economic, and environmental adverse impacts from a disaster. Risk analysis goes
further to then compare various hazard risks to determine if various risks could
have a similar likelihood of occurrence and outcomes. e results of the risk analy-
sis can be used in the problem-solving and decision-making process to adopt strate-
gies to reduce organizational or community vulnerability.
e process of risk analysis examines the nature of the risk from a hazard, when
and where it might occur, potential intensity, and potential impact on people and
property. e level of risk for a disaster of any scale is expressed as a likelihood of
the occurrence or frequency times its consequences. e level of risk may be very
limited so that nothing needs to be done to address it. Other hazards may be more
likely to occur and have the potential to cause extensive damages. e fact is that
some organizations and communities may be willing to live with a specific risk or
not willing to expend the resources necessary to reduce the adverse consequences
that come with it (Waugh 2000).
For example, a community may be vulnerable to natural hazards because it is
located on a coastline, in the mountains, along rivers and lakes, in wooded areas,
or in a desert area and, as a result, subject to hurricane winds or storm surge, earth-
quakes, floods, fire, and other disasters.
Some organizations may be constrained in the location of their business,
where they live or locate their operation. As a result, it may be necessary to locate
© 2009 by Taylor & Francis Group, LLC
Risk Analysis 109
their operation in a floodplain, on a coast, or near a major transportation route.
Individual families, organizations, and communities must make conscious choices
about what is an “acceptable risk.” Hazard reduction policies can be made with an
understanding of what choices are possible and the consequences for any option.
e decision-making process might include mapping the hazard to determine the
spatial distribution of risk, the collection of data on the frequency and intensity of
past disasters, judgments concerning specific risk factors (i.e., factors that may sig-
nificantly increase or decrease the risk of disaster or the threat to life and property),
and the vulnerability of the people and property within the risk area. is is all part
of the hazards analysis process.
Risk managers consider the likelihood and consequence of all (identified) haz-
ards faced by their jurisdiction, and they rank them according to priority. However,
to understand the likelihood component of the risk analysis, you need to have an
understanding of probability. Probability is what tells risk managers whether or
not they should expect a hazard to affect their community. Jardine and Hrudey
suggest that a classical or frequency concept of probability be used to focus on dis-
crete events, which examines all possible outcomes and the numerical relationships
among the chances of these outcomes (1997). In the real world, however, such com-
plete information is seldom, if ever, available. erefore, risk analyses must include
subjective information along with detailed historical information.
What Is Risk?
Risk is the product of likelihood or probability of a hazard occurring and the
adverse consequences from the event and is viewed by many as simply our exposure
to hazards. Simply stated,
RISK = (LIKELIHOOD or PROBABILITY) × CONSEQUENCE
is approach is based on the Royal Society Study Group (1993) defining risk
as “the probability that a particular adverse event occurs during a stated period of
time, or results from a particular challenge” (1992: 2). e Society provides a basis
for an analysis of risks associated with hazards by measuring the likelihood and
consequence of hazards in the community. How one perceives the adverse impacts
of risk, either from an individual, organizational, or societal perspective, certainly
influences strategies to address risk of natural hazards. To say the least, how risk
may be perceived and the process for analysis will shape individual and institu-
tional approaches to deal with risk. In this book, we acknowledge that individuals,
organizations, and public policy positions may be viewed differently. We stress that
an open analysis of hazards is constructive in preparing sound hazard risk manage-
ment and community hazard mitigation.
© 2009 by Taylor & Francis Group, LLC
110 Natural Hazards Analysis: Reducing the Impact of Disasters
Risks may be viewed as voluntary, where we agree to participate in activities
that increase our chances of harm or injury, including driving fast or participating
in high-risk sporting events. Other risks that we do not choose to participate in are
classified as involuntary risks, where we unknowingly or unwillingly are exposed to
harm. For involuntary risks, we may be exposed simply because the nature of the
risk has changed, as in a potential for wildland fire or a hazardous material spill.
Unfortunately, we may not appreciate the actual risk from hazards simply because
we have adjusted to the threat they present and not examined alternatives that
would reduce our vulnerability.
e Royal Society Study Group acknowledges that risk management as a con-
cept involves making decisions concerning risks and that this concerns both hazard
identification and risk analysis. Our use of the term risk analysis fits within this
context and reflects our determination to understand the likelihood of a hazard
event and the consequences of the disaster on a community, region, or for an orga-
nization (1992). is definition of risk analysis comprises the identification of the
outcomes and estimations of the magnitude of the consequences and the probabil-
ity of those outcomes. Finally, organizations use the outcomes of risk analysis to
determine what is an acceptable level of risk and if anything can be done to reduce
the adverse effects of the risk of a specific hazard. e determination of risk reduc-
tion measures on an organizational level is viewed as hazards risk management,
while this contrasts with broader community approaches to hazard mitigation and
building community resiliency.
Quantitative Analysis of Risk
Our view of risk analysis includes both quantitative and qualitative analysis tools.
ere are predominantly two categories of analysis: quantitative analysis and qualita-
tive analysis. Quantitative analysis uses statistical measures to derive numerical refer-
ences of risk. Qualitative analysis uses less-defined ways of describing and categorizing
the likelihood and consequences of risk. Quantitative analysis uses specific measur-
able indicators (whether dollars, probability, frequency, or number of injuries/fatali-
ties), while qualitative analysis uses qualifiers to represent a range of possibilities.
Quantitative representation of likelihood may be provided in the form of a
frequency measure such as the number of times of occurrence over a chosen time-
frame. For example: 3/year, 1/decade, 10/week. An alternative technique of a quan-
titative measure would be probability, which reflects the same data as frequency,
but expresses the outcome as percentage between 0% and 100% as representing
the probability of occurrence. For example, a 100-year flood has a 1/100 chance of
occurring in any given year, or expressed as a probability of 1% or .01. Qualitative
representation of likelihood uses words to describe the chance of occurrence. Each
word, or phrase, will have a designated range of possibilities attached to it as illus-
trated in the categories in Figure 5.1.
© 2009 by Taylor & Francis Group, LLC
Risk Analysis 111
Individuals determine the risk of
a specific hazard by making a judg-
ment among these alternatives. We
base these judgments on many fac-
tors which could include our recent
experience, how hazards have affected
others, information provided by the
media, and or community meetings
that may have addressed potential
hazards.
Quantitative analysis of the like-
lihood component of risk seeks to
find the numerical statistical probability of the occurrence of a hazard causing a
disaster. ese analyses tend to be based upon historical data. A standard numerical
measurement for all analyzed hazards must be established. One of the most com-
monly used quantitative measures of likelihood, and the measure that will be used
in this and subsequent sessions, is the number of times a particular hazard causes
a disaster per year.
As was true with the likelihood component of risk, the consequences of risk
can also be described according to quantitative or qualitative reporting methods.
Quantitative representation of consequence can be represented by the number of
deaths or injuries or by estimating actual damages from various events.
Qualitative Representation of Consequence
As was true with the qualitative representation of likelihood, words or phrases that
have associated meanings are used to describe the effects of a past disaster or the
anticipated effects of a future one. ese measurements can be assigned to deaths,
injuries, or costs (oftentimes, the qualitative measurement of fatalities and injuries
are combined). Figure
5.2 provides an illustration of the subjective ranges to help
quantify the measurement indicator.
Critical inking: We attempt to understand risk using both quantitative and
qualitative tools that allow us to examine hazards and their impacts using both the
physical and social sciences. We acknowledge that risk is shaped on an individual
basis by the individual’s familiarity with local hazards (Slovic 1991), but also from
elements of local culture, which includes how hazards have been viewed locally over
time. What influences your view of risk?
Views of Risk
Rejeski (1993) notes that discussions of risk have included three primary groups
including scientists who form their opinions through a rational process, policy
Figure 5.1 Qualitative representation of
likelihood.
Chance of occurring
in a given year
Certain
Likely
Possible
Unlikely
Rare
Extremely rare
>99%
50–99%
5–49%
2–5%
1–2%
<1%
© 2009 by Taylor & Francis Group, LLC
112 Natural Hazards Analysis: Reducing the Impact of Disasters
makers who establish their perspectives based on multiple sources of information,
including quantitative and qualitative data, and finally, the public whose percep-
tions and judgments of risk are formed from their own perspectives in some cir-
cumstances despite data provided by the other two major groups. He observes that
environmental risks are full of ambiguities that may not be resolved, especially
when interested groups have such different perspectives on the issues. He believes
that common view of risk can only be obtained when groups agree to share their
perceptions and basis for their positions. He stresses that there is a great difference
between uncertainty and ambiguity. For ambiguity, there are intrinsic elements of
public policy that separate risk management strategies from the risk analysis process.
One of the key elements of debates concerning risk and uncertainty is the relative
level of trust that is established between the three groups, scientists, policy makers,
and the public. e only option that may be possible to obtain any consensus is to
encourage a more participatory process and open dialogue. He concludes that the
conflict between these groups is characterized by ambiguity and uncertainty and is
a lack of consensus over the proper courses of action to understand the risks associ-
ated with hazards. GIS provides a tool for examining both hazards and risk. It pro-
vides a tool for visualizing the nature and extent of a risk zone. Unfortunately, this
tool cannot solve the problem of disagreement, but it may provide those interested
in the risks of hazards with the means of building a consensus.
Hazard models and spatial analysis tools are full of spatial uncertainty that may
not be resolved. e goal then is to fully clarify the limitations of our hazard mod-
els and the data that is used in the spatial analysis of social, economic, and envi-
ronmental vulnerability. Figure
5.3 provides an estimate of an accidental release of
ammonia on a cool cloudy February day at 10 am, wind from the east at 10 mph.
Injuries Fatalities
Insignificant
Minor
Moderate
Major
Catastrophic
*EMA, 2000
None
Small number
First aid treatment required
Medical treatment required
Some hospitalization required
Extensive injuries
Large number of severe injuries* Some
Some
Significant number o
f
fatalities
None
None
None
Figure 5.2 Qualitative consequence indicators.
© 2009 by Taylor & Francis Group, LLC
Risk Analysis 113
e release occurred near a hospital when a 600-lb tank was dropped from a truck
unloading a shipment of various cylinders. e model output provides three esti-
mates of risk using alternative exposure limits of 25 ppm, 150 ppm, and 750 ppm.
Critical inking:
e question that the scenario in Figure 5.3 presents centers
on our risk of harm for a specific exposure limit in a chemical release. e question
of risk in this case is not simple and depends on many factors such as where we are
in the risk zone (are we close or further away from the actual release), if we are inside
a building or are exposed in the outside environment, our individual health and if
we suffer from asthma or other breathing handicap, our age and physical size.
e three exposure limits for the scenario in Figure
5.4 were drawn from Emergency
Response Planning Guidelines (ERPGs) which are used in the Areal Locations of
Hazardous Atmospheres (ALOHA) chemical dispersion model to predict the area
where a toxic gas concentration might be high enough to harm people. ree sets of
exposure limits were developed by a committee of the American Industrial Hygiene
Association for use as planning guidelines, to anticipate human adverse health effects
caused by exposure to toxic chemicals.
e three-tiered guidelines have one common denominator, which is a one-hour
direct exposure duration. Each guideline identifies the substance, its chemical and
structural properties, animal toxicology data, human experience, existing exposure
guidelines, the rationale behind the selected value, and a list of references.
e categories as noted in the ALOHA “Help” tool, do not protect everyone, for
very sensitive individuals including young children or older adults might suffer adverse
Miles
Miles
>= 750 ppm = ERPG–3
>= 150 ppm = ERPG–2
>= 25 ppm = ERPG–1
Confidence Lines
0.75
0.25
0
0.25
0.75
00.5 1.521
Figure 5.3 (See color insert following page 142.) Hazard risk zones representing
alternative exposure limits. Output from EPA ALOHA modeling program.
© 2009 by Taylor & Francis Group, LLC
114 Natural Hazards Analysis: Reducing the Impact of Disasters
reactions to concentrations far below those suggested in the guidelines. Further, these
exposure limits are primarily based on animal studies and not on humans. In addi-
tion, the exposure limits are based on a one-hour time period and do not account for
any personal safety measures that might be taken to reduce our exposure. e fact is
that we might be exposed for a longer period, but seek shelter at the initial signal of
the release.
Frosdick (1997) also agrees that our understanding of risk is full of uncertainty
and notes that terms such as risk assessment, risk evaluation, and risk analysis are
used interchangeably to describe techniques and processes in the management of
risk. He notes that, for such a little word, risk is complex and has been the subject
of disagreement for some time, especially between natural and social scientists.
Using Historical Data in Determining Risk
One of the largest data sets relating to disasters is maintained by the Centre for
Research on the Epidemiology of Disasters (CRED) at the University of Louvain,
Belgium, where the Emergency Events Database (EM-DAT) covers both natural
and human-caused disasters since 1900. Even with the possibility of a very accurate
data set reflecting disasters, how we measure them in terms of losses is complex.
e maximum airborne concentration below which it is believed that
nearly all individuals could be exposed for up to 1 hour
without experiencing anything other than
mild transient adverse health effects
or perceiving a clearly defined, objectionable odor.
ERPG 1
ERPG 2
ERPG 3
e maximum airborne concentration below which it is believed that
nearly all individuals could be exposed for up to 1 hour
without experiencing or developing
irreversible or other serious health effects
or symptoms which could impair an individual’s ability to take protective action.
e maximum airborne concentration below which it is believed that
nearly all individuals could be exposed for up to 1 hour
without experiencing or developing
life-threatening health effects.
Figure 5.4 Emergency Planning Guide exposure guidelines.
© 2009 by Taylor & Francis Group, LLC
Risk Analysis 115
Comparisons between countries can be problematic, for US$1 in one country may
have a different value in another. Our ability to measure disasters over time has
changed in the methods that we use to collect the frequency of disasters worldwide.
Our capacity to detect and accurately classify disasters since satellites have been in
use means that our data since the 1960s may be far more accurate than frequency
data sets of the early twentieth century. As an example, our ability to accurately
detect and classify earthquakes or tropical cyclones is far greater today than ever
before. We thus see in many of the data sets a dramatic increase in disasters in the
last twenty years.
Numerous data sets reflecting the frequency of disasters and their consequences
worldwide are available from the United Nations, Munich Reinsurance Company.
ese data sets may be of value in establishing a benchmark for a specific type of
hazard, which may be adjusted for a specific part of the world. Data obtained from
more domestic sources such as the National Weather Service (NWS) or National
Oceanographic and Atmospheric Administration (NOAA) may provide a more
accurate determination of specific risks of hazards in a part of the country.
For the United States, the National Climatic Data Center (NCDC) serves as
a national resource for climate information. NCDC can provide historical data to
help document historical climate information. As a climate resource, the NCDC
works with scientists and researchers worldwide. ey provide both national and
global data sets for weather and climate information.
In addition to the NDCD, the USGS Center for the Integration of Natural
Disaster Information is a clearinghouse for disaster information and provides links to
disaster data distributed by other agencies (omas 2001). e U.S. Environmental
Protection Agency and the U.S. Department of Transportation (DOT) provide
information on accidental releases of hazardous chemicals. DOT focuses its data
set on transportation accidental releases, while EPA does fixed site releases.
omas notes that, although there has been some integration of hazard event
data within a single agency such as the NWS, “a true systematic integration of
multiple types of hazard data currently does not exist” (2001: 64).
The Need for Complete Accurate Data for Decision Making
In order to reduce the adverse impacts of disasters, those involved in the hazards
analysis process must have accurate and timely information to support effective deci-
sion making. Information that results from our hazard modeling exists to support
decision making. e sources of this information must be known and shared with
those who use our recommendations and hazard analysis outputs. Rosenthal and
Kouzmin stress that organizations fully understand the threat imposed by hazards
and can establish a framework from which to deal with disaster outcomes (1997).
Quality information is essential in any hazards analysis effort, and in many
cases this information is in the form of a technical report and utilizes complex
scientific hazard modeling. It is critical that this complex information be used
© 2009 by Taylor & Francis Group, LLC
116 Natural Hazards Analysis: Reducing the Impact of Disasters
to protect public property and lives of citizens. Data used in a hazards analysis
have time and spatial characteristics (Figure 5.5). e data requirements for
supporting the emergency management process will vary both for the type of
hazard as well as how the outputs will be utilized in supporting decision making
(Cutter 2001).
Using Technical Data in Decision Making
e description and categorization of hazard areas, critical infrastructure, and
disaster zones is greatly facilitated by the use of geospatial technologies and hazard
models. e use of scientific data from hazard models and risk analysis requires that
decision makers fully understand the limitations of these tools and how to com-
municate information. An informed user of complex data is critical to minimizing
legal challenges and suits. Hazard models can provide different results with just
minimal changes in data inputs. Clarifying the sensitivity to the models and the
limitations of data inputs will help to avoid challenges to the use of these models in
emergency management.
ere may be a discrepancy between an objective assessment of risk by the haz-
ards analysis team and the public (Kirkwood 1994). Clearly an objective view of
risk by a knowledgeable professional, who understands the nature and limitations
To rnadoes
1959-present
1959-present
1959-present
1959-present
1959-present
1886–1996
1903-present
1970-present
2150 B.C 1994
3000 B.C 1994
8000 B.C present
*Meteorological events including wind, hail, lightning, water hazards, tornadoes,
flooding, drought, landslides, hurricanes, wildfires, and thunderstorms
Hazard Agency
Storm Prediction Center
Norman, IL
Storm Prediction Center
Norman, IL
Storm Prediction Center
Norman, IL
National Climatic Data Center
Asheville, NC
National Climatic Data Center
Asheville, NC
National Hurricane Center
Colorado State University
National Weather Service
Council of National Seismic Systems
National Geophysical Data Center
Earthquake Research Institute
University of Tokyo, Japan
Global Volcanism Program
Smithsonian Institution
Time Covered
understorm, wind
Hail
Lightning
Storm data*
Hurricanes
Floods
Earthquakes
Volcanoes
Figure 5.5 Natural hazard data sources with time covered.
© 2009 by Taylor & Francis Group, LLC
Risk Analysis 117
of hazard modeling and how it is described, may not be shared by the public. An
objective evaluation of risk must be nonjudgmental and explained in a way that the
public or other stakeholders can understand. Kirkwood stresses that, regardless of
our scientific modeling, there will be in the eyes of the public some level of risk,
however small.
Wallace and Balogh (1985) stress the need for decision support systems (DSS)
for using technical data. ey stress that a DSS must provide support to decision
makers and their stakeholders, evolve as the users become more familiar with
the technology, be interactive and controllable, recognize their nonroutine but
consequential use, and adapt to the idiosyncrasies that are inherent in human
decision making.
Indicators of Direct and Indirect Losses
We measure the consequences of disasters using indicators of disaster impacts.
ey could include social disruption, economic disruption, or environmental
impacts. Social disruption could include the number of people displaced or made
homeless, or incident rates of crime (murders, arrests for civil disorder, or fight-
ing); economic disruption could be based on unemployment rates, days of work
lost, production volume lost, or decrease in sales or tax income. Environmental
impacts could be valued at total cleanup costs, cost of repair or restoration of
water or sewerage systems, number of days of unhealthy air, or the number of
warnings involving fish consumption or restricting recreational use of a water
feature.
Direct tangible losses such as fatalities, injuries, cost of repair, loss of inven-
tory, response costs by a business or community, or relocation costs are first-order
consequences, which occur immediately after an event (Smith 2004). Indirect
losses associated with a disaster evolve after the event and include loss of income by
displaced employees, sales that did not occur, increased costs for skilled employ-
ees, losses in productivity of employees, employee sickness, increases in disruptive
behavior (fights) at schools, or crime in a neighborhood.
Critical inking: How might you measure the intangible losses related to the
impact of a disaster in an education system that has to accommodate an increase of
25% more students, or increases in traffic in a community that absorbed 40% more
residents who have been displaced?
e indicators for social, economic, or environmental impacts may be based on
historical data and collection of data after a disaster event or modeling techniques.
To estimate the number of deaths and injuries using historical data, one would
determine for past disasters the number of injuries, fatalities, displaced persons,
or number sheltered or left unemployed. e population of the community would
need to be determined at the time of the event and then the same data collected
© 2009 by Taylor & Francis Group, LLC
118 Natural Hazards Analysis: Reducing the Impact of Disasters
after a similar disaster event. A rate comparing the number of injuries for the total
population would provide a means of comparing injuries at different disaster events,
allowing for population changes over time.
Allowing for population changes over time does not account for other related
changes that could impact injuries, fatalities, and indicators for disaster impacts.
e impacts from more recent disaster events will not be able to account for legal
changes (code requirements or flood plain management programs), changes in
development patterns, or cultural and social changes causing movement in popu-
lated areas.
e use of measurable indicators to help understand risks could be enhanced
if all the indicators used the same reference points. An example would be to
quantify deaths, injuries, and damages in a common measure such as U.S. dol-
lars. Unfortunately, it may be impossible to associate a dollar amount to some
indicators. e alternative is to use measurable indicators that may be compared
over time.
e World Bank classifies each national economy by its gross national income
(GNI) per capita, to reveal low-income, middle-income, and high-income coun-
tries (ISDR Secretariat 2003). A more complex ranking measure of vulnerability
is provided by the United Nations in its Human Development Index (HDI),
which uses life expectancy, educational attainment, and income as indicators of
sustainability.
Intangible losses are those that cannot be expressed in universally accepted
financial terms and are not generally included in damage assessments or predictions.
Despite the difficulty in associating some intangible losses to specific indicators, we
may want to identify some type of indicator that reflects the losses associated with
cultural changes, individual and family stress, mental illness, sentimental value,
and environmental losses. We need to identify appropriate measures of both tan-
gible and intangible losses associated with disasters. It is not uncommon for the
intangible impacts to exceed the tangible ones in terms of the overall effect they
have on a community (UNDP 2006).
As we examine potential losses from disasters, we may find that the commu-
nity or business organization actually has gains. ough it is extremely rare for
gains to be included in the assessment of past disasters or the prediction of future
ones, it is undeniable that benefits can exist in the aftermath of disaster events.
Gains could be observed in amount of employment, business volume, tax collec-
tions, number of residents, traffic counts, or crime. Post-Hurricane Katrina data
show that many cities within a 100-mile distance of the City of New Orleans had
positive gains from the displacement of the metropolitan New Orleans popula-
tion. Although the impacts were temporary, some gains remained even years after
the disaster.
© 2009 by Taylor & Francis Group, LLC
Risk Analysis 119
Issues in Risk Analysis
Changes in Disaster Frequency
Changes in disaster frequency may be the natural result of climate variations which
occur over a long period or from changes in variables that impact the frequency or
severity of an environmental change such as an increase in human activity where
the hazard already existed. e number of hurricanes that enter the Gulf of Mexico
states varies over a long period, especially with the rise or fall of sea surface tempera-
tures or wind patterns from an El Niño. Flooding or hurricane storm surge might
cause more physical damage because of increases in development or in coastal areas
where major changes in development have occurred (Smith 2004). Worldwide
trends in population shifts to high hazard coastal zones will likely result in higher
losses from tropical cyclones. Environmental changes resulting in natural system
degradation may also increase the severity of hazards. As more buildings, technol-
ogy, infrastructure, and other structures are constructed, the potential for hazard
impacts increases.
With changes in technology, people expect to have a certain level of services,
including availability of water, electricity, and easy long-distance transportation.
As these systems expand and develop, they become vulnerable to hazards. Major
blackouts, the spread of computer viruses, or communication of terrorist threats
have occurred worldwide in the past and will likely occur in the future. e interde-
pendence of our societies globally makes us increasingly vulnerable to epidemics or
disease or massive economic changes in stock markets, oil, water, or other natural
resources. Disaster trends may need to be examined over very long periods, and
unfortunately, we may not have access to data sets to help us understand the natural
variation of a specific hazard.
Availability of Essential Data
e availability of essential data for modeling hazards and determining the fre-
quency of occurrence is critical in a valid risk analysis. e following example con-
cerns the availability of historical hydrological data and illustrates the challenge
that we face when attempting to understand the nature of the risk presented by a
natural hazard.
Hydrology is the science that deals with the properties, distribution, discharge,
and circulation of water on the surface of the land, in the soil, and in underlying
rocks. It also refers to the flow and behavior of rivers and streams. All flood mod-
eling programs that are used to create flood maps for local communities need a
discharge value for a water feature. e discharge value is determined by measuring
flow rates directly by the USGS through a river gauge or indirectly by statistical
methods. A USGS River Gauge Station measures a water feature discharge for a
particular site on a stream, canal, lake, or reservoir where systematic observations
© 2009 by Taylor & Francis Group, LLC
120 Natural Hazards Analysis: Reducing the Impact of Disasters
of water flow characteristics are obtained. For these stations, data is collected on
a real-time basis, since it is data collected by automated instrumentation analyzed
quickly enough to influence a decision that affects the monitored system.
Discharge characterizes the volume of water passing a point of a stream or river
(river gauge station) or hydrologic unit per unit of time, commonly expressed in cubic
feet per second, million gallons per day, or gallons per minute. A major input to a flood
modeling program is the discharge value or volume of water in a river or stream.
e measurement of high water is a critical part of the modeling process for
flooding events. A hydrograph is a graph showing the variation of water elevation,
velocity, stream flow, or other property of water with respect to time. A hydrograph
is provided for each USGS River Gauge to describe the properties of the water at
that point in a water feature. It provides real-time and historical values. A hydro-
graph shows a mean discharge (MEAN) of a stream during a specific period, usu-
ally daily, monthly, or annually. Figure
5.6 provides an example of a hydrograph for
a water feature that has a USGS river gauge. For examples of real-time hydrographs,
see the following USGS Internet site: />e National Flood Insurance Program (NFIP) was established in 1968 and
made affordable flood insurance rates available to individuals through participating
local communities such as towns, cities, counties, or parishes. In 1983, a common
standard for risk assessment and management of flood hazards was adopted by
federal agencies and known as the 100-year or 1% annual chance of flood as the
Mar Mar Mar
DATES: 03/02/2004 to 03/09/2004 11:00
USGS 03241500 Massies Creek at Wilberforce, OH
Discharge, Cubic Feet per Second
Explanation
Discharge
Median Daily Streamflow Based on 50 Years of Record
Provisional Data Subject to Revision
Mar Mar Mar Mar Mar 02 03
90
80
70
60
50
40
30
20
04 05 06 07 08 09
Figure 5.6 (See color insert following page 142.) USGS hydrograph for a water
feature.
© 2009 by Taylor & Francis Group, LLC
Risk Analysis 121
standard for floodplain management. is standard was considered to represent
a degree of risk and damage worth protecting against, but was not considered to
impose stringent requirements or burdens of excessive cost on property owners. e
100-year event standard represents a compromise between minor floods and the
greatest flood likely to occur in a given area, that the highest recorded flood level
reflects what has happened rather than what could happen, and that in many cases
the 100-year flood level is less than the flood of record. is 1% annual chance
flood (or 100-year flood) and the associate floodplain have been widely adopted as
the common design and regulatory standard in the United States. is 1% annual
chance flood is used by the NFIP as the standard for floodplain management and
to determine the need for flood insurance. e development of flood models and
flood maps was considered by the NFIP as a primary means of reducing flood
hazards. e flood maps would provide a basis for managing the development and
use of flood-prone areas and lead to a better understanding of the magnitude and
likelihood of large flows.
Information on water feature flow frequencies would grow in importance as fed-
eral agencies enhanced their efforts to assist in flood mapping for communities join-
ing the NFIP. e U.S. Water Resources Council (USWRC) published estimates of
flood flow frequencies, (Benson 1967; Ries and Crouse 2002). e techniques were
adopted by USWRC for use in all federal planning involving water and related land
resources.
Practically all government agencies undertaking floodplain mapping studies
use flood flow frequencies as a basis for their efforts (IACWD 1982). Flood flow fre-
quencies are used to determine flood discharges for evaluating flood hazards for the
NFIP. Flood discharge values are a critical element in preparing Flood Insurance
Rate Maps. Flood flow frequencies may be determined using a minimum of ten
years of historical data from USGS stream gauges (Figure
5.7). is data is used in
flood models approved for creating flood maps for local communities participating
in the NFIP. For water features where USGS stream gauges are not available, flood
flow frequencies are based on calculations from the USWRC guidance. e flood
flow frequencies using these techniques have been determined for large geographic
regions and are statistical representations rather than averages based on data from
local water features. Flood modeling based on these statistical representations is
considered valid by the NFIP, but the studies should acknowledge the source of
data for flood flow frequencies. Although valid, they are not based on local data
reflecting water feature flood discharges.
Depth of Analysis
Each hazard that is analyzed must be considered according to the range of possible
intensities that could be exhibited by the particular hazard. Depending on hazard,
we may need to examine it based on its intensity, since the frequency of occurrence
is so rare.
© 2009 by Taylor & Francis Group, LLC
122 Natural Hazards Analysis: Reducing the Impact of Disasters
We generally see that lower-intensity hazard events occur more often than more
severe ones as in the case of a hurricane or an earthquake. More hazard events,
even lower-intensity ones, give us a more comprehensive assessment. We can thus
determine a broad-based frequency by calculating the (quantitative) likelihood of
each identified hazard (broken down by magnitude or intensity if appropriate);
calculating the (quantitative) consequences that are expected to occur for each haz-
ard (broken down by magnitude or intensity if appropriate), in terms of human
impacts, environmental impacts, and economic/financial impacts; developing a
locally tailored qualitative system for measuring the likelihood and consequence
of each hazard identified as threatening the community; and then determining
quantitative data into qualitative measures for both the likelihood and consequence
of each hazard.
Once a general frequency is determined, we need to estimate damages that
might be expected to affect the community. Damages resulting from major disaster
events may form the basis for examining the impacts of disasters in future ones.
e massive floods of 1993 or hurricanes such as Andrew (1992) or Katrina (2005)
could provide a basis for estimating damages in future events. Note that there are
inflation converters available to help us determine damages in one time period
compared to another.
Losses to structures may be estimated based on total replacement values. e
same is also provided for losses to building contents. Losses to structure use and
function and cost of displacement may also be estimated for specific critical struc-
tures. Although each hazard may affect structures and their contents in different
ways, we can estimate the level of potential damage, replacement value, or cost of
relocation of operations for that structure from a hazard.
Tuesday, March 09, 2004 11:20ET
AK
HI
PR-VI
NH
VT
MA
RI
CT
NJ
DE
MD
DC
Figure 5.7 (See color insert following page 142.) USGS river gauges in the United
States (go to to review active state stations).
© 2009 by Taylor & Francis Group, LLC
Risk Analysis 123
For major weather-related events, the data may be available for large areas.
Unfortunately for most hazards, sufficient information does not exist to accurately
quantify the likelihood of a future occurrence of a disaster to a high degree of
confidence. is is especially true for hazards that occur infrequently and/or occur
with no apparent pattern, such as earthquakes, droughts, terrorism, or nuclear
accidents.
Dealing with Uncertainty
e very nature of risk analysis is one of uncertainty. Estimates that result from
both the quantitative and qualitative analyses are merely estimates, and cannot
account for many unknown and confounding variables that affect the way humans
and the built environment are affected by disasters of all kinds. Uncertainty may be
framed from different perspectives:
Scientific—precise measurable and available indicators of risk may not N
be available.
Legal—potential liability for negligence. N
Moral—individual and societal obligations. N
Societal—personal obligations to others. N
Institutional—system relations between public, private, and nonprofit sectors. N
Proprietary—individual and organizational self-interests (De Marchi and N
Ravetz 1999).
Because the risk analysis process is so dependent upon timely accurate data,
uncertainty is likely to exist in any analyses. Our estimates of risk do involve
assumptions and biased judgments that contribute to uncertainty and must be con-
sidered when making decisions.
Quantitatively based risk estimates associated with scientific objectivity are
unfortunately more subjective than we would want to admit. Our determination of
risk is ultimately a very personal, social, and human dynamic rather than one that is
objective and neutral. True scientific objectivity is thus a myth and likely unobtain-
able in our efforts to quantify risk to hazards. Risk thus presents a paradox, for it is
just a threat and has not occurred. e risk presented by a hazard is thus an uncer-
tain risk. Since we cannot be certain, our estimates of risk are just a prediction.
Relative Ranking of Risks
Risk evaluation involves the determination of the relative seriousness of the risk
of a hazard as it could affect an organization or a local community. Organizations
and communities face a range of natural and technological hazards, each of which
requires a different strategy to reduce the risk factors of likelihood or consequence.
© 2009 by Taylor & Francis Group, LLC
124 Natural Hazards Analysis: Reducing the Impact of Disasters
To facilitate the relative ranking of risks, organizations should determine if a
risk may be addressed by another agency, identify which risks require immediate
attention, and clarify if the risk associated with a hazard requires further evaluation
(Cameron 2002).
We can determine the relative ranking of risks associated with hazards facing
our organization or community by considering the following factors:
e likelihood and consequences of the hazard
e voluntary or involuntary nature of the risk (Smith 2004)
Whether there are benefit to cost ratios of mitigating different risks
Political and social ramifications of certain mitigation decisions
e final output of risk evaluation is a prioritized list of risks, which will be used
to decide treatment (mitigation) options.
When we examine the likelihood and consequences of a hazard, we use quan-
titative values. For those hazards that are known to exhibit a range of magnitudes
or intensities, these likelihood and consequence values were determined for several
of the magnitudes or intensities across the range of possibilities. Assigning these
qualitative values was the first step in a process that allows for a direct comparison
of the risks faced by a community.
To compare hazards according to their likelihood and consequences, a risk
matrix may be constructed. In short, a risk classification categorizes the likelihood
and consequence of hazards together in various combinations (Figure
5.8).
An initial risk evaluation of hazards using this approach allows us to classify
the risks presented by various hazards. We can then use the FEMA “Multi-Hazard
Identification and Risk Assessment” publication to further classify the risks pre-
sented by these hazards using the following risk categories.
Extreme Risk: High-risk condition with highest priority for mitigation and con-
tingency planning (immediate action). Almost Certain Likelihood and
Catastrophic Consequence
High Risk: e likelihood of a risk is high, but the consequence low. Risk
addressed immediately by mitigation and emergency preparedness and con-
tingency planning (prompt action). Almost Certain Likelihood and Minor
Consequence
Moderate Risk: Risk likelihood low, but consequences high. Consideration
for mitigation and preparedness critical. Low Likelihood and Extreme
Consequence
Low Risk: Low-risk condition with additional mitigation contingency planning
(advisory in nature). Low Likelihood and Low Consequence
Emergency Management Australia (EMA) classifies risks in a similar capacity
from Extreme Risk, High Risk, Moderate Risk, and Low Risk (2001). Because a
© 2009 by Taylor & Francis Group, LLC
Risk Analysis 125
“risk level” may be assigned to more than one matrix box, we will not create an
ordered list of risk priorities, but rather several categories of risks with several haz-
ards falling within each category group.
e evaluation can then combine these categories into a spreadsheet to reflect
(Lunn 2003):
Flood Possible major Extreme
Hazard Likelihood Consequence Risk
Drought Likely Major Low
Extreme heat Possible Moderate High
Extreme cold Possible Moderate High
understorm/lightning Almost certain Minor High
To rnadoes Likely Major Extreme
Severe snowstorms Likely Moderate High
Ice storms Unlikely Major High
Land subsidence Rare Minor Low
Earthquake Rare Major High
Transportation accidents Possible Catastrophic Extreme
Hazmat transportation accidents Unlikely Moderate Moderate
Closure of critical transportation routes Unlikely Moderate Moderate
Power failures Possible Moderate High
Water/sewer line failure Unlikely Moderate Moderate
Te lecommunications failure Unlikely Minor Low
Computer systems failure Possible Minor Moderate
Gas line break Unlikely Minor Low
Stored chemical leak/accident Unlikely Moderate Moderate
Sabotage/intentional destruction Possible Major Extreme
Biological communicable disease (plague) Possible Major High
Laboratory accidents Possible Major Extreme
Building collapse Rare Catastrophic High
Building fire Unlikely Catastrophic Extreme
Epidemic Unlikely Major High
Widespread poisoning Unlikely Major High
Water/air contamination Rare Major High
Contaminated medical facilities Possible Major Extreme
Te rrorism Unlikely Major High
Te rrorism-federal and international
Property-destruction Possible Major Extreme
Protest Possible Minor Moderate
Riots Possible Moderate High
Strikes Possible Minor Moderate
Crime Almost certain Moderate Extreme
War Rare Major High
Figure 5.8 Likelihood consequence matrix.
© 2009 by Taylor & Francis Group, LLC
126 Natural Hazards Analysis: Reducing the Impact of Disasters
Likelihood: Is the hazard likely to occur? N
Consequences: What is the seriousness of the impacts of the hazard? N
Level of risk as determined by evaluation on the risk matrix (Extreme Risk, N
High Risk, Moderate Risk, and Low Risk).
Additional considerations including: N
Other organizations or entities that are impacted by the hazard (potential −
partnerships, resources, or interdependence of risk management or haz-
ard mitigation strategies).
Manageability: Adequacy of existing or potential risk management or −
hazard mitigation measures or controls.
Acceptability: Is the risk acceptable from social, political, economic, or −
environmental impacts?
Change in the risk from the hazard: Will the risk remain the same? −
Priority Rating
Once the risk levels of each hazard have been compared to the previously estab-
lished risk evaluation criteria, the risks must be prioritized or ranked. In risk pri-
oritization, we must consider the degree of control over each risk, the cost, benefits,
and opportunities presented by each risk, and decide which risks are unacceptable
at any cost.
It is important to note that this summary matrix of risks may change as risk
management and hazard mitigation strategies are considered. us our risk evalua-
tion provides a better idea of those risks for which mitigation must be conducted at
all costs, due to the absolute unacceptability of the risk. However, for risks whose
mitigation priority ranks are similar, the factors of cost effectiveness of mitigation,
technological availability of mitigation options, and other risk treatment factors will
necessitate revisiting this priority list and reranking risks using new information.
Figure 5.9 provides a risk matrix for assessing the likelihood and consequences
of risks presented by natural hazards (FEMA 2001).
e following definitions were derived for the risk description categories:
Extreme—High-risk condition with highest priority for mitigation and contin-
gency planning (immediate action)
High—Moderate-to-high-risk condition with risk addressed by mitigation and
contingency planning (prompt action)
Moderate—Risk condition sufficiently high to give consideration for further
mitigation and planning (planned action)
Low—Low-risk condition with additional mitigation contingency planning
(advisory in nature)
© 2009 by Taylor & Francis Group, LLC
Risk Analysis 127
Acceptable Risk
Decisions about what risks to treat, what risks to prevent at all costs, and what
risks can be disregarded because of either low consequence, low frequency, or both,
must be considered based on our acceptability of risk. e risk analysis process is
not working in a vacuum, for there are many factors such as political, social, or
economic systems that could affect the determination of what risks are acceptable
and what risks are not.
Once hazards have been identified, analyzed, and evaluated, you have a priority
list of risks that they must consider for treatment. Ideally, they would treat all risks
such that nobody in the community would have to worry about those risks ever
again, but that risk-free-world scenario is inconceivable despite modern technol-
ogy and engineering. While most risks can be reduced by some amount, few can
be completely eliminated, and rarely do the funds exist to reduce all risks by an
amount that is acceptable to all people in the community.
Risk Benefits
Another factor in the problem of risk acceptability relates to the benefits associated
with almost all risks. It is almost universally true that a benefit enjoyed requires some
acceptance or tolerance of an associated risk. Living near a water feature may expose
you to flooding, and a home in a forest could expose you to a wildfire. To completely
eliminate the risk will almost always eliminate associated benefits as well.
Extreme High
RISK
Almost
certain
Likely
Possible
Unlikely
Rare
LOW
CONSEQUENCES
LIKELIHOOD
LOW
HIGH
HIGH
Moderate Low
Insignificant Minor Moderate
Major
Catastrophic
Figure 5.9 Risk matrix. Graphic design by Mary Lee Eggart.
© 2009 by Taylor & Francis Group, LLC
128 Natural Hazards Analysis: Reducing the Impact of Disasters
When determining the acceptability of risk, we may eliminate certain risks
that directly or indirectly establish new ones. For instance, to completely eliminate
the risk from nuclear power generation plants, those plants would need to be dis-
mantled and taken out of service. e resulting shortage of power would require
that fossil fuel–burning plants increase their production, which in turn would cre-
ate increased carbon-based pollution, which would likewise create increased health
and environmental risks.
Determining Risk Acceptability
ere are several factors that together influence the determination of risk accept-
ability. ey include personal, political/social, and economic factors. While the
three are very interrelated, they each are driven by different processes. ese pro-
cesses include individual differences, social and political characteristics of a com-
munity, and economic considerations.
Personal
Differences in individual acceptance between risks that are voluntary and involun-
tary in nature are greatly determined by what we see as the benefit from the risk.
We are more likely to accept a voluntary risk if we perceive that the benefit is great.
Many recreational activities and sports involve considerable levels of personal risk
entered into voluntarily. Indeed, the thrill of the risk may be part of the enjoyment
of the recreation. When the benefits of a risk outweigh the costs, then the percep-
tion of the risk is reduced. In this case the threat level may be considered accept-
able. is is especially true when even a high risk is voluntary, as compared to one
that is imposed from outside or involuntary. We may tolerate voluntary risks simply
because we have learned to adjust to them.
Our personal views of risk and hazards may be what we determine as acceptable
risk and associate with our experience with crises and disasters. We may have seen
firsthand the potential outcomes from accepting a voluntary risk and believe that
the likelihood of harm is so great that we avoid the risk altogether.
In addition to our willingness to accept risk voluntarily, risk may be associated
with our individual values, educational experiences, exposure to media coverage of
risk, and our individual tolerance of risk.
Political/Social
Because of the differences in the makeup of different communities and popula-
tions, risks acceptance will not be universal in all communities and cultures. Risk
acceptance is likely to change from place to place, from time to time, and from
hazard to hazard (Alesch et al. 2001). Acceptability is likely to change even within
individual communities over time as the makeup of that community changes. It
© 2009 by Taylor & Francis Group, LLC
Risk Analysis 129
is these differences that make the wide public participation in the hazards analy-
sis process so important. Communities that have recently experienced directly the
impacts from a disaster will likely be more willing to learn more about a hazard
impact and take some type of action.
Economic
Economic considerations of risk are viewed by federal agencies such as the U. S.
Army Corps of Engineers from a cost–benefit perspective. e costs of reducing
a risk will need to be compared to the benefits (actual risk reduction) that would
result. Regulatory agencies such as the U.S. Departments of Energy, Transportation,
or Environmental Protection assess risk indirectly, for in most cases private enter-
prises directly deal with the hazardous substance. eir consideration includes cost
factors, but the overall public health and environmental sustainability are higher
priorities. Local government agencies have building departments that permit and
inspect building codes and safety. Cost benefit is a consideration in the initial
adoption of regulations, but extreme events such as hurricanes can motivate public
officials to strengthen the codes to protect property from the hazard. Cost consid-
erations may not be the primary driver of the new standards.
Risk Strategies
Accept the Risk
One option is to simply accept the risk, given the present situation and resources
of the community. A specific hazard may be considered a low probability of occur-
rence, and as a result, spending any amount of money would be counterproductive,
considering some greater risk reduction that could be gained by using the money
to treat another, more severe hazard. e risks that fall within the lowest category
of both consequence and likelihood are generally the risks that are considered as
acceptable. Members of a community may also believe that the level of risk can
be mitigated so as to reduce most adverse consequences. Homeowners who have
invested in reducing the vulnerability of their homes and business property may
believe that they can withstand a disaster event with limited property damage.
ey therefore accept the level of risk as they experience it.
Extremely Low Likelihood of Risk
A “de minimis” risk level suggests that the statistical probability of a specific
risk from a hazard is so low that concern is not merited. is level is often set
at either 1 in 100,000 or 1 in 1,000,000 and is set for a one-year period, or a
lifetime (70 years). e term de minimis is a shortened version of the Latin
© 2009 by Taylor & Francis Group, LLC
130 Natural Hazards Analysis: Reducing the Impact of Disasters
phrase “de minimis non curat lex” which means “the law does not care about
very small matters.” is concept is widely used to set guidelines for levels of
risk exposure to the general population such as the chance of personal injury in
an airline crash or train derailment or the risk of a reaction from an over-the-
counter medicine. For instance, the Environmental Protection Agency (EPA)
has set de minimis risk levels for human lifetime risk from pesticides at 1 in
1,000,000 over a 70-year lifetime. e FDA (Food and Drug Administration)
and the USDA (U.S. Department of Agriculture) are working on similar regula-
tions of risk for food safety.
Mandatory Risk Level
is type of risk is considered one that is so great that it is mandatory that action
be taken to deal with it. It is viewed as an “obnoxious risk” that cannot be ignored,
and strategies to reduce vulnerability are mandatory. In practice, this level is gen-
erally set at a 1 in 10,000. is practice is often cited in regards to second-hand
smoke exposure or accidents in the workplace where safety measures or procedures
are required.
Critical inking: A tool that can be helpful in understanding the implications
of risk is a cost–benefit analysis where we examine alternatives to address a risk
including their costs. We then examine the benefits gained by the funds expended.
Associated to a cost–benefit analysis is the cost–effectiveness assessment, which
examines the minimum unit cost to reduce a maximum level of risk. Consider the
risks associated with flooding in a flood zone for an existing older home which is
constructed on piers rather than one with a slab on grade foundation. If the unit
cost of raising the house is reduced when at least five houses are elevated, then the
benefits might outweigh the cost.
Discussion Questions
Would you classify a risk as voluntary or involuntary where factors influencing
the frequency and severity of local flooding have changed without the knowl-
edge of the community?
What risks would be included as obnoxious where mandatory action is required?
What risks do you consider to be unacceptable where others have determined
that they can live with the hazard? What do personal views, values, beliefs, or
your personality contribute to this conclusion associated with a risk?
© 2009 by Taylor & Francis Group, LLC
Risk Analysis 131
Applications
Using the risk matrix categories included in Figure 5.8 and Figure 5.9, examine
the hazards in your community and categorize their likelihood and damage conse-
quences from low to extreme.
Web Sites
AIHA. Emergency Response Information. e ERPG guidelines are clearly defined and are
based on extensive, current data. e rationale for selecting each value is explained, and
other pertinent information is also provided.
National Climatic Data Center (NCDC). />come.html
Storm Prediction Center. Storm Prediction Center product and report archive page. NOAA/
National Weather Service, Storm Prediction Center. />index.html
National Hurricane Center, See Hurricane History at />Advanced National Seismic System. ANSS Composite Earthquake Catalog. Advanced
National Seismic System, Northern California Earthquake Data Center. http://quake.
geo.berkeley.edu/cnss/
Catalog of Significant Earthquakes. National Geophysical Data Center: http://wwwngdc.
noaa.gov/seg/hazard/eqint.html
Earthquakes. Earthquake Research Institute, the University of Tokyo, Japan. http://www.
eri.u-tokyo.ac.jp/index.html
U.S. EPA. Surf your watershed. Watershed flood monitoring program. />surf/locate/index.cfm
USGS. WaterWatch—Maps and graphs of current water resources conditions. River gauges
in the United States for active stations. />References
Alesch, D. J., J. Holly, E. Mittler, and R. Nagy (2001). Organizations at Risk: What Happens
When Small Businesses and Not-for-Profits Encounter Natural Disasters? Public Entity
Risk Institute, Fairfax, VA.
Benson, M. A. (1967). “Uniform Flood-Frequency Estimating Methods for Federal Agencies.”
Water Resources Research. U.S. Geological Survey. Vol. 4, #5, pp. 891–908.
Cameron, G. 2002. “Emergency Risk Management: What Does It Mean?” ATEM-
AAPPA 2002 Conference, Brisbane, Australia. />papers/2002_AAPPA_Brisbane/G_Cameron.pdf.
Cutter, S. L. (2001). “Charting a course for the next two decades,” American Hazardscapes: e
Regionalization of Hazards and Disasters. Susan L. Cutter Ed., Joseph Henry Press.
De Marchi B. and J. R. Ravetz (1999). Risk management and governance: a post-normal
science approach. Futures 31(7):743–757.