Sustainable Growth and Applications in Renewable Energy Sources Part 8 pptx
Bạn đang xem bản rút gọn của tài liệu. Xem và tải ngay bản đầy đủ của tài liệu tại đây (939.11 KB, 20 trang )
Structural Design of a Dynamic Model of the Battery for State of Charge Estimation
131
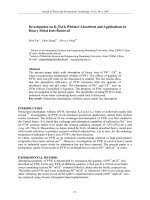
Fig. 4. Concentration profile (Stationary 1D Model)
Let us point out this symmetry property which will generalize for the dynamical case.
Following the boundary condition (3a and 3b) we find:
For currents, the anti symmetry property: I
S
(L-z) = - I
S
(z)
For densities, the symmetry property: n
s
(L-z) = n
s
(z)
3.2.1.3 Voltage and concentration
According to the electrochemical model defined above, while applying Nernst’s equation
(Marie-Joseph, 2003); we obtain the expression of voltage as a function of the limit
concentrations in the form:
.
44
1
4
(0) ( ) ( )
(0) ( )
22
ln ln
H
ss
PbSO PbSO
kT kT
LL
aaL
ee
nnn
VA
. (8a)
In this relation, we may use the fact that:
According to the neutrality condition (section 3.2.1.2), n
H
= 2n
S
Due to the symmetry of concentrations, n
s
(L)=n
s
(0).
Concerning PbSO4 activity, it is equal to one, unless we are very close to full charge
(this will not be considered here).
In such conditions, the expression of battery voltage may be set in the form:
2
3
(0)
ln
s
kT
e
VA n
(8b)
Let n
0
be a reference sulfate concentration and E
0
the corresponding Nernst voltage, then the
relation may be written in the form:
0
0
(0)
ln
3
s
L
L
n
VEV
n
kT
V
e
(8c)
Sustainable Growth and Applications in Renewable Energy Sources
132
This result corresponds to point d) in introduction (3.2.1.1).
3.2.1.4 “Linearised” pseudo-voltage using an exponential transformation
We suggest to introduce a “pseudo-voltage” which is à linear function of the concentration,
and which aims to the voltage
V when it is close to the reference voltage E
0
, according to
figure 5:
0
0L 0LL
00
+ -V=E V E V V
nn n
ss
nn
(9)
V
V
Fig. 5. Linearised Pseudo-voltage
The pseudo voltage may then be obtained by an exponential transformation of the original
voltage according to the expression:
00
-
0L 0LL
LL
EE
V=E + V exp 1 E V V exp
VV
VV
(10)
3.2.1.5 Constant current equivalent circuit
According to figure 4, the limit concentrations (for z=0 and z=L) are easily expressed, and
may be related to the total stored charge Q
S
and the internal current I:
s
ss s
0
ss
s
ss
0
dn
n0 n n
6
Qn
dn
I (0) J (0) 3
s
L
L
dz
SL
ISSkT
dz
(11)
According to equations (8) and (11), the voltage may be expressed in terms of the stored
charge Q
s
and the internal current I according to:
Structural Design of a Dynamic Model of the Battery for State of Charge Estimation
133
S
0
0
2
Q-θI
3kT
V = E+ ln
θ =
18
s
L
kT
(12)
Relation (12) may be written in terms on an RC model valid only for constant current charge
or discharge in the form:
0
S
S
LD
D
Q- I
Q
VV -RI
QC
(13)
With C
D
= Q
0
/V
L
and R
D
= θ/C
D
V
Fig. 6. RC equivalent circuit for constant current (after linearization)
3.2.2 Dynamical model for time varying current
3.2.2.1 General diffusion equations (one dimension)
In the general case, current densities and concentrations densities depend both on z and t.
Equation (7) may be written in term of partial derivative:
3
nJ
ss
zkT
s
(14)
We may add the charge conservation equation:
s
J
n
s
=- =2e
zt t
(15)
These two coupled Partial Derivative Equations define the diffusion process (Lowney et al.,
1980).
The driving condition is given by relation:
()
(0, ) ( )
It
JtJt
s
S
(16)
And the bounding condition resulting of the current anti symmetry:
(,) (0,)JLt J t
ss
(17)
Sustainable Growth and Applications in Renewable Energy Sources
134
3.2.2.2 General electrical capacitive line analogy
In the diffusion equations (14) et (15), making use of relation (9), the sulfate ion density n
S
may be expressed in terms of the pseudo potential
V
, and the current densities Js may be
replaced by currents Is = S Js. We then obtain a couple of joint partial derivative equations
between the pseudo voltage
V
(z,t) and the sulfate current Is(z,t) :
SS
LL
00
S0S
L
I
Vn
VV
s
znznμ
s
I
JnV
s
2
zz V
kT S
SeS
t
(18a)
These are the equations of a capacitive transmission line with linear resistance and linear
capacity as defined below.(Bisquert et al., (2001).
0
0
1
2
L
V
s
I
s
zeSn
s
IV
en S
ss
zt V
(18b)
Taking in account the symmetry of the concentrations, we obtain an equivalent circuit
consisting in a length L section of transmission line, driven on its ends with symmetric
voltages. The current is then 0 in the symmetry plane at L/2. The input current is the same
as for a L/2 section with open circuit at the end.
(Open circuit capacitive transmission line of length L/2)
Fig. 7. Equivalent electrical circuit for the pseudo-voltage
Structural Design of a Dynamic Model of the Battery for State of Charge Estimation
135
3.2.2.3 Equivalent impedance solution
For linear systems, we look for solutions in the form A exp(pt) for inputs, or A(z) exp(pt)
along the line, p being any complex constant.
Let:
(,) ()exp
(,) ()exp
Izt Iz pt
Vzt Vz pt
(19)
Then we obtain the simplified set of equations
dV
s
I
s
dz
dI
s
p
V
s
dz
(20)
Whence
2
2
dI
s
=I
s
dz
p
Let = /L
2
. Then - and be the solutions of :
2
2
pp
L
(21)
Then solution for Is(z) is a linear combination of
exp z
. If we impose I
s
(L/2)=0, then
() -
2
L
Iz Ish z
s
(22)
Whence:
1
() -
2
L
Vz Ich z
s
(23)
We then get the Laplace impedance at the input of the equivalent circuit:
(0)
()
(0)
2
V
s
Zp
L
I
s
th
(24)
if
1
22
LL
Lth
1
()
2
Zp
C
p
L
C
(25)
Sustainable Growth and Applications in Renewable Energy Sources
136
In case of harmonic excitation (p = j) this corresponds to small frequencies (<<1). The
impedance is the global capacity of the line section. In practice for batteries (Karden et al.,
2001), this corresponds to very small frequencies (10
-5
Hz)
if
1 1
2
L
Lth
-1/2
()Zp p
(26)
In case of harmonic excitation (p = j) this corresponds to high enough frequencies (>>1)
the impedance is the same as for an infinite line (Linden, D et al., 2001), corresponding to the
Warburg impedance.
3.2.2.4 Approximation of the Warburg impedance in terms of RC net
An efficient approximation of a p
-½
transfer function is obtained with alternate poles and
zeros in geometric progression. In the same way, concerning Warburg impedances an
efficient implementation (Bisquert et al., 2001) is achieved by a set of RC elements in
geometric progression with ratio k, as represented in figure 8.
Let
0
= 1/RC. Note that the progression of the characteristic frequencies is in ratio k
2
.
Fig. 8. RC cells in geometric progression
Let Y() be the admittance of the infinite net. It is readily verified that
-
For =
0
, Y(
0
) may be set in the form Sk/(1-j), with real Sk (complex angle exactly
/4)
-
Y(k
2
0
) = k Y(
0
) (Translation of one cell in the net)
It can be verified by simulation that the fitting is quite accurate, even for values up to
k=3.
3.2.3 Approximation of a finite line in terms of RC net
The simplest approximation would to use a cascade of N identical RC cells simulating
successive elementary sections of line of length
L =L/2N. with: r =
L and c =
L
Structural Design of a Dynamic Model of the Battery for State of Charge Estimation
137
Fig. 9. Elementary approximation by a cascade of identical RC cells
This approximation introduces a high frequency limit equal to the cutoff frequency of the
cells f
N
= 1/2
rc. Drawing from the previous example concerning Warburg impedance, we
propose to use (M+1) cascaded sections but with impedance in geometric progression.
Fig. 10. Approximation by a cascade of RC cells in geometric progression
The total capacity will be equal to the total L/2 line capacity. The frequency limit for the
approximation remains given by the first cell cutoff frequency.
For instance for k =3 this may result in a drastic reduction of the number of cells for a given
quality of approximation.
3.2.4 Practical RC model used for experimentations
In practice, the open circuit line model will be valid only if the entire electrolyte is between
the cell plates. In practice this is usually not true. For our batteries, about one half of the
electrolyte volume was beside the plates. In such case there is an additional transversal
transport of ions, with still longer time constants. This could be accommodated by an
additional RC cell connected at the output of the line.
Fig. 11. Transmission line with additional RC cell
Satisfactory preliminary results for model validation were obtained with a much simplified
network, with an experimental fitting of the component values (Fig 11).
Sustainable Growth and Applications in Renewable Energy Sources
138
We may consider that c and c1 (c<<c1) account for the transmission line impedance, while
Cx, Rx (Cx in the order of C1 ) accounts for external electrolyte storage.
Fig. 12a. Diffusion/storage model -1-
Provided that C
D
<< C
1
connection as a parallel RC cell should not modify drastically the
resulting impedance. This model was introduced in order to separate “short term” and
“long term” overvoltage variations in the experimental investigation.
Fig. 12b. Diffusion/Storage model -2-
4. Activation voltage
4.1 Comparison to PN junction
A PN junction is formed of two zones respectively doped N (rich in electrons: donor atoms)
and P (rich in holes: acceptor atoms). When both N and P regions are assembled (Fig. 13), the
concentration difference between the carriers of the N and P will cause a transitory current
flow which tends to equalize the concentration of carriers from one region to another. We
observe a diffusion of electrons from the N to the P region, leaving in the N region of ionized
atoms constituting fixed positive charges. This process is the same for holes in the P region
which diffuse to the N region, leaving behind fixed negative charges. As for electrolytes, it
then appears a double layer area (DLA). These charges in turn create an electric field that
opposes the diffusion of carriers until an electrical balance is established.
Structural Design of a Dynamic Model of the Battery for State of Charge Estimation
139
Fig. 13. Representation of a PN junction at thermodynamic equilibrium
The general form of the charge density depends essentially on the doping profile of the
junction. In the ideal case (constant doping “N
a
and N
d
”) , we can easily deduce the electric
field form E(x) and the potential V(x) by application of equations of electrostatics (Sari-Ari et
al.,2005). In addition, the overall electrical neutrality of the junction imposes the relation:
an d
p
NW NW
(27)
with W
n
and W
p
corresponding to the limit of DLA on sides N and P respectively (Fig. 13).
It may be demonstrated that according to the Boltzmann relationship, the corresponding
potential barrier (diffusion potential of the junction) is given by:
0
2
ln ,
ad
TT
kT
NN
VU U
n
e
i
(28)
where n
i
represents the intrinsic carrier concentration. On another hand, note that the width
of the DLA may be related to the potential barrier (Mathieu H, 1987).
The PN junction out of equilibrium when a potential difference V is applied across the
junction. According to the orientation in figure 14, the polarization will therefore directly
reduce the height of the potential barrier which becomes (V
0
-V) resulting in a decrease in the
thickness of the DLA. (Fig. 14)
Fig. 14. Representation of a PN junction out of equilibrium thermodynamics
Sustainable Growth and Applications in Renewable Energy Sources
140
The decrease in potential barrier allows many electrons of the N region and holes from the P
region to cross this barrier and appear as carriers in excess on the other side of the DLA.
These excess carriers move by diffusion and are consumed by recombination. It is readily
seen that the total current across the junction is the sum of the diffusion currents, and that
these current may be related to the potential difference V in the form (Mathieu H, 1987):
exp - 1
T
V
JJ
s
U
(29)
where Js is called the current of saturation.
On the other hand the diffusion current is fully consumed by recombination with time
constant , so that the stored charge Q may be expressed as Q = J. This expression will be
used for the dynamic model of the diode.
4.2 Comparison of PN junction and electrochemical interface
From the analysis of PN junction diodes, following similarities can be cited in relation to
electrochemical interfaces (Coupan and al., 2010):
The electrical neutrality is preserved outside an area of "double layer" formed at the
interface electrode / electrolyte.
In the neutral zone, conduction is predominantly by diffusion.
The voltage drop located in the double layer zone is connected to limit concentrations of
carriers by an exponential law (according to the Nernst’s equation in electrochemistry,
the Boltzmann law for semi-conductors).
However, significant differences may be identified:
For the PN junction, it is the concentration ratio that leads to predominant diffusion
current for the minority carriers by diffusion. For lead acid battery, it is the mobility
ration that explains that
2
4
SO
ions move almost exclusively by diffusion
There is no recombination of the carriers in the battery. As a result, in constant current
operation the stored charge builds up linearly with time, instead of reaching a limit
value proportional to the recombination time.
The diffusion length is in fact the distance between electrodes, resulting in very long
time constants (time constants even longer if one takes into account the migration of
ions from outside the plates).
within the overall "double-layer", additional "activation layers" build up in the presence
of current, corresponding to the accumulation of active carries close to the reaction
interface.
Based on method for modeling the PN junction, and the comparison seen above, we propose
to analyze and model the phenomenon of activation in a lead-acid battery.
4.3 Phenomenon of non-linear activation
The activation phenomenon is characterized by an accumulation of reactants at the space
charge region. This electrokinetic phenomenon obeys to the Butler-Voltmer: exponential
variation of current versus voltage, for direct and reverse polarization (Sokirko Artjom et al.,
1995). Dynamical behavior can be introduced using a “charge driven model”, familiar for
PN junctions, connected to an excess carrier charge Q stored in the activation phenomenon.
Bidirectional conduction can be accommodated using two antiparallel diodes. Based on the
Structural Design of a Dynamic Model of the Battery for State of Charge Estimation
141
for one single PN junction, the static and dynamic modeling of a diode is given by the
current expression:
0
0
1
V
a
st s
Q
v
IJe
Qt
dQ
I
dt
(30)
with Q representing an amount of stored charge and a time constant τ associated.
It is noted that one can easily model the current through the diode with an equivalent model
of stored charge; this approach is valid for one current direction and not referring to the
battery charge. We must therefore provide a more complete model that can be used in
charge or discharge. This analysis therefore reflects a model with two antiparallel diodes.
The static and dynamic modeling of the two antiparallel diodes is given by the current
expression (simplified symmetric model):
0
()
S
a
st a
V
IGVJsh
v
(31)
The static relation corresponds to the Butler Volmer equation (symmetric case). It is
completed by the charge driven model:
()
st a
st
QI GV
dQ
II
dt
(32)
After an analysis resulting static (and dynamic) and an experimental validation, we get the
model of the phenomenon of activation with a parallel non linear capacitance and
conductance circuit (fig.15) whose expressions are given by the following equations:
00
00 00
() ()
aa
st a a
J
VcV
I G V sh and Q V sh
vv vv
(33)
Fig. 15. Activation model : non-linear capacitance and conductance
I
V
a
V
a
I
Sustainable Growth and Applications in Renewable Energy Sources
142
5. Overvoltage model and experimental validation
By combining models obtained (diffusion phenomena/Storage, activation and input cell)
and experimental measurements, we propose a simple and effective model of the battery
voltage.
s
V
(R≈2.5 10
-3
Ω, γ=400F, C
0
=2.3 10
4
F, c=3.2 10
4
F, r
1
=2.5 10
-3
Ω, c
1
=C
x
=5 10
5
F, R
x
=0.01 Ω)
Fig. 16. Overvoltage model of lead acid battery
5.1 Experimental analysis
Identification of a linear model may be delicate, but there are a lot of classical well trained
methods for this.
For a non linear system, it is difficult to find a general approach.
For most cases, it is possible to separate steady state non linear set point positioning, then
local small signal linear investigation.
For battery, the set point should be defined by the state of charge and the operating current.
But the fact that when you apply a non zero operating current, the state of charge is no
longer fixed. This is an important practical problem, all the more critical as there is a the
strong dependence of the activation impedance with respect to the current. The
experimental methodology presented is centered on this non linearity topic.
5.2 Separation on the basis of the time constant
Our objective is to establish the static value of the activation voltage as a function of
current. The problem is that if the current scanning is too slow the variation of the state of
charge will corrupt the measure.In such condition we can never reach the static value.
Typical results are given in fig 17, compare to charge driven dynamical models as
discussed in section 4.
5.3 Correction of battery voltage connected to the state of charge
A first hypothesis is that for slowly varying current the voltage drift is a function of the
stored charge Q, computed by summation of the current. 3D plots are made as a function of
the couple I, Q, with current steps to identify the relaxation time and asymptotic value as
representative of the storage voltage or activation steps. (Fig.18)
Structural Design of a Dynamic Model of the Battery for State of Charge Estimation
143
Fig. 17. Experimental analysis and simulation of activation phenomena
Fig. 18. Highlight of the diffusion and activation process
Sustainable Growth and Applications in Renewable Energy Sources
144
5.4 Improved storage voltage estimation
Instead of using Q as a reference for the storage voltage, we use the voltage given by the
optimized RC storage net. Again the plot is made for steps between constant values of the
current. We can see that between curves corresponding to two given values of the current,
there remains a variation of the activation voltage.
Fig. 19a. General Validation of diffusion/stockage and activation phenomena
5.5 Effect of the non linear voltage transformation
The same points are plotted using the pseudo-voltage after exponential transform. We see
that now the plot between two given values of the current, which constitutes a good
validation of the non linear model.
Fig. 19b. Reduction of activation voltage variations by linearisation
6. Conclusion
Electrochemical batteries are becoming quite usual components for electrical engineers. One
of our purposes was to provide a good understanding for such users, by the way of a short
form equivalent circuit.
This equivalent circuit sums up the different steps of a simplified physical analysis. Two
most important aspects may be cited:
V
in-Eo
s
V
V
s
V
Structural Design of a Dynamic Model of the Battery for State of Charge Estimation
145
- Investigation of nonlinearities
-
Efficient lumped model for diffusion
6.1 Investigation of nonlinearities
Characterization of dynamical non linear systems is quite complex. Purely
phenomenological description may lead to a huge number of parameters for imperfect
results.
From our physical analysis, nonlinearities are summarized by two simple elements:
-
The exponential mapping of voltage into a “pseudo-voltage” proportional to ionic
concentration. Diffusion processes may then be described in terms of linear equivalent
impedance
-
The activation overvoltage, described in static by Butler Volmer equations, for which
we propose a dynamical model drawing from an analogy with semiconductor diodes
(charge driven model with given relaxation time)
6.2 Efficient lumped model for distributed parameters systems
For non specialists, the “Warburg impedance” may look a very esoteric electrochemical
topic. We introduce an analogy with a subject quite trivial for electronic engineers,
capacitive transmission lines. Approximation of such distributed parameter device by
lumped RC network has been the subject of a lot of papers (Kuhn et al., 2006 and Mauracher
et al., 1997). We propose an efficient approximation with RC cells in geometric progression.
6.3 Possible extensions
We consider that our analysis constitutes an important contribution to the understanding of
battery operation, in particular for electronic engineers. It opens the way for inclusion in
efficient control of complex systems, either in the field of power managing or signal
processing.
7. References
Bard A. (2000). Electrochemical Methods, Fundamental and Applications, 2
nd
ed., Harris D.,
(Ed), John Wiley & Sons, ISBN 0-471-04372-9.
Bisquert, J.,Compte, A. (2001). Theory of the electrochemical impedance of anomalous
diffusion,Journal of Electroanalytical Chemistry, vol. 499, pp. 112-120.
Blanke, H., Bohlen, O., Buller S., De Doncker, R.W. Fricke, B., Hammouche, A., Linzen, D.,
Thele, M., et Sauer ,D.U. (2005), “Impedance measurements on lead-acid batteries
for state-of-charge, state-of-health and cranking capability prognosis in electric and
hybrid electric vehicles,” Journal of Power Sources,vol. 144, pp. 418-425.
Coleman, M.; Chi Kwan Lee; Chunbo Zhu; Hurley, W.G.(2007). State-of-Charge
Determination From EMF Voltage Estimation: Using Impedance, Terminal Voltage,
and Current for Lead-Acid and Lithium-Ion Batteries, IEEE Transactions on
Industrial electronics, Vol. 54, pp. 2550 - 2557.
Coupan F., Sadli I., Marie-Joseph I., Primerose A., Clergeot H.(2010). New Battery dynamic
Model: Application to lead-acid battery, The 2nd International conference on
computer and automation Engineering. Electrical and energy systems of IEEE
volume 5 pp 140-145, Singapore, 26-28 Feb, 2010.
Sustainable Growth and Applications in Renewable Energy Sources
146
Esperilla J., Félez J., Romero G., Carretero A.(2007). A model for simulating a lead-acid
battery using bond graphs, Simulation Modelling Practice and Theory, vol. 15, pp.
82-97, 2007.
Garche J., Jossen A., Döring H.(1997). The influence of different operating conditions,
especially overdischarge, on the lifetime and performance of lead/acid batteries for
photovoltaic systems, Journal of Power Sources,vol. 67, pp. 201-212, 1997
Henri Mathieu, Dunod, ISBN 2-10-048633-0 (1987), Physique des semi-conducteurs et
composants électroniques.
Karden, E.; De Doncker, R.W.(2001). The non-linear low-frequency impedance of
lead/acidbatteries during discharge, charge and float operation,
Telecommunications Energy Conference, 2001. INTELEC 2001. Twenty-Third
International, pp. 65-72.
Kuhn, E., Forgez, C., Lagonotte, P., Friedrich, G. (2006). Modelling Ni-mH battery using
Cauer and Foster structures, Journal of power sources, vol. 158, pp. 1490-1497.
Landolt D.(1993). Corrosion et chimie de surfaces des métaux, Traite des matériaux, Presses
Polytechniques et Universitaires Romandes, 1993.
Linden, D. and Reddy, T.B. McGraw-Hill, ISBN 0-07-135978-8 (2001). Handbook of Batteries.
Lowney, J.R.; Larrabee, R.D. (1980). Estimating the state of charge of a battery, IEEE
Transactions on Electron Devices, Vol. 27, pp. 1795-1798.
Manwell Jams F., McGowan Jon G. (2003). Lead acid battery storage model for hybrid
energy systems, Solar Energy, vol. 50, pp. 399-405, 2003
Marie-Joseph, I., Diagnostic methodology applied to preventive maintenance units of
electricity production in isolated sites, PhD Thesis, Université des Antilles et de la
Guyane 2003.
Marie-Joseph I., Clergeot H., Oukaour A., Linguet L. (2004). Dynamic model of an
electrochemical accumulator, 19th European Photovoltaic Solar Energy
Conferenceand Exhibition Proceeding, 2004.
Mauracher, P., Karden, E. (1997). Dynamic modeling of lead/acid batteries using impedance
spectroscopy for parameter identification, journal of power sources, vol. 67, pp. 69-
84.
Riffonneau Y., Barruel F., and Bacha S.(2008). Problématique du stockage associé aux
systèmes photovoltaïques connectés au réseau, Rev. Energ. Ren,vol. 11, pp. 407-422,
2008
Sari-Ari I., Benyoucef B., et Chikh-bled B.(2005). Etude de la jonction PN d'un semi-
conducteur a l'équilibre thermodynamique, Journal of Electron Devices,vol. 5,
pp.122-126,
Sokirko Artjom, V., Bark Fritz, H.,(1995). Diffusion-migration transport in a system with
butler-volmer kinetics, an exact solution, electrochimica Acta, vol. 40, pp. 1983-
1996.
8
Parameterisation of the Four Half-Day
Daylight Situations
Stanislav Darula and Richard Kittler
Institute of Construction and Architecture, Slovak Academy of Sciences, Bratislava,
Slovakia
1. Introduction
The International Commission on Illumination (C.I.E) in its Technical Committee TC 3-08
for Daylight initiated in 1983 the so called International Daylight Measurement Programme
(IDMP). This programme was officially launched by the CIE President Bodmann (1991) and
several CIE IDMP stations were established world-wide and now relatively long-term
regular data are available for studies and analysis (Kittler et al., 1992). Although some daily
courses served to characterise luminance sky patterns and local daylight climate, there are
possible more detail analysis of half-day situations with relation to sunshine duration,
cloudiness and turbidity influences parametrised. This chapter tries to show the theoretical
basis with documented applications using examples of several parametrised evaluations of
measurements taken at the Bratislava and Athens CIE IDMP general stations which can be
taken as instructing samples to be imitated using local measured data. The aim is also to
show how momentary illuminance values correspond with hourly averages under four
different daylight situations and how these half-day situations can be simulated when only
monthly relative sunshine duration is available and when monthly or year-round random
daylight conditions are needed and could be approximated.
2. Regular daylight measurements and their possible analysis
Since the CIE (2003) and ISO (2004) fifteen general homogeneous sky luminance patterns were
standardised many CIE IDMP (International Daylight Measurement) stations recording
regularly long-term daylight parameters try to evaluate the frequency of typical skies in their
localities. Because the general CIE IDMP stations without sky luminance scanners sometimes
do not record even zenith luminance
vz
L simultaneously with diffuse skylight illuminance
measurements
v
D there are missing either sky scans or the classifying parameter /
vz v
LD,
which could identify the momentary sky type. Thus, usually are only available data of
regularly measured illuminance parameters in one minute steps during daytime, i.e.:
- Global horizontal illuminance by an unshaded detector
v
G ,
- Diffuse skylight illuminance on a horizontal sun-shaded detector
v
D ,
- Parallel sunbeam illuminance is sometimes measured by a sun tracker with a sky-
shading cylinder and a detector placed perpendicularly to sunbeam flux
v
P
,
- Global vertical illuminances on planes oriented to North
vvN
G , East
vvE
G , South
vvS
G
and West
vvW
G excluding the ground reflection.
Sustainable Growth and Applications in Renewable Energy Sources
148
A clock controling system starting every minute count has to be recorded too either in local
clock time LCT or true solar time TST . These regular measurements can serve for the
specification of daylight situations during the half-day or to the rough identification of the
sky type in any minute, hour or date.
In fact even in absence of the sun tracker the
v
P
illuminance can be derived from
v
G and
v
D recordings as
sin sin
vv v
v
ss
GD P
P
lx, (1)
where
sin
vv s
PP
is the horizontal illuminance caused by only parallel sunbeams in lx,
s
is the momentary solar altitude which can be determined for any station location, date
and clock time after:
sin sin sin cos cos cos(15 )
s
H
(2)
The station location is given by the geographical latitude
in deg., while date is specified
by solar declination
and hour number H during daytime in TST .
Solar declination angle can be calculated for any day number within a year
J (i.e. for 1
st
January
1J and for 31
st
December 365J
) using different approximate equations (e.g.
Kittler & Mikler, 1986). The simplest is that introduced by Cooper (1969)
360
23.45 sin 284
365
J
°, (3)
and a more accurate approximation was recommended by EU after Gruter (1981)
360
23.45 sin 80.2 1.92 sin 280
365
JJ
[°]. (4)
Because usually CIE IDMP stations record all measurements in local clock time LCT the
value
H in TST has to be recalculated without consideration of summer shift time, after
15
zL
HLCT
h, (5)
where
is the equation of time in hours approximated after a simpler formula by Pierpoint
(1982)
0.17sin 4 80 /373 0.129sin 2 8 /355JJ
[h], (6)
or a more accurate formula by Heindl & Koch (1976)
360 360 360
0.008cos 0.052cos2 0.001cos3
365 365 365
360 360 360
0.122sin 0.157sin2 0.005sin3
365 365 365
JJJ
JJJ
h, (7)
Parameterisation of the Four Half-Day Daylight Situations
149
z
is geographical longitude of the time zone in deg.,
L
- geographical longitude of the location in deg.
The perpendicular parallel sunbeam illuminance at the ground level can be also calculated
applying the Bouguer law, i.e.
exp
vvv
PLSC amT
lx, (8)
where LSC is the luminous solar constant (Darula et al., 2005), which is the normal
extraterrestrial illuminance on the outer border of the atmosphere for the average distance
between sun and earth, approximately
133800LSC
lx., which is corrected for any date by
the ellipticity factor
, which is often approximated by IESNA (1984)
360
10.034cos 2
365
J
-, (9)
m - relative optical air mass approximated by Kasten & Young (1989)
1.6364
1
sin 0.50572 6.07995
ss
m
-, (10)
v
a - luminous extinction coefficient of a clean and dry (Rayleigh) atmosphere after Clear
(1982), later published by Navvab et al., (1984)
0.1
1 0.0045
v
a
m
-, (11)
or
1
9.9 0.043
v
a
m
-, (12)
v
T - luminous turbidity factor, which defines the number of clean and dry atmospheres in
the direction of sunbeams that reduces relatively its momentary penetration. In fact, if in
eq. (8)
v
P
is measured by a sun tracker or
v
P is derived from measured
vv
GD
data, then
the actual value
v
T can be determined as
ln /
ln /
v
vv
v
vv
PLSC
EP
T
am am
-, (13)
where
vvv
PGD and the extraterrestrial horizontal illuminance
v
E is
sin
vs
E LSC
lx. (14)
Thus, once the momentary illuminance
v
P
or
v
P is determined the actual sunlight impact
on any arbitrary plane can be calculated using the cosine of its incidence angle. However,
for the vertical planes oriented either to direct East or West cardinal points this cosine
function is simplified to
Sustainable Growth and Applications in Renewable Energy Sources
150
cos sin 15 12
vvE vvW v
PP P H
lx. (15)
Note, that the East and West oriented vertical planes or fasades are exposed to the morning and
afternoon half-day sunlight and skylight effects as measured by global vertical illuminances
vvE
G or
vvW
G respectively. So, when the direct sunlight using eq. (15) can be subtracted only
diffuse skylight components for these orientations can be determined, i.e.
vvE
D or
vvW
D .
3. Four typical half-day situations indicated by illuminance courses
In the previous paper (Darula & Kittler, 2004a) from typical half-day illuminance courses
were identified four characteristic daylight situations, which need to be explained in more
detail:
Situation 1: Absolutely cloudless half-day with relative sunshine duration 0.75s and
the parameter of instability 8.4U
is almost clear with only few smaller clouds moving
over the sky vault. Except these few sunshaded events the clear sky is quite stable and
all horizontal illuminance parameters
v
P ,
v
G and
v
D follow a fluent increase in level
during the morning hours and similar decrease during the afternoon due to solar
altitude changes in different seasons.
Examples of selected half-days with situation 1 are using recorded data from the Bratislava
CIE IDMP general station (
= 48°10´N,
L
= 17°05´E) with the Central European climatic
influences, but these should be taken as instructional and illustrative examples
characterising typical cases of situation 1. As examples of clear sky mornings in Bratislava,
Slovakia, were chosen courses measured during a long summer day on the 20
th
July 2006
followed by an autumn day on 22
nd
September 2007, while a short winter day 26
th
December 2006 represents one of the shortest days and the spring day 8
th
April 2006 with
slight veiling Cirro-Stratus influences is also documented. The measured half-day courses
of global horizontal illuminance
v
G and diffuse sky illuminance
v
D are documented in
Fig. 1. Although the measurement registration is in the local clock time without the
summertime shift it is evident that the courses follow the solar altitude changes, i.e. the
sin
s
tendency of the extraterrestrial horizontal illuminance after eq. (14). Therefore the
efficiency parameters
/
vv
GE and /
vv
PE should be rather stable and showing a large
amount of the extraterrestrially available luminous flux reaching the ground level,
therefore these parameters can markedly characterise situation 1 (Fig. 2). The momentary
1-minute measurements except some slight spreads on the April day show a steady rise
with the solar altitude which is even better followed by the hourly averages in Fig. 3 with
the stepwise rise of
/
vv
GE
from 0.45 to 0.75. In consequence, also the luminous turbidity
factors
v
T follow the stable atmospheric conditions without abrupt changes, except when
the sun position is shaded by crossing cloud patches and then can reach higher short time
peaks as in Fig. 4 on 8
th
April 2006. However, due to gradual evaporation during morning
the turbidity might fluently rise with the formation of Cirrus or Cirrostartus veiling
cloudiness as is shown by the trend of rising hourly average
v
T values in a small range
1.5 to 3 in Fig. 5. Such rising
v
T
effects can be expected especially in equatorial regions
with sometimes gradual cloud formation at noontime and in afternoon hours, which no
longer belong to situation 1.