Sustainable Growth and Applications in Renewable Energy Sources Part 2 pptx
Bạn đang xem bản rút gọn của tài liệu. Xem và tải ngay bản đầy đủ của tài liệu tại đây (467.37 KB, 20 trang )
EU Energy Policies and Sustainable Growth
11
The 20-20-20 Package, introduced in 2008 through the Communication (COM(2008)30),
answers to the call made by the European Parliament about real measures for the transition
toward a sustainable development. The Package includes a number of important policy
proposals closely interlinked:
a revised directive on the EU Emission Trading System (EU ETS);
a proposal on the allocation of efforts by member states in order to reduce GHG
emissions in sectors not covered by the EU ETS (as transport, building, services, small
industrial plants, agriculture and food sectors);
a directive on the promotion of renewable energy to achieve the goals of GHG emission
reductions.
The EU ETS scheme has been a pioneering instrument prior to the 20-20-20 Climate and Energy
Package. It is a market instrument that has been already implanted in the US quite successfully,
and it has been introduced in Europe in 2003 in order to find market solutions to encourage
firms cutting GHG emissions. The Cap and Trade system sets a maximum amount of emissions
per period (2005-07 and 2008-12) per country. Then, each country establishes a national
emission scheme and it allocates to firms the emission allowances which could be traded
between the companies covered by the scheme. Once the emission permits are allocated, firms
can trade them within the EU according to their criteria of economic efficiency. In the first and
second ETS trading periods (2005-2012), mostly of the EU permits are allocated for free.
The importance of the EU ETS scheme is that is has been able to create a market and an
artificial price for a public good as clean air. Thus, firms covered by the EU ETS have to face
costs when emitting CO
2
emissions: on the one hand, a firm that needs for its activity more
permits than those at its disposal faces the cost of purchasing them. On the other hand,
opportunity costs arise because permits could be sold in case of non-production. The 20-20-
20 Climate and Energy Package has modified the Emission Trading Scheme through the
Directive 2009/29/EC and it will enter into force from 2013 to 2020, in order to overcome
the application problems that rose during the first few years of its application. The first
problem is related to the EU allocation mechanisms that have been used so far. Emission
permits have been allocated for free, the allocation could be done on the basis of historic
emissions, that is grandfathering. This mechanism may create vicious circle since it does not
spur adoption of new technologies with a low environmental impact. Moreover, it favors
large firms that at the first stage receive many permits to preserve their activity level over
the small firms.
Another problem is related to the inconsistencies between the emission permits and the
National Allocation Plan: governments have created too many emission permits to protect the
welfare of the firms operating in the country who wanted to receive as more permits as
possible.
Finally, the large and persistent fluctuations of market price have created havoc in the
market and uncertainty on the goodness of the environmental policy.
In this direction, a research carried out by Hesmondhalgh et al. (2009) shows how different
factors may influence CO2 prices, as it is shown in the following table 7.
The main elements of the reformed Emission trading Scheme are:
a new emission cap set at 20% below with respect to the 2005 levels by 2020;
the use of credits from the Clean Development Mechanisms and Joint Implementation
is limited to 50% of the overall EU emission reductions in the period 2008-2020;
inclusion of new sector as aviation and aluminium sector;
Sustainable Growth and Applications in Renewable Energy Sources
12
Factor Effect on CO
2
prices
Higher than expected economic growth
Upward - increased demand for
allowances
Coal prices fall relative to gas prices
Upward - increased demand for
allowances
International agreement on abatement post-2012
Upward — EU will tighten cap on
emissions
Failure to meet renewables and/or energy
efficiency targets
Upward — increased demand for
allowances
Overall fuel prices
Uncertain— lower prices may increase
energy demand but will mitigate
effect of fuel price differentials and
vice versa for higher prices
Economic downturn
Downward— reduced demand for
allowances
Coal prices rise relative to gas prices
Downward— reduced demand for
allowances
Table 7. Potential influences on CO
2
prices. Source: Hesmondhalgh et al., (2009)
firms operating in the electricity sector are obliged to acquire 88% of emissions allocated
to each installation through the auction mechanism; 10% of permits is redistributed
from countries with higher per capita income to the one with lower per capita income
and the remaining 2% is given to member States that successfully reached the 20% GHG
reduction target in 2005 (i.e. the East European Countries).
The adoption of the auction mechanism in the EU ETS means a better distributional effect
compared to grandfathering, because government entries generated by auctioning may be
used both to reduce distortionary taxes and to promote research and development (R&D)
activities in clean technologies.
The Directive on renewable energies to reach the target of 20% on energy consumption by
2020 shares the burden between Member States. In particular, 50% of this effort has to be
shared equally between Member States, while the other 50% is modulated according to GDP
per capita. Moreover, the objectives are modified to take into account a proportion of the
efforts already made by Member States which have increased the share of renewable energy
fuels in recent years.
The promotion in the European Union of electricity production based on renewable energy
sources takes place in an energy market that is more and more competitive, since 1996 when
the Council of Ministers reached an agreement on the Directive specifying rules for
electricity liberalization in EU.
EU Energy Policies and Sustainable Growth
13
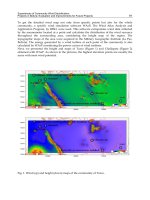
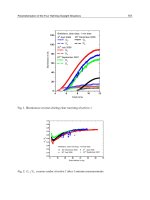
Fig. 4. Share of electricity from renewable energy sources in total electricity consumption
(%) – EU27 in 2007. Source: Eurostat (2009)
On the basis of the experience from electricity liberalization around the world, the goal of
the European Union is to achieve higher efficiency and lower consumption prices by
introducing conditions of intensified commercial competition, but it is quite hard for firms
that produce energy from renewable resources to compete within the energy industry that
produce energy mainly from fossil fuel.
Governments in EU countries use a large variety of instruments to stimulate the adoption of
renewable energies; there are different schemes implemented by the European Union in
order to use renewable energies and make them competitive on the energy market (Espey,
2001). The fundamental distinction that can be made among the European support
mechanisms is between direct and indirect policy instruments. Basically, direct instruments
stimulate the installation of energy from renewable resources immediately, while indirect
policy measures focus on improving long-term framework conditions. There exist also
voluntary approaches; this type of strategy is based on the consumers’ willingness to pay
premium rates for renewable energy, like donation projects and share-holder programs.
The important classification criteria are whether policy instruments are price-oriented or
quantity-oriented.
With the regulatory price-driven strategies, financial support is given by investment
subsidies, soft loans or tax credits. Economic support is also given as a fixed regulated feed-
in tariff (FIT) or a fixed premium that governments or utilities are legally obliged to pay for
renewable energy produced by eligible firms. Among the price-oriented policy, the most
used within the European members is the Feed-in Tariff. The Feed-in Tariff is a price-driven
incentive in which the supplier or grid operators are obliged to buy electricity produced
from renewable sources at a higher price compared to the price they pay for energy from
fossil fuel. The criticisms made to the feed-in tariff scheme underline that a system of fixed
price level is not compatible with a free market. Moreover, these favorable tariffs generally
do not decrease with the improvements of the efficiency of the technologies that produce
green energy (Fouquet and Johannson, 2008). A particular kind of feed-in tariff model used
in Spain consist in a fixed premium, in addition to the market price for electricity, given to
the producers relying on renewable energy sources. Also in this case, premiums should be
adjusted in accordance with the performance of different technologies.
Sustainable Growth and Applications in Renewable Energy Sources
14
With regard to the regulatory quantity-driven strategies, the desired level of energy
generated from renewable resources or market penetration is defined by governments. The
most important are tender system and tradable certificate system. In the tender system, calls
for tender for defined amounts of capacity are made at regular interval, and the contract is
given to the provider that offer the lowest price. The winners of tenders are getting a fixed
price per kWh for the period of the contract and the contract offers winner several favorable
investment conditions; this system is in a sense quite close to the feed-in tariff model. In the
tradable certificate system, firms that produce energy are obliged to supply or purchase a
certain percentage of electricity from renewable resources. Then, at the date of settlement,
they have to submit the required number of certificates to demonstrate compliance. The
firms involved in the tradable certificate system can obtain certificate from their own
renewable electricity generation; they may as well purchase renewable electricity and
associated certificates from another generator, or they can purchase certificates that have
been traded independently of the power itself.
Price-driven Quantity-driven
- Investment incentives
- Tax incentives
- Feed-in tariffs
-Rate-based incentives
- Shareholder programmes
- Contribution
programmes
Generation
based
- Green tariffs
Indirect
Voluntary
Investment
focussed
Voluntary agreements
Environmental taxes
Generation
based
Investment
focussed
Regulatory
Direct
Tendering system
Tendering system and
Quota obligation based
on TGCs
Table 8. Classification of promotion strategies. Source: Held et al., 2006.
The economic incentives for renewable resources differ among the EU members. In Germany,
the main electricity support scheme is represented by a price-driven incentive, the feed-in
tariff. The main features of the German support mechanism are stated in the Renewable
Energy Source Act of 2000. The Act establishes that the feed-in tariffs are not dependent on the
market price of energy but are defined in the law and that feed-in tariffs are different for wind,
biomass, photovoltaic etc. Moreover, the feed-in tariffs are decreased over the years in order to
take into account the technological learning curves (Petrakis et al., 1997).
The United Kingdom was the first European country to pursue liberalization in the
electricity market by the end of 1998. In UK, energy from renewable resources is supported
by quantitative-driven strategies. Over the last decades, the scheme adopted by UK was the
tender system, but, since 1999, the system in use is a quota obligation system with Tradable
Green Certificates. The obligation (based in tradable green certificate) target increases
during years, and electricity companies that do not comply with the obligation have to pay-
out penalties.
EU Energy Policies and Sustainable Growth
15
In Denmark the support schemes are mainly related to the wind power sector. To
implement renewable resources, the strategy adopted is price-driven, that is a premium
feed-in tariff for on-shore wind, and fixed feed-in tariffs for the other renewable resources.
In France, the strategy adopted is mainly price-oriented; the electricity support schemes are
feed-in tariffs plus tenders for large projects.
Italy has not a significant experience in producing energy from renewable resources with
the exception of large hydro. Several factors obstruct the development of renewables in
Italy, as administrative constraints and high connection costs. During the 1990s, the energy
sector in Italy was entirely restructured in order to introduce competition, as set by the EU
Directive 96/02/EC (Lorenzoni, 2003). The promotion of electricity produced from
renewables has taken place through support schemes as the quota obligation system and
feed-in tariff. Concerning wind energy, in 2002 the Italian government abandoned the feed-
in-tariff, introducing the quota obligation system with tradable green certificates. Under this
certificate system, electricity producers and importers are obliged to source an increasing
proportion of their energy from renewable resources. Green certificates are used to fulfill
this obligation. Italy has adopted a ministerial measure that balances supply and demand in
order to tame speculative fluctuations on the value of green certificates.
The recent literature argues that EU ETS mechanism and the promotion of renewable
energies may lead to different results (Carraro et al., 2006). While the EU ETS could be
interpreted in the light of the “polluter pays principle”, which requires the cost of pollution
to be borne by those who cause it, the implementation of renewable energies aims at
eliminating GHG emissions (Borghesi, 2010). Keeping constant the supply of emission
permits, the implementation of renewables may lead to a decrease in emission permits’
demand and thus their price without generating a significant GHG emissions reduction.
Assuming that to be true, the two instruments should be substitutes instead of
complements, unless government reduce the supply of permits on the long run.
Government involvement is essential to spur use of renewable energies. The EU energy
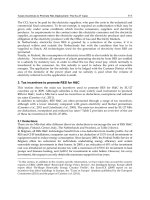
consumption is still heavily based on fossil fuels, as it is shown in figure 5.
Fig. 5. Final energy consumption by fuel in 2007. Source: Eurostat, 2009
Sustainable Growth and Applications in Renewable Energy Sources
16
The main advantage of renewable sources with respect to fossil fuels is that they contribute
to mitigate climate change. The liberalization of the electricity market may appear as a
partial response to climate change since it allows consumers to purchase cleaner electricity
directly from suppliers. Anyway, most consumers are not willing to pay higher prices for
green electricity since they are burdened with higher prices to preserve a public good (i.e.
clean air) which everyone benefits from. Consequently, the proportion of renewable sources
in the energy portfolio is low, unless there are governments subsidies (Carraro and
Siniscalco, 2003).
Actually, subsidies are needed because fossil fuel prices do not internalize environmental
damages to society. In fact, polluting emissions create a damage to society; without a price
system, firms face a suboptimal opportunity cost for pollution and this leads to a wrong
amount of pollution (Grimaud and Rougé, 2008). Since the right level of pollution will not
emerge in a spontaneous way, government must increase pollution cost by raising a tax, in
order to reduce pollution generation. If the tax is set at the optimal level, it is called a
Pigouvian tax. The optimal amount of pollution is the amount that minimizes total costs from
producing one more unit of pollution and total damages from pollution. Thus, the condition
that marginal cost (or marginal saving) equals to marginal damage leads to the generation of
the right amount of emissions. This is the main idea of the Pigouvian tax: “A Pigouvian fee is a
fee paid by the polluter per unit of pollution exactly equal to the aggregate marginal damage
caused by the pollution when evaluated at the efficient level of pollution. The fee is generally
paid to the government” (Kolstad, 2000). Note that the Pigouvian tax is also equal to the
marginal cost from pollution generation at the optimal level of pollution. The difficulty for the
government to levy a Pigouvian fee is that there are reasons why it is not feasible. First of all, it
is not easy to quantify marginal damage. The number of activities and the number of people
affected by pollution are so great that it is quite hard to came up with monetary estimation of
damage from pollution. Moreover, the optimal tax level on polluting emissions is not equal to
the marginal net damage that the polluting activity generates initially, but to the damage it
would cause if the level of the activity had been adjusted to its optimal level (Baumol and
Oates, 1971). If we are not at the optimum, the Pigouvian tax will be neither the marginal cost
of pollution nor the marginal damage from pollution.
Basically we can say that in a perfect environment, like an economy in which there is perfect
information and no constraints on government tax policy, the Pigouvian tax is only
necessary to achieve efficiency. If there are other distortions in the economy or limitation for
the social planner, then other taxes and subsidies are needed to achieve efficiency (Sandmo,
1976).
Incentive systems are needed to stimulate technical change so that renewable energies lower
future production costs. The reasons often put forward are the learning by doing effects
from the production of energy from renewable resources on the cost of future production.
The main idea is that a critical mass of production has to be reached first, and then costs will
be reduced thanks to research and development activities (Fundenberg and Tirole, 1983).
The reasons related to the implementation of renewable energy does not lie only in the
mitigation of climate change. There are also political reasons related to energy security issue.
Nowadays, energy security does not mean anymore protecting existing energy supplies.
The political instability of the Organization of the Petroleum Exporting Countries (OPEC)
countries has a strong impact on the global energy markets by leading to supply shortage in
importing countries, as the recent conflict in Libya has shown.
EU Energy Policies and Sustainable Growth
17
The implication of energy policy measures are thoughtful: economic efficiency and political
interests may conflict in climate change policies, especially when there are costs imposed in
the future (Helm, 2008).
3.2 Coordination between the EU member states
Within the bounds of the 20-20-20 Climate and Energy Package, each Member State should
work to support competition in energy markets and harmonize shared rules at European
level. From the Package it is clear that Member States could take different mechanisms to
reduce GHG emissions and implement renewable energies in the portfolio energy mix. Most
countries have chosen the feed-in tariff scheme, while the minority has implemented green
certificates. Assessment that results both on the effectiveness and costs of different
mechanisms are quite controversial (Dinica, 2006). The availability and quality of renewable
energies differ among countries: two countries may offer the same support scheme but they
face heterogeneous quality of the energy resource. It translates in different production costs
incurred by renewable energies that lead to misleading evaluations of the support
instruments. Moreover, support mechanisms are implemented in different economic context
which can then bring dissimilar results.
During the last three years the estimated costs to reach the 20/20/20 target have been
reduced: in 2007, before the economic and financial crisis started, costs to reach the Climate
and Energy Package goals were estimated at around 70 billion euro; nowadays, by taking
into account the economic recession, costs come to 48 billion euro (i.e. 0.32% of EU GDP in
2020). The lower costs are due to several factors, including the reduction of world energy
consumption due to economic and financial crisis and the rising in oil prices.
In the future, forecast costs of climate change will probably change upward according to the
economic recovery, which should also serve as a stimulus to the global energy investment,
essential to develop technologies with low environmental impact and increase energy
efficiency.
The implementation of less high carbon technologies, such as wind and solar energies
furthers the time horizon of the target to 2020. The costs related to the 20-20-20 Climate and
Energy Package have to be mainly supported by customers and taxpayers, and such costs
are higher if not all Member States make comparable efforts (Böhringer et al. 2009). There
exists the incentive to free-ride by EU regions, or to impose as few costs as possible on their
home economy while enjoying the benefits created at the other countries’ cost, as
demonstrated by a fair chunk of literature (Helm, 2008; Kemfert, 2003; Haas et al., 2004).
An interesting research made by Nordhaus (2009) analyzes the impact of non participation
on the costs of slowing global warming. The Kyoto Protocol assigns different commitments
to developed countries and developing countries. The 20-20-20 Climate and Energy Package
involves coordination among all Member States; the implication for policy makers if not all
countries participate to the Package are profound in term of costs. Nordhaus assesses the
economic impact that arise when some countries do not participate in the agreement to
mitigate climate change through a functional form for the cost function that allows to
estimate the costs of nonparticipation.
It is quite straightforward that limiting participation produce inefficiencies by rising the
costs for the participating countries. His research allows to calculate the cost penalty from
nonparticipation (that is equal to the inverse of the square of the participation rate).
Intuitively, if many countries do not participate in a treaty, the cost penalty is high, because
Sustainable Growth and Applications in Renewable Energy Sources
18
the emission reduction target hardly could be achieved. As Nordhaus says: “ there are low-
hanging fruits all around the world, but a regimen that limits participation to the high-
income countries passes up the low-hanging fruit in the developing world”.
We think that European Member States must then take coordinated actions to reach the 20-
20-20 goals by implementing national policies at national level.
4. Conclusion
The European Union (EU) has undoubtedly made a big effort in developing a progressive
environmental policy, but many of its own policies are still far from making a difference to
climate change. The policy into action to “green” Europe is the so-called 20-20-20 climate
and energy package. The 20-20-20 Package, introduced in 2008 through the Communication
(COM(2008)30), answers to the call made by the European Parliament about real measures
for the transition toward a sustainable development. The Package includes a number of
important policy proposals closely interlinked, that are: a revised directive on the EU
Emission Trading System (EU ETS); a proposal on the allocation of efforts by member states
in order to reduce GHG emissions in sectors not covered by the EU ETS (as transport,
building, services, small industrial plants, agriculture and food sectors); a directive on the
promotion of renewable energy to achieve the goals of GHG emission reductions.
So far, a large strand of literature on climate change states that we need several economic
policy instruments to correct for existing types of market failures, for instance, an
environmental tax on the carbon emissions and a research subsidy for research and
development (R&D) spillovers in the renewable energy sector (Cremer and Gahvari, 2002).
Policy instruments implemented to these aims are generally classified as price-oriented or
quantity-oriented. Some of them are claimed to be more market friendly than others, while
other schemes are claimed to be more efficient in promoting the development of renewable
energy (Meyer, 2003). Currently, there is no general agreement on the effectiveness of each
scheme. Evidently, every region would want to spur new activities, new investment, more
employment in its own territory, by using an appropriate mix of local taxation and
subsidies, in conjunction with other command and control instruments. However, EU
regions have the incentive to free-ride, or to impose as few costs as possible on their home
economy while enjoying the benefits created at the other countries’ cost. So, there are
formidable problems of opportunistic behavior and inefficient outcomes.
To conclude, the 20-20-20 Climate and Energy Package requires simultaneous and
coordinated action. Both politically and institutionally the EU Member States are quite
heterogeneous. Unless cooperation is sustained by institutions which can punish free-riding,
every region will earn even higher profits by free-riding on the virtuous behavior of the
remaining cooperators.
5. References
Awerbach S., 2003. Does renewables cost more? Shifting the grounds of debate. Presentation
at the Sonderborg on Renewable Energy – Renewable Energy in the market: New
Opportunities, Sondenborg, Denmark, September 2003
Barrett S., 1994. Self-Enforcing International Environmental Agreements. Oxford Economic
Papers, Special Issue on Environmental Economics, Vol.46, pp.878-894
EU Energy Policies and Sustainable Growth
19
Baumol William J., Oates Wallace E., 1971. The Use of Standard and Prices for Protection of
the Environment, The Swedish Journal of Economics, Vol.73, No.1, pp. 42-54
Borghesi S., 2010. The European Emission Trading Scheme and Renewable Energy Policies:
Credible Targets for Incredible Results?, Fondazione Eni Enrico Mattei, Working
Papers. Working paper 529
Böhringer C., 2009. Strategic partitioning of emission allowances under the EU Emission
Trading Scheme. Resource and energy economics, Vol.31, No.3. pp. 182-197
Böhringer C., Löschel A., Moslener U., Rutherford T., 2009. EU climate policy up to 2020: An
economic impact assessment. Energy Economics, Vol.31, Supplement 2, pp.295-305
Böhringer C., Vogt C., 2004. The Dismantling of a Breakthrough: the Kyoto Protocol – Just
Symbolic Policy. European Journal of Political Economy, Vol.20, No.3, pp.597-617
Carraro C., Eychmans J., Finus M., 2006. Optimal transfers and participation decisions in
international environmental agreements. The Review of International Organization,
Vol.1, No. 4, pp.379-396
Carraro C., Siniscalco D., 1993. Strategies for the International Protection of the
Environment. Journal of Public Economics, Vol.52, No. 3, pp.309-321
Cremew H., Gahvari F., 2002. Imperfect Observability of Emissions and Second-best
Emission and Output Taxes, Journal of Public Economics, Vol. 85, No. 3, pp. 385-407.
Dinica V., 2006. Support systems for the diffusion of renewable energy technologies – an
investor perspective. Energy Policy, Vol.34, No. 4, pp.461-480
Espey S., 2001. Renewables portfolio standard: a means for trade with electricity from
renewable energy sources?, Energy Policy, Vol. 29, No. 7, pp. 557-566
Eurostat – European Commission, 2009. Europe in figure. Eurostat yearbook 2009. Eurostat
Statistical Books, Luxembourg.
Fouquete D., Johannson T., 2008. European renewable energy policy at crossroads—Focus
on electricity support mechanisms. Energy Policy, Vol.36, No.11, pp. 4079-4092
Fundenberg D., Tirole J., 1983. Learning-by-Doing and Market Performance, The Bell Journal
of Economics, Vol 14, No. 2, pp. 522-530.
Grimaud A., Rougé L., 2008. Environment, directed technical change and economic policy.
Environmental and Resource Economics, Vol.41, No.4, pp. 439-463.
Haas, R.; Eichhammer, W.; Huber, C.; Langniss, O.; Lorenzoni, A.; Madlener, R.; Menanteau,
P.; Morthorst, P E.; Martins, A.; Oniszk, A., 2004. How to promote renewable energy
systems successfully and effectively. Energy Policy, Vol.32, No.6, pp.833-839
Held A., Haas R., Ragwitz M., 2006. On the success of policy strategies for the promotion of
electricity from renewable energy sources in the EU. Energy & Environment, Vol. 17,
No. 6, pp. 849-868
Helm D., 2008. Climate-change policy: why has so little been achieved? Oxford Review of
Economic Policy, Vol.24, No.2, pp.221-238
Hesmondhalgh S., Browun T., Robinson D., 2009. EU Climate and Energy Policy to 2030 and
the Implications for Carbon Capture and Storage. The Battle Group, 2009
Hepburn C., Grubb M., Neuhoff K., Matthes F., Tse M., 2006. Auctioning of EU ETS phase II
allowances: how and why?
Climate Policy, Vol.6, No. 1, pp.137-160
Kawase R., Matsuoka Y., Fujino J., 2006. Decomposition analysis of CO
2
emission in long-
term climate stabilization scenarios. Energy Policy, Vol.35, No.15, pp.2113-2122
Kemfert C., 2004. Climate coalitions and international trade: assessment of cooperation
incentives by issue linkage. Energy Policy, Vol.32, No.4, pp.455-465
Sustainable Growth and Applications in Renewable Energy Sources
20
Kolstad Charles D., 2000. Environmental Economics, Oxford University Press, ISBN -19-
511954-1, Oxford.
IEA, 2010. CO2 emissions from fossil fuel combustion - Highlights. International Energy
Agency, Paris, 2010 edition
Lorenzini A., 2003. The Italian Green Certificates market between uncertainty and
opportunities, Energy Policy, Vol.31, No. 1, pp. 33-42.
Morthorst P.E. (2008). Wind Energy – the Facts. The Economics of Wind Power, World Wind
Energy Association, Technical University of Denmark
Nakicenovic N., Kolp P., Riahi K., Kainuma M., Hanaoka T., 2006. Assessment of emissions
scenario revisited. Environmental Economics and Policy Studies, Vol. 7, No. 3, pp. 137-
173
Nordhaus W.D., 2006. After Kyoto: Alternative Mechanisms to Control Global Warming.
The American Economic Review, Vol.96, No.2, pp.31-34
Nordhaus W.D., 2009. The impact of Treaty nonparticipation on the Costs of Slowing Global
Warming. The Energy Journal, Vol.30, No.2, pp.39-52
Petrakis Emmanuel, Rasmusen Eric, Roy Santanu, 1997. The Learning Curve in a
Competitive Industry, The RAND Journal of Economics, Vol.28, No.2, pp. 248-268.
Sandmo A., 1976. Optimal taxation: An introduction to the literature, Journal of Public
Economics, Vol. 6, No. 1-2, pp. 37-54
Stern N., 2007. The Economics of Climate Change: The Stern Review. Cambridge University
Press, Cambridge, UK
2
Sustained Renewability: Approached by
Systems Theory and Human Ecology
Tobias A. Knoch
1,2
1
Biophysical Genomics, Dept. Cell Biology & Genetics, Erasmus MC, Rotterdam,
2
BioQuant & German Cancer Research Centre (DKFZ), Heidelberg
1
The Netherlands,
2
Germany
1. Introduction
With the growth of the world population and the ever-new technologies emerging from
R&D – both creating ever higher needs and expectations – also the energy amount to be
acquired, stored, transformed, and finally used is exponentially growing and thus
believed to be always at the limit. Actually this capability to use energy, has since the
origin of our universe been the central drive of nature: first in its physical evolution, then
in the evolution of biological life and finally in the emergence of human societies and
cultures. In our modern industrialized life from primary food to industrial good
production, via transport and information processing, to every form of cultural activity,
everything is depending on this agent allowing the change of the physical state of matter
or organisms. This is underlined by the fact that mass and energy are two sides of the
same medal as shown by E=mc
2
(Einstein, 1905) and always conserved (Noether, 1918a,
1918b). Without energy no work, no process, no change, and no time would exist and
consequently the thirst for energy, surpasses the currently accessible resources by far.
Interestingly, there is only one other basic resource, which might be equally important as
matter and energy: information – the way of how energy is used for change. Also the
information amount to be stored and processed is growing exponentially and believed to
be always at the limit. Without doubt information technologies have become the key to
success in nearly all sectors of modern live: R&D is meanwhile mostly based on the
storage and analysis of huge data amounts. In health care, diagnosis and treatment rely on
imaging facilities, their sophisticated analysis and treatment planning. In logistics, the
shipment of goods, water, electricity and fuels is driven by distribution management
systems. The financial and insurance sectors are unthinkable without modelling. Finally,
the IT sector itself is inevitably carried by the creation and manipulation of data streams.
Thus, also here the demands outweigh the useable resources and especially the public
sector struggles to increase their capabilities.
Limits showing e.g. syntropic/entropic materialistic, energetic or other barriers as those of the
energy or IT sectors, are well known (Egger, 1975; Faber & Manstetten, 2003). They have
constrained first nature and later life since their beginnings and are one of the evolutionary
drivers by the “survival of the fittest”. Exponential demand growth until reaching a limit seems
Sustainable Growth and Applications in Renewable Energy Sources
22
to be an inherent property of life and evolution in general (Faber, 1987). The other side of
demand growth – waste and pollution – complies with this, although it is not using a resource
but destroying the purity of another one. Obviously, this sustainability challenge beyond the
materialistic regime can be found on all evolutionary levels up to the psychological, societal,
and cultural level. All these levels act as a possible cause for exponential growth. Especially, the
abilities of man in his modern societies have accelerated the use of common resources
tremendously reaching the planetary carrying capacity (IPCC). Climate change and the
sustainability challenge, thus is a complex combination of various effects, which in their holistic
consequences have reached an unsustainable level threatening survival. The (Classic) Tragedy of
the Commons (Hardin, 1968, 1994, 1998; Ostrom, 1990; Commons) describes this dilemma, in
which (multiple) independently acting individuals due to their own self-interest can ultimately
destroy a shared limited resource despite it is clear that it is not in the long-term interest of the
local community or for the whole society. On universal time scales syntropy/entropy laws
obviously predict that mankind will reach fundamental limits. Nevertheless, on short time
scales huge resources are available: Already the sun delivers ~3.9 10
6
Exajoules to earth per
year, i.e. ~10,000 times the current human energy consumption (~5.0 10
2
Exajoules/a). The
natural geogene radioactive decay is also considerable and has kept the earth core molten now
for 4.5 billion years. Both the energy inflow and outflow is balanced. Thus, with the little usage
efficiency of our human societies of ~10% the current renewable energy capacity surpasses the
human consumption still ~1 million fold! Not only are those resources renewable on a human
scale but also free of primary resource costs. Thus, more efficient usage of renewables here is
undoubtedly the key to the further success of our societies.
Again there are striking similarities to the IT sector: Due to the pervasiveness of PCs, their
number has grown beyond 1.5 billion, outweighing the capacity of computing centres >100
times. Since the capacity is peak performance oriented, less than 5% are used, i.e. >95% of
the capacity would be available 99% of the time. In a generic IT sense the term, a resource is
any capability that may be shared and exploited by a network – normally termed “grid”.
These resources have been already paid for including their external follow-up costs
(environmental etc.). The same holds to less extent for cluster infrastructures due to
virtualization strategies. The Erasmus Computing Grid (de Zeeuw et al., 2007) with ~20,000
PCs (~50,000 cores, ~50 Teraflops), corresponds to a ~30 M€ investment. Especially in the
notoriously under-funded public domain more efficient resource usage by means of grid
would satisfy a big demand challenge. Thus, both in the energy, IT, as in any resource sector
more efficient usage is of major importance for advancements. Thus, at least locally the
disaster of reaching the (physical) limit can be delayed largely. A prime example from the
production of fundamental raw materials is e.g. the integrated production in the chemical
industry (Faber et al., 1987): Here byproduct usage, i.e. the waste of one process, is reused in
another one as basic resource or often even as main process component (Jentzsch, 1995).
Integrated production can reach the level of an extremely fine-tuned ecological organism (as
in the highly sophisticated chlorine chemistry) that little changes have severe “survival”
consequences for the whole system (Egger & Rudolph, 1992; Faber & Schiller, 2006). In real
biological systems, however, there is more flexibility as in the highly integrated and
sophisticated agro-forestry systems e.g. in Indonesia, which have been developed over
centuries reaching extremely high efficiencies and are one of the biggest cultural
achievements ever. In both cases the efficiency, i.e. the relation between system input and
output, are maximized and beat every other process or management (Faber et al., 1998).
Sustained Renewability: Approached by Systems Theory and Human Ecology
23
Here, the internalization challenge of underused energy resources in general and
especially of the vastly underused renewable energies is analysed by the new concept of
Sustained Renewability combining systems theory with Human Ecology and describing
adequately the integrated holistic ecology like system parameters and strategies
necessary. Therefore, fossil, renewable energy as well as grid and cloud IT resources
(Foster & Kesselmann, 2004), their exploitation networks and organizational exploitation
structures are analysed generically in relation to their technical systemic challenge. To
approach the internalization challenge of underused renewable resources, the novel
generic notion of the Inverse Tragedy of the Commons, i.e. that resources are underused in
contrast to their overexploitation, is introduced. It is combined with the challenges on the
micro level of the individual with its security/risk/profit psychology (Egger, 2008) as
well as on the macro level of autopoietic social subsystems (Egger, 1996; Luhmann, 2004,
2008; Maturana & Varela, 1992). To derive points of action, the classical Human Ecology
framework (Bruckmeier & Serbser, 2008; Egger, 1996) will be extended to describe the
interactions between invironment-individual-society-environment completely and then is
combined with the systemic complexity challenge. This leads inevitably to the new
concept of Sustained Renewability and defined point of actions. Thus, sustained systemic
renewability of resources in general can be really reached and thus leaves at least on the
human scale much room for advancement for a big part of our future.
2. Fossil and renewable energy resources and their means of exploitation
Energy is always bound to and thus stored in a state of matter and has to be extracted
thereof and transformed into the corresponding form for a certain usage. Primarily the
energy we have access to comes either from nuclear fusion as in our sun (heating and
driving the atmosphere), from nuclear decay within earth (keeping a molten core,
volcanism, plate tectonics), and from the gravitational fields of our planetary system (tidal
changes). This primary access is far from endless or renewable: e.g. hydrogen fusion has
been done 2/3 already, i.e. only ~2 billion years are left for hydrogen fusion and thus
already in ~300 million years the earth atmosphere will start to be heated up so much that
life as one knows cannot exist anymore. Radioactive decay and the gravitational energy are
also slowly used up. Consequently, the term renewable in that sense is only a relative
terminology in respect to human time scales: Considering sun energy present for another
100 million years means ~30 million human generations or ~30 times the evolutionary
development to homo sapiens. Nevertheless, on a human scale the term renewable thus
really makes sense. In contrast, fossil energy resources (despite geogene gas and
radioactives) consist mainly of organic substances produced through biogene conversion of
sun energy by photosynthesis and their further transformation by geological process to coal,
gas and oil. I.e. they are in principle a tertiary energy resource already. Due to the slow
geogene processes and geological exploitation degree, the accessible size of these resources
is fairly limited and especially concerning the human energy consumption very limited
compared to the size of primary energy resources, their lasting and also not changeable
natural production. Also the forms of energy which are termed renewables are in that sense
secondary resources: i) sun energy is stored in photons, i.e. light, ii) wind energy is due to
the sun energy transformed to heat creating atmospheric pressure imbalances, iii) hydro
energy is due to water evaporation and gravitational lifting to higher altitudes and rain, iv)
tidal energy is based on the earth-moon gravitational energy and stored in ocean movement,
Sustainable Growth and Applications in Renewable Energy Sources
24
v) geothermal energy is heat from radioactive decay stored in the geosphere itself, and vi)
biomass is sun energy transformed by photosynthesis into biological matter as e.g. wood.
2.1 Renewable energy resources and their distributed exploitation
Renewable energy resources are due to their primary and secondary origins in principle
homogenously distributed in an extensive and variant mixture compared to the very
localized fossil resources: i) sun energy depends mostly on the geographic altitude, ii) wind
energy is strong at coasts, great plains or mountains, iii) hydro electric energy needs rain,
mountains, or rivers, iv) tidal energy needs tidal differences, v) geothermal energy is best at
geological active sites, and vi) biomass counts on a vivid agro- and forestry capability, i.e.
thus fertile soils and water. Actually in biological terms the presence of ample energy
resources at each location, which are available in principle everywhere and in principle
exploitable similarly, are the deeper basis for the thriving of life, i.e. the success of evolution
(neglecting now extreme life forms). Three different exploitation means of these renewables
can be distinguished e.g. in electricity production: i) direct conversion of e.g. sun energy by
photovoltaics or heat by thermotaics, ii) conversion of kinetic energy via a generator as for
hydro, tidal, or wind power, and iii) chemical conversion into heat as for biomass or directly
for geothermal power, then into kinetic energy before electricity generation. Consequently,
to reach the highest exploitation and conversion efficiency it is obvious to use the local
resource mixture according to the usage profile, and only transport the overproduction to
where it currently might be needed or stored for local demand rich times, i.e. to secure
supply for the peak demand. Thus, here also the most systemic integration, that means the
best adaption to the local usage scenarios can be reached, since the conversion plants, i.e.
photovoltaic modules, wind turbines, small hydroelectric plants etc. are relatively small in
size and can be aggregated in the most modular and thus sensible way. Also the exploiters
and/or producers are either the same as the users or at least very near to them, thus
ownership and participation in the exploitation-transformation-usage cycle can be maximal.
2.2 Fossil energy resources and their central exploitation
In contrast, the fossil resources are highly localized due to their origin: coal, gas, oil and
uranium deposits are regional and need with their decline increased exploitation efforts.
Despite being a local resource in a globalized world they are transported to the power
plants. Thus, local economic thriving depends on an efficient transport system. Fossil energy
conversion is based on chemical (in the case of nuclear decay, physical) transformation into
heat, which is then transformed into kinetic energy driving turbines connected to generators
for electric energy. Whereas renewable conversion is high-tech, the latter is still based on the
steam engine and the electric generator. The best efficiencies are reached for big plants or a
systemic combination of electricity and heat. Thus, due to the size the transformed energy
transport itself becomes a major challenge and cost factor due to the large losses involved.
From evolutionary optimized biological systems it is known that their scaling and success is
based on: i) the distribution system is fractal, ii) the transport loss is minimized, and iii) the
smallest part of the transport system has the same minimum size. Unfortunately, for the
modern distribution networks this is mostly due to redundancy issues not the case anymore.
Due to the plant size and the transport issues, the investments are high and only doable by
international private companies, with relatively low integration with the local usage
structures or participation of the local users. Thus, the production and usage can hardly be
Sustained Renewability: Approached by Systems Theory and Human Ecology
25
integrated in a systemic manner anymore with high efficiency. Beyond, fossil resources have
one big drawback: they produce waste, i.e. CO
2
is the leftover, whereas renewables only
convert the energy form but not a resource additionally to the energy form. Thus, in a
limited world this unavoidable leads to pollution and thus e.g. climate challenge.
3. Generic organization of the fossil and renewable energy sectors
As described briefly before, there are huge renewable energy resources available, which are
based on the earth own geological nuclear decay, the suns nuclear fusion energy reaching us
as light, and planetary gravitation. Simultaneously, there is a great shortage of exploitable
resources as constantly claimed by users and providers – similar to the IT sector.
Consequently, this paradoxical situation must have a reason, despite even the relative slow
turnover rates of technical solutions in the energy sector, which are ~30-50 years for a
production facility and perhaps the double for a complete new technology generation,
compared to the 3-5 year fast turnover rates for a full technology replacement cycle in the IT
sector. Thus, comparing the production solutions and organization of fossil and renewable
energy resources is important. Both are based on dedicated organizations which handle the
technical as well as management challenges and posses the same fundamental organization
principles similar to the IT sector: i) ownership and control, ii) size of plant, iii) diversity and
distribution, iv) technological broadness, and v) spatial distribution. To understand further
the challenges, which still exist despite the crucial longing for energy and IT, the main three
different electricity production approaches in Germany are analysed:
The renewable energy sector has grown tremendously in Germany in the last 10-15 years
mainly by guarantying a fixed price for the produced energy allowing return of investment of
~6% per year over 20 years: Today ~25,000 wind turbines with ~30 GW peak performance and
~800,000 photovoltaic plants with ~18 GW peak performance of electricity deliver ~7% and
~3.5% of the German electricity consumption. Together with biogas and biofuel production,
combined heat and electricity production (KWK) and hydroelectric plants from lakes and rivers
– each from some kW to some MW peak capacity – in total ~17% of the German electricity are
now renewable and emission free. Whereas wind mills have a peak performance of 300 kW to
7.5 MW and are usually aggregated in parks of up to 50-100 mills, photovoltaic plants range
from 1-2 kW to ~30-50 MW peak performance. Wind parks naturally reside in wind rich regions
but are meanwhile spreading to the southern continental regions. Photovoltaic plants are
installed throughout the country on the roofs of private households, government, or industry
buildings. Bigger ones are also placed on farmland and conversion zones e.g. unused industrial
estates. Investment costs range from some thousand Euros for a photovoltaic plant on a family
home, some million for a medium sized windmill, to some hundred million for a big
photovoltaic plant or wind park. Consequently, the production plants fit different business
models and investor groups from the individual up to institutionalized funds. The electricity is
mainly introduced into the grid and has priority by law over conventional electricity
production. The electricity grid providers measure the production and the producers are
monthly refunded by the local grid or electricity company. The grid belonged to the four big
German electricity companies ENBW, EON, RWE, and Vattenfall until recently, but is now in
other private hands. The free energy flow to the consumer – so called grid-neutrality – is
guarantied by law. The price guaranty to the producer is shared by an addition to the bill of all
electricity consumers in a social manner and often also sold as special green electricity product –
then by green energy sellers. Besides the knowledge gain in Germany and being the world
Sustainable Growth and Applications in Renewable Energy Sources
26
leader in renewable energy facility production with ~350,000 employed people meanwhile, the
resource, i.e. sun or wind, has not to be paid for, which leads to a big economic advantage. Due
to the range of business models in principle everybody can be an electricity producer, which
means a democratization of electricity or renewable energy production within society.
The public city producers, which often have been owned by the cities or regions especially in
the past have a very conventional portfolio consisting of coal or gas power plants, which are
sized to serve the local or regional electricity and sometimes thermal, i.e. heating, energy needs.
Historically they developed when electricity and heat was starting to be needed by major parts
of society, i.e. between 1850 and 1950. The electricity is put into the electricity grid, which has
often belonged also to the public city producers. The distribution network for the heat, which is
a byproduct of the conventional electricity production, has also been build up by them, since
this was relatively easy to implement concerning the technical and organizational efforts for a
well thermally isolated pipeline system underground from production to consumers
throughout a city. Electricity, nevertheless, is mainly traded at the European Energy Exchange
and production depends on the national demand price, which depends again on the coal, oil,
and gas trading prices, i.e. depends on a European/worldwide market price and thus is a major
part of the production costs. The local city producers are also the major seller for their electricity.
Meanwhile, many of them possess also renewable energy production capabilities (photovoltaic
plants or wind parks, usually regional), besides the classic hydroelectric production facilities at
lakes and rivers, which again has regulatory reasons. Since they are connected to the regional
government and thus are controlled by the local inhabitants they are relatively much bound
into the regional development process as well and also impact the regional industry.
In contrast, the four large-scale producers of electricity in Germany – ENBW, EON, RWE,
and Vattenfall, who are often termed the big “German Four” – are meanwhile world wide
acting producers of mainly conventional coal, gas, oil, and also atomic electric power. Their
plants have investment costs of billions and their regional placement depends besides the
energy production process and consumption needs mostly on business and regulatory
reasons. Thermal energy is only in some cases used locally for heating since the amount
surpasses by far the local demand, thus the electricity, which is put to the electricity grid, is
often internationally transported through the network to the consumer. The network for a
long time mainly belonged also to them until recently, and had been bought from regional
city producers over the years, thus the “German Four” controlled production and transport
in a very monopolistic manner. Naturally, they also have to buy the energy resource and
thus depend critically on the resource price of energy resources, although due to their size
they are in the position to influence that by their large demand. In selling terms they are the
big sellers of electricity and due to their market position (and especially while being owners
of the distribution network) can influence the price to some extent to their gusto. That this is
not excessively abused, the German government has implemented a regulation agency
controlling their market and price models. Due to the unavoidable switch to renewables due
to the climate challenge they also invest meanwhile into very large photovoltaic plants,
wind parks especially offshore, and hydroelectrics – again based on their business model of
large-scale with a monotechnic approach. According to their financial power they act such
that their market position, i.e. their monopolistic centrality is hardly touchable and thus that
they can control the heart of the electricity sector in Germany. The dependencies this creates
and the risk for society is retrospectively also one reason for the huge success of renewables
with their decentral relative small-scale and thus democratic production.
Sustained Renewability: Approached by Systems Theory and Human Ecology
27
Seller/Broker Organization
Public-Private Organization
Users
Individual Producer
82 Million + Industry
National Consumers
~ 900 Sellers
e.g. ~800.000 PV Plants
i.e. Local PV Producers
National Distribution Grid
German Renewable PV/W/KWK
82 Million + Industry
National Consumers
~ 700 Public Sellers
~700-900 Producers
~1300 Plants
National Distribution Grid
German “Public” Producers
The German Four
Seller/Broker Organization
Public-Private Organization
Users
Central Providers
82 Million + Industry
National Consumers
The German Four
4 Producers
~100 Plants
National Distribution Grid
Public City Producers
Government/Public
Private Producers
Individual/Public
International Companies
Industrial/Private
Pluristic
Polytechnic
Local/Decentral
Monopolistic
Monotechnic
Central
Ballanced Mixtur e
Fig. 1. Abstraction and detailed structure of the German electricity sector, showing three
pillars and the four levels of infrastructures involved from production to usage. The three
pillars are characterized by: i) individual/public “private” producers, ii)
government/public city/regional producers, and the very few industrial privately owned
international companies. All share four levels of infrastructure from production to usage: i)
users, ii) seller organizations, iii) the semi-private, i.e. public-private network organizations,
and iv) individual producers. The three pillars are already characterized by their means of
energy production: i) renewable and small scale, ii) regional and medium sized, and iii)
classic large scale fossil and atomic. Whereas the first can be characterized by pluristic,
polytechnic local/decentral means, the last is characterized by monopolistic, monotechnic,
and central terms. Although, the details may vary, the structure leads to similar challenges
on the micro and macro level, which can be understood by the Human Ecology rectangle
Generalizing, the renewables obviously belong to the class of individual/public distributed
producers with a pluristic, polytechnic and local/decentral approach, whereas the “German
Four” large scale producers are clearly industrial/private with a monopolistic, monotechnic,
and central attitude. The German government/public city producers are a mixture of both:
government and public, not too pluristic, polytechnic, and local/decentral and neither
industrial/private, nor monopolistic, monotechnic, and central. Consequently, this shows
already the similar property and power structures in the energy and IT sectors. Especially
the “German Four” show the similarity to the newest development concerning IT resources,
i.e. clouds, with the same monopolistic structures etc. and blocking effects on development.
The analysis of these and other such many an infrastructure shows that four levels of
organization are involved also in energy producing and distributing organizations: i) users,
Sustainable Growth and Applications in Renewable Energy Sources
28
ii) organizing broker organizations, iii) provider organizations, and iv) individual providers.
In a more abstract form this shows that actually there are i) individuals and ii) societies of
individuals, which are both involved on each of the four levels of organization, with a
different degree of influence. Consequently, there is a micro level from which a macro level
emerges, having again an influence on the micro level, i.e. that both levels are connected in a
complex and cyclical manner as in any evolutionary evolving system. Thus, the micro level
is constituted by an invironment and the macro level creates an environment. This will later
constitute already the Human Ecology rectangle.
4. Generic organization of grid and cloud IT infrastructures
Obviously, there are also huge resources available in the IT sector – similar as in the
renewable energy sector, although there is – at the same time – a shortage of resources as
constantly claimed by users and providers. Consequently, this paradoxical situation must
have again a reason and especially for the IT sector where the opportunities for technical
solutions with fast turnover rates of 3-5 years for full technology replacement cycles are
large compared to the ~30-50 years in the energy sector. Grid and cloud infrastructures are
one solution to ease the resource shortage by more efficient usage of available resources and
are based on dedicated organizations, which handle the technical as well as management
challenges involved. They also posses the same fundamental organization principles and
can be classified by the same characterization as already the energy sector: i) ownership and
control, ii) size of grid/cloud, iii) diversity and distribution, iv) technological broadness, and
v) spatial distribution. Thus, it is very interesting to see that despite the much higher
turnover rates and the innovative potential of the IT sector in principle the same challenges
exist as in the energy sector. Therefore, now two grid and one cloud infrastructure will be
investigated in greater detail to show the similarities:
The Erasmus Computing Grid (ECG) is one of the largest desktop grids for the biomedical
research and care sectors worldwide (de Zeeuw et al., 2007; Fig. 2). The computing cycles of
the desktop computers of the Erasmus Medical Centre and the Hogeschool Rotterdam (the
local University for Applied Sciences) are donated to the ECG. Technically, these cycles are
exploited by the middleware CONDOR and a newly developed management system, which
administrates on the one side all the computers in the grid as well as the users and on the
other hand posses an easy accessible back-end/front-end system for usage. The latter is
especially important for efficient use and security: The users only need to deliver their
application, which then is implemented in a work flow scenario, thus the users for
production only need to upload via a portal their new data and parameters for the analysis.
The users are informed about status and final plausibility result checks. The rest is shielded
for security reasons. Currently, the ECG has a capacity of ~15 Tera FLOPS already available
for user applications (total existing capacity: ~20,000 desktop PCs, ~30,000 computing cores,
~50 Tera FLOPS). This corresponds to a ~30 M€ investment. In absolute terms this is also
one of the largest dedicated computer resources world wide available to users via a central
entry port managed by the Erasmus Computing Grid Office (ECGO). The ECGO is the
secretariat in front of the technical infrastructure, supporting users, technical maintainers of
the desktops, and serves as the development hub for grid as well as special user wishes. The
aim of the ECG is to serve the areas of research, education, and diagnostics according to the
mission of the donating public organizations. Beyond, the aim is to develop the ECG as a
general broker organization for computing resources also for industry and other sectors.
Sustained Renewability: Approached by Systems Theory and Human Ecology
29
Therefore, the ECG is also connected to other grid and cloud infrastructures and respective
European initiatives as e.g. the German MediGRID/D-Grid initiative, the European EGEE
and EDGES infrastructures and several other local resources.
MediGRID (Krefting, 2008; Sax, 2007, 2008) and its services branch Services@MediGRID
operate the national German biomedical research and care grid and is one of ~20
community grids of the German nation wide D-Grid initiative. The resources are cluster
computers, which are located and maintained at local universities. Their size varies from
~16 CPUs with 2 or 4 computing cores each (i.e. 32-64 cores) to 2048 CPUs with 4 cores
(i.e. 8192 cores). These resources run different middlewares and can be accessed by the
users via a central access portal or a central access to the resources directly (Fig. 2). Here
again the userfriendliness is of major importance to gain a broad group of especially non-
computing experts. Special security protocols allow data transfer between the clusters
under high-security medical conditions. Thus, the German MediGRID is said to be one of
the most advanced health grids in the world combining data storage, computing power
and sharing of applications in an entire nation. To serve the aims of research, education,
and diagnostics in the biomedical research and care sectors MediGRID is organized in
different modules, which are distributed via different institutions throughout Germany
and thus form a more or less decentral organization. Nevertheless, special services,
business modules and strategies were developed within the Services@MediGRID project
allowing the grouping into different service classes and thus to apply different business
and accounting models to distribute and organize appropriate the usage of the grid most
efficiently. This also includes the possibility for billing and thus in principle commercial
usage. Since MediGRID is located in the national research arena the latter is currently
mostly valuable for accounting within the research community to balance and monitor the
money flow within German research.
The Amazon EC2 cloud favours now an even more concentrated production facility since it
exists of a few data centres around the world with massive cluster computing capacity of
hundred thousands of computing cores at one centre. The centres are localized according to
environmental and business aspects, i.e. that cheap energy supply for cooling, operation,
and local subsidies are the main location factor despite a high capacity connection to the rest
of the internet. The administration is done centrally in each facility, with different operating
systems available and generic portals for user access. The centres are shielded entities and
guaranty maximum security despite the country and legal setting they are in. Due to the
size, users have access to a free scaling system, for which they are billed per computing hour
on different accounting and business models. Amazon also helps to develop together with
users their solution of interest, however, focuses mostly on providing pure hardware, the
operating system and the access to the resource.
Obviously, the ECG belongs to the class of individual/public desktop grids with a
pluristic, polytechnic and local/decentral approach, whereas the Amazon EC2 cloud is
clearly industrial/private with a monopolistic, monotechnic, and central attitude. The
German MediGRID and thus D-GRID is a mixture of both: government and public, not
too pluristic, polytechnic, and local/decentral and neither industrial/private, nor
monopolistic, monotechnic, and central. Consequently, this shows similar property and
power structures as in the energy sectors including the current phenomenon to set up
overcome giant monopolistic structures in the new cloud infrastructures, which are
blocking fast development towards new more efficient opportunities. Thus, generically
Sustainable Growth and Applications in Renewable Energy Sources
30
Organizing Broker Organization
Donor Organization
Users
Individual Donor
10 BioMedical
User Groups
ECG Centralized Office
~15.000 PC Owners
i.e. Local PC Owners
Two Donor Organizations
Erasmus Computing Grid
30 BioMedical
User Groups
Nationwide Distributed Office
~10.000 Cluster Nodes
~5.000 Medically Secur ed
~ D-Grid Donor Organizations
German MediGRID
Amazon Cloud
Organizing Broker Organization
Provider Organization
Users
Individual Provider
Thousands Worldwide
User Groups
Worldwide Distributed Offices
~Few Distributed Centers
~Millions Secured
~ Amazon EC2
Cluster/Grid Grid
Government/Public
Desktop Grid
Individual/Public
Amazon Cloud
Industrial/Private
Pluristic
Polytechnic
Local/Decentral
Monopolistic
Monotechnic
Central
Ballanced Mixture
Fig. 2. Abstraction and detailed structure of the Erasmus Computing Grid, the German
MediGRID, and the well known Amazon EC2 cloud. The three pillars are characterized by i)
individual/public “private” grids, ii) government/public grids and iii) the very few
industrial privately owned international clouds. Again all show the four levels involved in
grid infrastructures: i) users, ii) organizing broker organizations, iii) donor organizations,
and iv) individual donors. Again the three pillars are characterized by their means of
capacity: i) small scale desktop and small mainframes, ii) regional and medium sized
clusters, and iii) classic large scale cloud centres. And again whereas the first can be
characterized by pluristic, polytechnic local/decentral means, the last is characterized by
monopolistic, monotechnic and central terms. Although, the details may vary the structure
leads to similar changes on the micro and macro level, which can be understood by the
Human Ecology rectangle.
again four levels of organization are involved also in grid organizations: i) users, ii)
organizing broker organizations, iii) donor organizations, and iv) individual donors. In a
more abstract form this shows again that actually there are i) individuals and ii) societies
of individuals, which are both involved on each of the organization levels, with a different
degree of influence. Consequently, there is again a micro level from which a macro level
emerges, with influence on the micro level, i.e. that both levels are connected in a complex
and cyclical manner as in any evolutionary evolving system. Thus, the micro level is
constituted by an invironment and the macro level creates an environment. This we will
later see constitutes already again the Human Ecology rectangle as in the case of the energy
sector.