Water Conservation Part 4 docx
Bạn đang xem bản rút gọn của tài liệu. Xem và tải ngay bản đầy đủ của tài liệu tại đây (565.08 KB, 15 trang )
Water Conservation
36
2.3.2 Determination of total suspended solids (TSS)
Total suspended solids (TSS) analytical test was employed to determine current or future
potential emitters clogging problems arising from poor water quality. Water samples were
taken from representative three different shallow wells after operating the motor pump,
assumed as the worst case of water physical quality during water delivery moment in time.
Taking into consideration the recommendation given by Clesceri et al. (1998) a 250 ml of
water samples from each selected shallow wells were taken and oven dried at 105°c for 1
hour at the Soil Physics Laboratory Mekelle University.
The TSS was then calculated using Equation 5 and evaluated based on the Water Quality
Guidelines developed by Hanson et al. (1994):
1000AB
TSS
totalvolume
(5)
Where:
A = weight of filter + dried residue (mg), and
B = weight of filter (mg).
2.3.3 Evaluation of the water supply-demand for FDI system for selected test crops
Assessment of the existing water supply and the crop water requirements of the two
dominantly cultivated crops (onion and tomato) as test crops were done. The total amount
of water supplied to each crop throughout the growing season was assessed by multiplying
the amount of water applied per irrigation and the frequency of irrigation. The daily volume
of water supplied by the farmer to the test crops were taken from farmers' current operation
practice. The irrigation frequency was found to be two times per day; one in the morning
and the other in evening with total daily supply volume of 0.4m
3
water. Taking into account
reference evapo-transpiration (ET
o
), crop type, length of growth, growth stage and effective
rainfall, gross irrigation requirement was computed for the two test crops. An average daily
ET
o
5.12 mm/day as determined by Haftay (2009) was used for this study. The crop water
requirement for the two test crops was estimated by applying Equation (6) given as:
coc
ET ET K (6)
Where:
ET
c
= crop evapotranspiration;
ET
o
= reference evapotranspiration and
K
c
= crop coefficient values which were adapted from Doorenbos and Pruitt (1977).
The net irrigation requirement (NIR) was computed using Equation 7 given as:
ce
NIR ET P
(7)
Where:
ET
c
= crop evapotranspiration and
P
e
= effective rainfall.
Gross irrigation requirement (GIR), which is defined as the depth or volume of irrigation
water required over the whole cropped area excluding contributions from other sources, plus
water losses and /or operational wastes was estimated using Equation 8 (FAO, 1980) as:
Performance Assessment and Adoption Status of
Family Drip Irrigation System in Tigray State, Northern Ethiopia
37
a
NIR
GIR
E
(8)
Where:
GIR = gross water requirement and
E
a
= the application efficiency, assumed to be 90% as an attainable value of application
efficiency for drip irrigation.
2.4 Assessment of FDI kits dissemination trend and adoption Status
To understand the adoption and dissemination status across the region, it was essential to
know the spatial and temporal distribution of the system first . For this, a list of distributed
family drip irrigation kits over the period of 2004-2008 was obtained from the Tigray
Regional Bureau of Agriculture and Rural Development (BoARD), the Tigray Bureau of
Water Resource Development (BoWRD) and the Relief Society of Tigray (REST), local
development organizations operating in irrigation development in the region. Furthermore,
the records obtained from the three Bureaus were organized based on spatial and temporal
sequences. In addition, the delivered FDI kits were identified as installed and uninstalled to
understand their working conditions.
While for analysis of FDI adoption status and rate, a three-stage sampling techniques were
employed to collect data. Accordingly, random samples of 120 household heads were selected
from three sites (
Tabias). Each site consisted of 40 randomly selected respondent farmers from
both users and non-users of FDI technology. Besides this, a two-part questionnaire was
developed. The first questionnaire consisted of project structural evaluation based on attitudinal
or knowledge statements about FDI technology, with possible responses and explanations by
the respondent farmers. While the second questionnaire consisted of questions dealing with
demographic, education level, age, and source of water and related characteristics of the
respondents to identify and analyze variables that were supposed to influence FDI technology
adoption. The content of the questionnaire was designed using inputs from staff members of
the governmental and non-governmental organization, especially working with the FDI system
technology including FDI user farmers. Rejection and inclusion of the variables was made based
on the required expected frequency and related criteria as suggested by Rangaswamy (1995).
Finally, the adoption status and rate were analyzed using a Chi-square test statistics of the
contingency table at significance levels of P< 0.05 and 0.01.
3. Results and discussion
3.1 Performance assessment of the FDI system
3.1.1 Uniformity
The uniformity parameters (emission uniformity, flow variation, and uniformity coefficient)
values of the three selected FDI systems are given in Table 1. The average E
U
values for the
selected FDI systems were 93.67%, 93.85% and 94.34% respectively (Table 1). The emission
uniformity obtained from the experiment were found better as compared to the findings by
Polak and Sivanappan (2004), for low-cost drip systems using holes made with a heated
punch as emitters that reported uniformity rate of 85%. While systems using micro-tubes
had uniformity rates of approximately 90%. According to ASAE (1985) standards and other
experimental results of FAO (1984), on the general criteria for emission uniformity, emission
uniformity greater than 90% is characterized as an excellent range of performance.
Water Conservation
38
A flow variation (q
var
) values of 6.8%, 6% and 5% were obtained for FDI
1
, FDI
2
and FDI
3
respectively. According to Braltes (1986), general criteria for emitter flow variation gives as
<= 10% desirable, 10-20% acceptable and >20% unacceptable ranges. Thus, this field-based
result showed that the performances of all the three FDI system observations were within
the desirable range of recommendation which were having less than 10% emitter flow
variation. Moreover, a mean coefficient of variation (CV) for flow variation (qv
ar
) values of
0.34, 0.27 and 0.17 were obtained for FDI
1
, FDI
2
and FDI
3
respectively. This indicated that the
results obtained in this experiment were marginal to unacceptable for FDI
1
and average for
FDI
2
and FDI
3
based on
the guidelines set up by the American Society of Agricultural
Engineers ASAE (1985).
Average uniformity coefficient (Uc) values of 73%, 97% and 98 % were obtained for FDI
1
,
FDI
2
and FDI
3
respectively. These values indicate that FDI
2
and FDI
3
systems were found to
have a uniformity coefficient values rated as excellent (> 90%), but the uniformity coefficient
value for FDI
1
was below 85%, which was considered as rationally bad range of
performance as suggested by Malik et al. (1994).
In general the different aspects of the FDI uniformity indexes used in this study revealed
that the FDI technology has no as such significant problem in relation to non-uniform water
distribution within the field.
FDI
1
parameters
observed E
U (%)
q
Var (%)
C
V(ratio)
UC
(%)
Beginning 94.04 5.00 0.21 99.79
Middle 93.91 8.50 0.54 46.00
End 93.06 7.00 0.26 74.00
FDI
2
Beginning 94.05 3.00 0.02 98.00
Middle 95.14 10.00 0.02 98.00
End 92.35 5.00 0.04 96.00
FDI
3
Beginning 95.17 3.00 0.01 99.00
Middle 94.74 7.00 0.02 98.00
End 93.12 5.00 0.02 98.00
Eu: Emission uniformity; q
Var:
Flow variation; C
V:
Coefficient of variation; U
C:
Uniformity coefficient.
Table 1. Uniformity parameter values of the three selected FDI systems
Performance Assessment and Adoption Status of
Family Drip Irrigation System in Tigray State, Northern Ethiopia
39
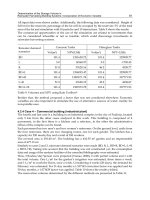
3.1.2 Total suspended solids (TSS) and emitter clogging hazards
Results of the TSS analytical test showed 144, 116 and 96 mg/l for shallow wells 1, 2 and 3
respectively (Table 2). According to Water Quality Guideline for micro irrigation developed
by Haman et al. (1987), the TSS results in this study fall in a moderate to severe grounds for
emitter clogging hazards. As shallow wells 1 and 2 are where a severe clogging problem is
likely to occur it calls for pre-filtration or improve filtration mechanisms within the system
before emitter plugging hazard occurs.
Pan No Sample
Mass
pan+
Volume of
water
sample
Mass pan+ mass TSS TSS (mg/L)=
code filter (gm)
(ml) filter + TSS (gm)
(gm) = [e-c]
[f/d] x 10
6
a b c d e f g
1
shallow
well 1
2 250 2.036 0.036 144
2
shallow
well 2
2 250 2.021 0.029 116
3
shallow
well 3
2 250 2.024 0.024 96
Table 2. Total suspended solids (TSS) for the three shallow wells.
3.1.3 Evaluation of the water demand and supply for FDI system
The estimated total water requirements for onion and tomato were 315 m
3
and 180 m
3
while the corresponding total water supply was 120 m
3
and 96 m
3
respectively.
Furthermore, the daily water demand for plot size of 500 m
2
is 2.1 m
3
for onion and 1.53
m
3
for tomato (Table 3).
From this result, the farmers need to apply the required quantity of water for the crop, and
for that they need to be aware of the supply-demand relationships through organizing
demonstrations and trainings. In case, labor availability is a problem to cover the entire area,
they may reduce the size of the irrigated plot from 500m
2
to 190 m
2
for onion and 27 m
2
for
tomato, respectively. Failure to supply the required amount of water to the crop would
result in a significant yield reduction, which could eventually force the farmers to abandon
the use of FDI system technology.
crop D.W.R G.W.R T.W.R Area D.W.S T.W.S Deficit Deficit
Type (mm/d)
(m
3
/A) (m
3
/A) (m
2
) (mm/d)
(m
3
/A) (m
3
/A) (%)
Onion 4.14 2.1 315 500 0.8 120 -195 61.9
Tomato 3.06 1.53 183.6 500 0.8 96 -87.6 52.28
D.W.R: Daily water requirement; D.W.S: Daily water supply; T.W.S: Total water supply;
G.W.R: Gross water requirement; d: Day ; A: Area.
Table 3. Comparison of water demand and supply for Onion and Tomato crops.
Water Conservation
40
3.2 Assessment of FDI kits dissemination trend and adoption status
3.2.1 Distribution trends of FDI system kits
Figures 4 & 5 show that the distribution of FDI kits has shown increasing trend both across
the years and zones. However, sites assessment results showed that, there was a variation in
FDI kit supply within a given time and place in all Zones of the region. Analysis of the
distribution records in the past 5 years (2004-2008) shows that, the maximum FDI kit
distribution was observed in year 2008. The established factory that is producing the
equipment required for drip irrigation system may have a significance contribution in
maximizing the temporal and special distribution trends of the technology.
Fig. 4. Temporal distribution trend of FDI system at zonal Level of the Tigray Regional State,
Northern Ethiopia
Fig. 5. Spatial distribution trend of FDI system at zonal level of the Tigray Regional State,
Northern Ethiopia.
However, the number of working (installed) FDI Kits throughout region were only 1442 out
of the 2615 supplied (i.e. 55 %). There is high spatial variation among the zones in the region
which ranges between 20 % in Southern Zone to 84 %, in Southeast Zone (Figure 5).
However, In Wukro district where this study was conducted, 100% the delivered FDI Kits
were installed in the field (Figure 6). This shows that Southeast Zone relatively attained the
satisfactory results in-terms of installing the delivered FDI kits at zonal level. Based on the
findings, discussions and communications (formal and informal) held with beneficiaries,
stakeholders, experts and administrators at different managerial levels during and between
the assessments of FDI trends, those areas with low achievement of FDI installation were
Performance Assessment and Adoption Status of
Family Drip Irrigation System in Tigray State, Northern Ethiopia
41
characterized by inadequate extension services, supervisions and monitoring the
operational progress and low involvement of non-governmental organizations (NGOs).
Since, the involvement of NGOs both in application of technique and operation of the
delivered FDI kits might be their own contribution during the installation.
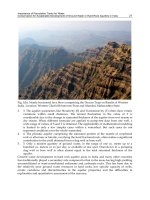
Fig. 6. FDI system distribution zones of the Tigray Regional State, Northern Ethiopia.
Conversely, the study area has no problem of installation for the delivered FDI kit.
Though, extension services, monitoring and other related activities may have less
importance, however, like other areas of the region, there is still variability in both
temporal and spatial distribution of FDI system kits (Figures 7 & 8). Yet, there are two
sites (Kihen and Debreberhan) among the 15 studied sites where FDI system intervention
was absent.
In majority of the cases in the study area (District), sites (
Tabias) with low to nil FDI system
intervention were located outside of the main road of the District. These areas are also
characterized by inadequate infrastructures such as access to roads, extension services,
marketing outlets that attributed to the slow pace of FDI dissemination in the study area.
Fig. 7. Temporal Distribution Trend of FDI kit for 15
Tabias of Wukro Woreda in Tigray
Regional Sate, Northern Ethiopia
Water Conservation
42
Fig. 8. Spatial Distribution Trend of FDI kit for 15
Tabias of Wukro Woreda in Tigray
Regional Sate, Northern Ethiopia
3.2.2 Factors controlling adoption of FDI system
3.2.2.1 Age group and adoption status
Age group was found to influence the FDI adoption rate significantly (P< 0.05; Table 4).
Younger farmers (30-45 years of age) were found relatively better adopters of FDI
technology than older ones as the latter were not convinced with the significance of
water drops to satisfy crop needs as compared to the one traditionally used furrow
irrigation.
Age FDI adoption status
group Current users Current non-users Future users Total
No (%) No (%) No (%) No (%)
30-45 20 54.1 9 24.3 8 21.6 37 100
46-60 10 37.1 8 29.6 9 33.3 27 100
60&above 8 14.3 40 71.4 8 14.3 56 100
Total 38 31.7 57 47.5 25 20.8 120 100
Table 4. Age group and FDI adoption status
3.2.2.2 Education level and FDI adoption status
Education level was found to influence adoption rate significantly (P < 0.05; Table 5).
Farmers with exposure to primary school (grades 1-6) were found dominant adopters of FDI
technology. Uneducated farmers were the lowest adopter. Therefore, in order to expand FDI
technology utilization it would be sound to work with literate farmers in general and grade
1-6 in particular.
Performance Assessment and Adoption Status of
Family Drip Irrigation System in Tigray State, Northern Ethiopia
43
Education FDI adoption status
level
Current
Users
Current non-users Future users Total
No (%) No (%) No (%) No (%)
Non-educated 9 18.8 30 62.5 9 18.7 48 100
1- 6 grade 19 42.2 9 20.0 17 37.8 45 100
Grade 7 & above 10 37.0 10 37.0 7 26.0 27 100
Total 38 31.7 49 40.8 33 27.5 120 100
Table 5. Education level and FDI adoption status
3.2.2.3 Access to water source type and FDI adoption status
Farmers having access to shallow well water source were found better adaptors of FDI
technology as compared to farmers having access to surface water source (P < 0.01; Table 6).
This variability in adoption rate of the technology is related to the location of the water
sources in relation to homesteads that made it easy to follow-up and manage the farm.
Moreover, using shallow wells as source of water for FDI technology is relatively secured
from vandalism of FDI kits because of the relative advantage being nearer to homesteads
with that of surface water sources.
Water FDI users FDI non-users Total
source No (%) No (%) No (%)
Ground 31 83.8 6 16.2 37 100
Surface 7 8.4 76 91.6 83 100
Total 38 31.7 82 68.3 120 100
Table 6. Access to water source and FDI adoption status
3.2.2.4 Gender and FDI adoption status
Female-headed households were found better adopters of the FDI technology as compared
to male-headed household heads though not significantly different (Table 7). The better
adoption rate of female household heads may arise from their access to work around their
homestead for long time. Moreover, the provision protocol of FDI kits encourages female
household heads.
Sex FDI users FDI non users Total
No (%) No (%) No (%)
Female 10 40.0 15 60.0 25 100
Male 28 29.5 67 70.5 95 100
Total 38 31.7 82 86.3 120 100
Table 7. Gender and FDI adoption status
Water Conservation
44
4. Conclusions
Household family drip irrigation technology has been introduced recently in the Tigray
Regional State as an option to conserve water and hence to increase crop production in
the region. This study evaluated its performance on the basis of various performance
indicators.
Average uniformity coefficient values of 73 %, 97 % and 98 % were obtained for FDI
1
, FDI
2
and FD
3
respectively. Based on ASAE (1985) criteria, the results obtained in this experiment
were marginal to unacceptable for FDI
1
, but good for FDI
2
and FDI
3
. The clogging hazard
was moderate to severe under current operation conditions of the FDI system, which may
add up on the cost of spare parts and would likely to reduce the adoption rate by farmers.
Therefore, regular inspection of emitters to identify clogged ones and undertaking of routine
maintenances are necessary. Dismantling, blowing in it, or flashing out with water could
help maintaining a clogged emitter. If, the situation is more serious, it is better to change the
emitters. On-line type of emitter is more favorable than in-line ones because on-line emitters
can be dismantled and repaired easily by the farmer. Frequent inspection and cleaning of
filter is also more important.
Under the existing FDI operating condition, the supplies of water for the crops were very
low to satisfy their demand. This indicates that, farmers and extension workers have
limited knowledge and perception about the FDI technology operation systems. Thus, the
users and development workers may need further training and demonstration of the
technology at field level under farmers’ operating condition. Moreover, appropriate
technical and agronomic guidance and support to farmers in development and
introduction of drip sets to sustain adopter’s motivation throughout the season are
needed.
The result of this field-based study revealed that the lower growth of FDI system utilization
is not associated with the technology itself but it is rather due to the lack of awareness by the
farmers and development agents on the technical and operational requirements of the FDI
system to effectively operate and utilize the technology at household level.
Therefore extension services to raise awareness on the utilization and management, and
mechanisms to monitor the development FDI technologies implementation should be
strengthened. Moreover, further study is still needed to analyze the economic feasibility of
the FDI system.
5. References
American Society of Agricultural Engineers ‘ASAE’.1985. Design, installation and
performance of trickle irrigation systems.
ASAE standard EP 405, St. Joseph,
Michigan, pp. 507-510.
Bureau of Agriculture and Rural Development ‘BoARD’ .2008.
A survey conducted in the
annual report of the District (wukro)
office of Agriculture and Rural
Development.
Barlts, V.F. 1986.
Operational principles-field performance and evaluation. Trickle irrigation for
crop production, Amsterdam, Elsevier, pp.216-240.
Clesceri L.S., Greenberg, A.E. Eaton, A.D. 1998. Method 2540D,
Standard Methods for the
Examination of Water and Wastewater,
20
th
Edition. American Public Health
Association. Washington DC.
Performance Assessment and Adoption Status of
Family Drip Irrigation System in Tigray State, Northern Ethiopia
45
Doorenbos, J., Pruitt, W.O. 1977. Crop Water Requirements. FAO Irrigation and Drainage
Paper, Bull. FAO n" 24, pp. 144.
De Lange M (1998).
Promotion of low cost and water saving technologies for small-scale irrigation.
South Africa:
MBB Consulting Engineers.
FAO. 1980.
Localized Irrigation: Design, installation, operation and evaluation. Irrigation and
Drainage Paper, No. 36, FAO, Rome.
FAO. 1984.
Localized Irrigation: Design, installation, operation and evaluation. Irrigation and
Drainage Paper, No. 36, FAO, Rome.
FAO. 1998.
Institution and technical operations in the development and management of small- scale
irrigation.
pp. 21-38. Proceedings of the third session of the multilateral cooperation
workshops for Sustainable Agriculture, Forest and Fisheries Development, Tokyo
Japan, 1995, FAO Water Paper, No. 17, Rome.
Federal Democratic Republic of Ethiopia Population Censes Commission F.D.R.E.P.C.C.
2008.
Population and housing census summary and statistical report of 2007. Pp 54.
Haman, D.Z., Smajstrla, A.G., Zazueta F.S. 1987.
Water Quality Problems Affecting Micro
irrigation in Florida.
Agricultural Engineering Extension Report 87-2. IFAS,
University of Florida
Hanson, B.A., Fauton, D.W., May. D. 1995.
Drip irrigation of row crops: An overview.
Irrigation Science l, 45(3), Pp 8-11.
Haftay Abrha. 2009.
Crop water fertilizer interaction and physico-chemical properties of the
irrigated soil.
Post graduate studies (unpublished). Mekelle University, Mekelle,
Ethiopia.
Isaya, V.S. 2001.
Drip Irrigation: Options for smallholder farmers in Eastern and Southern Africa.
Regional Land Management unit (RELMA/SIDA), technical and book series 24,
Nairobi, Kenya.
Integrated Food Security Program ‘IFSP’. 2005. A study conducted in the five year
development plan of the drought-prone areas of Tigray regional state districts.
Mekelle, Tigray, Ethiopia.
Kruse, E.G. 1978. Describing irrigation efficiency and uniformity. J. Irrig. and Drain Div.,
ASCE 104 (IR1), pp. 35-41.
Kirsten, U., Sygna, L., O’brien K., .2008.
Identifying sustainable path ways for climate adoption
and poverty reduction.
Pp - 44.
Keller, J., Keller, A.A. 2003.
Affordable drip irrigation systems for small farms in developing
countries.
Proceedings of the irrigation Association Annual Meeting in San Diego
CA, 18-20 November 2003. Falls Church, Virginia, Irrigation Association.
Malik, R.S., Kumar, K., Bandore, A.R. 1994.
Effects of drip irrigation levels on yield and water
use efficiency of pea
. Journal of Indian Society Soil Science. Vol. 44, No. 3. Pp 508-
509.
Polak, P., Sivanappan, R.K., 2004.
The potential contribution of low-cost drip irrigation to the
improvement of irrigation productivity in India
. Indian water resources
management sector review, report on the irrigation sector. The World Bank in
cooperation with the Ministry of Water Resources, Government of India, pp
121-123.
Rangaswamy, R. 1995. Agricultural statistics, new age international publishers. Pp105-110
Water Conservation
46
Smajstrla, A.G., Boman, B.J., Pitts, D.J. Zueta, F.S., 2002. Field evaluation of micro irrigation
water application uniformity.
Fla. Coop. Ext. Ser. Bul.265. Univ. of Fla.
Wu, I.P., 1983. A unit-plot for drip irrigation lateral and sub-main design. ASAE paper, St.
Joseph, MI 49085. No. 83-1595.
4
Alternative Management Practices for
Water Conservation in Dryland Farming:
A Case Study in Bijar, Iran
Fardin Sadegh-Zadeh
1
, Samsuri Abd Wahid
1
,
Bahi J. Seh-Bardan
1
, Espitman J. Seh-Bardan
2
and Alagie Bah
1
1
Department of Land Management, Faculty of Agriculture,
Universiti Putra Malaysia, Serdang, Selangor
2
Department of Water Science, Faculty of Agriculture, Zabol University,
1
Malaysia
2
Iran
1. Introduction
1.1 Water conservation
Water conservation in the arid and semi arid regions is an important issue that
influences both the environment and crop production. Runoff which is induced by
rainfall can cause soil erosion which poses a dominant threat against long-term
sustainability of farming (Derpsch et al., 1986). A further problem usually associated
with runoff is the loss of soil particles that may pollute water bodies. Pollutants
commonly found in runoff include soil particles, phosphorous, nitrogen, pesticides, etc.
(Motavalli et al., 2003a)
During runoff, soil particles in the form of displaced sediments are carried along with the
flowing water. The runoff mostly settles around the edge of a dam and the sediments it
contains will subsequently be deposited underneath the reservoir. This continuous and
gradual silting of the dam over time will consequently affect its capacity to store water.
The decrease in the capacity of reservoir depends on the concentration of soil particles in
the river that supplies the dam. In spite of decades of concerted research efforts,
sedimentation is still considered the most serious problem threatening the dam industry.
The deposition of soil particles in the dam may decrease the efficiency of the dams’
turbines.
1.2 Soil and water conservation practices in dryland farming
Dryland farming is the profitable production of useful crops without irrigation on lands that
receive annual rainfall of less than 500 mm per year. In the arid and semiarid regions, the
conservation of precipitation water for crop production is very vital. In dryland crop
production areas, a major challenge is to conserve precipitation water appropriately for use
during crop growth (Baumhardt and Jones, 2002). It is imperative that farming practices
should conserve and utilize the available rainfall efficiently. To optimize water storage
Water Conservation
48
under any precipitation condition, the soil should have enough infiltrability, permeability
and capacity to store water. Water is the main constraint in dryland farming in the West of
Iran. Precipitations tend to accrue during winter, while crops’ growth season in spring is
accompanied by high temperatures. These conditions are the constraints limiting crop
production in dryland agriculture in Iran (Hemmat and Eskandari, 2004b).
1.3 Tillage
The objective of tillage operations is to improve soil conditions including porosity,
temperature, and soil water storage capacity for increased crop production (Alvarez and
Steinbach, 2009). Tillage systems that practise conservation farming during the winter are
known as important methods in controlling soil erosion and runoff (Alvarez and Steinbach,
2009; Derpsch et al., 1986). Tillage practices play an important role in dry farming
agriculture; however, the appropriate implements, their time and method of use have to be
specific for different agro-climatic zones.
1.3.1 Conservation tillage
Conservation tillage research studies have focused on the effects of tillage practices on soil
and moisture conservation for increased crop production, water conservation and soil
erosion control. Several studies have attempted to develop appropriate and sustainable
tillage and residue management methods that would maintain favorable soil conditions
for crop growth. After harvest, stubble mulch is accumulated on the soil surface. Such
materials do not only prevent direct impact of raindrops on the soil, but also impede the
flow of water down the slope, thereby decrease the water flow on the soil surface and
increase the amount of infiltration water (Hemmat et al., 2007). Conservation tillage
systems have the potential to improve soil quality and reduce soil loss by providing
protective crop residue on the soil surface and improving water conservation by
decreasing evaporation losses (Su et al., 2007). Tillage creates a rough cloddy surface that
lengthens the time necessary for the rain to break down the clods and seal the surface.
Reduced tillage practices have been used in the production of many crops to increase soil
water conservation (Locke and Bryson, 1997; Peterson et al., 1998). Reduced tillage
practices protect soils from erosion and runoff by maintaining more crop residue on the
soil surface. The magnitude and trends of change in soil physical properties depends
on antecedent conditions, wheel tracks, soil texture and climate (Hobbs et al., 2008).
However, contradictory results have been reported in literature about these effects.
Mahboubi et al. (1993) showed the beneficial effects of long-term conservation tillage
systems including chisel plowing and no-tillage compared to conventional tillage in
ameliorating soil physical properties.
Compacted soils of arid regions have low organic matter contents and are proned to
crusting which may decrease infiltration, seedling emergence and plant growth (Unger and
Jones, 1998). For soils that are hard setting or have a root-restricting layer, some form of
mechanical loosening through deep tillage is necessary to conserve the soil and water in
order to facilitate crop growth (Nitant and Singh, 1995; Vittal et al., 1983). On the other hand
in some soils, water conservation and water and wind erosion contros are major goals of
conservation tillage systems. Any tillage method that keeps residue on the surface may
protect the soil against dispersion by rain drop impact and the pounded or flowing water
will decrease crusting (Hoogmoed and Stroosnijder, 1984; Pikul Jr and Zuzel, 1994)
Alternative Management Practices for
Water Conservation in Dryland Farming: A Case Study in Bijar, Iran
49
1.3.2 Comparing various tillage systems
Studies have revealed that tillage operations do modify soil properties including soil
structure (Roger-Estrade et al., 2004; Saggar et al., 2001), bulk density and porosity (GLSB
and KULIG, 2008; Lampurlanés, 2003; Unger and Jones, 1998), water retention and
distribution (Hemmat et al., 2007), root growth and yield (Box Jr and Langdale, 1984;
Busscher and Bauer, 2003; Shirani et al., 2002; Su et al., 2007).
Conventional tillage methods used by farmers result in physical degradation of soil and
increased soil erosion and runoff (Unger and Fulton, 1990). Excessive tillage results in
deterioration in the soil environment and also increases the cost of production. On the
other hand, the no- tillage system can affect the growth and establishment of plants
through increased weed competition and poor soil physical conditions. Reduced tillage
has been found to be feasible in improving soil properties (Locke and Bryson, 1997;
Peterson et al., 1998). Each tillage system modifies soil properties differently. Moldboard
plow buries plant residues and stubble, but chisel plow enables retention of plant residues
on soil surface.
1.3.3 Organic amendments and tillage
Previous studies have reported that application of sewage sludge, compost, farmyard
manure and other kinds of organic amendments resulted in a significant increase in
aggregate stability, water content, hydraulic conductivity and infiltration and a decrease in
bulk density (Arshad and Gill, 1997; Bahremand et al., 1999; Motavalli et al., 2003b; Shirani
et al., 2002). Some literature reported that application of manure to the soil decreased soil
compactibility (Mosaddeghi et al., 2003). They also showed that mixing manure with the soil
does not only decrease compactibility but also decrease subsoil compaction.
1.4 Mulching and water conservation
Stubble mulching aims at disrupting the soil drying process by protecting the soil surface at
all times either with a growing crop or with crop residues left on the surface during fallow.
The first benefit of the stubble mulch is that wind speed is reduced at the surface by up to
99% and, therefore, losses due to evaporation are significantly reduced (GLSB and KULIG,
2008). In addition, crop residues can improve water infiltration (Hemmat and Taki, 2001)
and decrease water runoff losses (Morin et al., 1984). Layered mulch could keep soil moist,
change soil moisture regime and help to keep the soil moist(Sadegh-Zadeh et al., 2009). The
decrease in evaporation by layered mulch was due to the ability of the mulch to decrease
soil temperature during the hot-dry season. Other studies on mulching and soil moisture
showed that tephra mulch could keep more soil moisture than the un-mulched soil and
tephra mulch were able to change aridic soil moisture regime into a udic one (Diaz et al.,
2005; Tejedor et al., 2002).
1.5 Justification of the study
Dryland production of wheat is the main cultivation system that accounts for the largest
area of Iran (Hajabbasi and Hemmat, 2000; Hemmat; Hemmat and Eskandari, 2004a;
Hemmat and Eskandari, 2006). In the semi-arid region of Iran, most of the precipitations
occur in the late autumn, winter and early part of spring, while the growth of wheat is
almost in the late spring. Hence, there water is not sufficient to grow wheat. On the other
Water Conservation
50
hand, most of the precipitation water are lost as runoff, particularly for bare lands and when
conventional tillage systems are used (Hemmat and Eskandari, 2006).
Chisel plow enables retention of maximum amount of stubble and residues on the soil
surface and there is no induced hard pan in soil profile (Barzegar et al., 2003).
Consequently, there tends to be an increase in water infiltration and storage, leading to a
decrease in soil erosion (Barzegar et al., 2003). Deep plowing with subsoiler has similar
characteristics to that of the chisel plow, but the only difference is the plowing depth.
Studies have shown that deep tillage system can improve soil physical properties including
decreased bulk density, infiltration rate and hydraulic conductivity, increased soil moisture
in soil profile and yield under dryland production (Busscher et al., 2000; Busscher et al.,
2002; Busscher et al., 2006; Laddha and Totawat, 1997; Motavalli et al., 2003b; Nitant and
Singh, 1995) .
Conservation tillage is the recommended method which helps to retain the crop residues in
the soil surface at the same time conserves the soil and water (Sow et al., 1997). However,
the presence of stubble and crop residues in soil surface may negatively influence yield
(Hemmat and Taki, 2001). Hence, farmers seem not to prefer practicing conservation tillage.
The use of moldboard plow is the frequently used method in this area but it buries stubble
and plant residues and produce a hard pan in the bottom of plow layer (Barzegar et al.,
2003).
Mulching is another feasible method to conserve water in semi-arid and arid regions
(Sadegh-Zadeh et al., 2009). Considerable amount of literatures have been published on
various tillage operations commonly used in some parts of Iran (Hemmat and Eskandari,
2004b; Hemmat and Eskandari, 2006; Mosaddeghi et al., 2009; Shirani et al., 2002). However,
there is no reported study on the combined effects of tillage systems and mulching practices
in the arid and semi-arid areas characterized by seasonal hot and dry summer and cold
winter. The production of winter wheat (Triticum aestivum L.) of the cultivar Sardary is
commonly practiced in this area.
1.6 Objectives of the study
The general objectives of the present study were to develop appropriate tillage and farm yard
mulching systems for water and soil conservation in an aridisols with the aim of improving
the grain yield of wheat (Triticum aestivum L.) of the cultivar Sardary. Specific objectives of
the study were to (i) compare the effect of moldboard plow (MP), chisel plow (CP) and deep
plow (DP) on soil properties, soil water content, runoff, soil loss and grain yield of wheat, (ii)
investigate effect of farmyard mulch (FM) on soil properties, water content, runoff, soil loss
and grain yield of wheat, and (iii) introduce a tillage system which is capable of conserving
precipitation water to optimize grain yield and decease surface runoff and soil loss.
2. Materials and methods
2.1 Site characteristics and soils
The experiment was conducted at three sites in one of the famous areas of dryland wheat
production in Bijar, Kurdestan province of Iran. The soils belong to the Aridisols order (Soil
Survey Staff, 2006). The soil of the experimental sites consist of different textural classes
(sandy loam, loam and clay loam). The mean annual precipitation of the region is 400 mm,
most of which is received from late autumn, winter and early spring. During winter, most of