Báo cáo hóa học: "Gait patterns in Prader-Willi and Down syndrome patients" potx
Bạn đang xem bản rút gọn của tài liệu. Xem và tải ngay bản đầy đủ của tài liệu tại đây (433.35 KB, 8 trang )
JNER
JOURNAL OF NEUROENGINEERING
AND REHABILITATION
Cimolin et al. Journal of NeuroEngineering and Rehabilitation 2010, 7:28
/>Open Access
RESEARCH
© 2010 Cimolin et al; licensee BioMed Central Ltd. This is an Open Access article distributed under the terms of the Creative Commons
Attribution License ( which permits unrestricted use, distribution, and reproduction in
any medium, provided the original work is properly cited.
Research
Gait patterns in Prader-Willi and Down syndrome
patients
Veronica Cimolin*
1
, Manuela Galli
1,2
, Graziano Grugni
3
, Luca Vismara
4
, Giorgio Albertini
2
, Chiara Rigoldi
1
and
Paolo Capodaglio
4
Abstract
Background: Prader-Willi (PWS) and Down Syndrome (DS) are two genetic disorders characterised by some common
clinical and functional features. A quantitative description and comparison of their patterns would contribute to a
deeper understanding of the determinants of motor disability in these two syndromes. The aim of this study was to
measure gait pattern in PWS and DS in order to provide data for developing evidence-based deficit-specific or
common rehabilitation strategies.
Methods: 19 PWS patients (17.7-40 yr) and 21 DS patients (18-39 yr) were evaluated with an optoelectronic system and
force platforms for measuring kinematic and kinetic parameters during walking. The results were compared with those
obtained in a group of normal-weight controls (Control Group: CG; 33.4 + 9.6 yr).
Results and Discussion: The results show that PWS and DS are characterised by different gait strategies. Spatio-
temporal parameters indicated a cautious, abnormal gait in both groups, but DS walked with a less stable strategy than
PWS. As for kinematics, DS showed a significantly reduced hip and knee flexion, especially at initial contact and ankle
range of motion than PWS. DS were characterised by lower ranges of motion (p < 0.05) in all joints than CG and PWS.
As for ankle kinetics, both PWS and DS showed a significantly lower push-off during terminal stance than CG, with DS
yielding the lowest values. Stiffness at hip and ankle level was increased in DS. PWS showed hip stiffness values close to
normal. At ankle level, stiffness was significantly decreased in both groups.
Conclusions: Our data show that DS walk with a less physiological gait pattern than PWS. Based on our results, PWS
and DS patients need targeted rehabilitation and exercise prescription. Common to both groups is the aim to improve
hypotonia, muscle strength and motor control during gait. In DS, improving pelvis and hip range of motion should
represent a major specific goal to optimize gait pattern.
Background
Prader-Willi (PWS) and Down Syndrome (DS) are two
different chromosomal disorders characterised by some
common clinical features, such as obesity, muscular
hypotonia, ligament laxity and mental retardation.
PWS is a complex multisystemic disorder equally
affecting males and females. The genetic basis is the
absent expression of the paternally active genes in the
PWS critical region on chromosome 15 [1]. It is charac-
terized by muscular hypotonia, ligament laxity, hyper-
phagia, severe obesity, short stature, hypogonadism,
mental retardation and dysmorphic features. Both hypo-
tonia and excessive body weight may affect the develop-
ment of motor and functional skills of PWS individuals
[2,3].
DS is caused by trisomy of chromosome 21 (Hsa21) and
is associated with a number of signs and symptoms
including learning disabilities, heart defects, craniofacial
dysmorphia and childhood leukaemia [4]. Physical activ-
ity patterns of DS are influenced by ligaments' laxity and
reduced muscle strength and tone [5]. Similarly to PWS,
the DS-related obesity may contribute to the reduced
motor skills observed in this population [6,7].
Among the latter, gait disorders are common in both
syndromes. They tend to progressively worsen as the
clinical picture advances, severely limiting the patients'
quality of life.
* Correspondence:
1
Bioeng. Dept., Politecnico di Milano, p.zza Leonardo Da Vinci 32, 20133,
Milano, Italy
Full list of author information is available at the end of the article
Cimolin et al. Journal of NeuroEngineering and Rehabilitation 2010, 7:28
/>Page 2 of 8
In previous studies, gait analysis has mainly focused on
DS with special reference to their specific associated
orthopaedic conditions and biomechanical limitations.
Caselli et al. [8] reported that walking in children and
adolescents with DS was characterized by a ''Chap-
linesque'' pattern with external rotation of the hips,
increased knee flexion and valgus and external rotation of
the tibia. Roizen et al [9] observed a plano-valgus foot
with marked pronation in DS children impairing postural
stability and gait. In adolescents and adults with DS, the
same authors described hallux valgus, "hammer toe"
deformities, plantar fasciitis and early onset of foot
arthritis associated with severe flat feet, with an overall
negative impact on ambulation and function. Parker et al.
[10]) studied the gait pattern of six DS children using
video analysis and reported a poor heel-toe rocking dur-
ing the stance phase and increased abduction of the lower
limb to facilitate foot clearance. Galli et al. [11] observed
a prolonged hip flexion during the gait cycle, an increased
knee flexion in the sagittal plane at the initial contact and
reduced ankle plantar-flexion ability at toe-off in 63 DS
children. Their gait was further characterized by a signifi-
cant decrease in plantar-flexor moments and generated
ankle power. More recently [12], the same authors dem-
onstrated that DS patients yield stiffer hips and less stiff
ankles as compared to normal-weight counterparts.
To our knowledge, only one quantitative study has
investigated the biomechanical strategy during gait in
PWS [13]. These authors compared the gait patterns of
adult PWS patients with those obtained in obese and nor-
mal-weight individuals. Their results showed that PWS
walked slower, with shorter stride length, lower cadence
and longer stance phase compared with both obese and
controls. Similarly, their ranges of motion at knee and
ankle level as well as their plantar-flexor activity were sig-
nificantly reduced.
Despite a different aetiology, the two genetic conditions
do share several clinical and functional features. Whether
the biomechanical determinants of such motor limita-
tions are the same is still unknown and needs further
investigations at various levels. Rehabilitation specialists
are challenged by motor disability in PWS and DS
patients, but they fail to provide evidence-based treat-
ment modalities. A deeper understanding of the causes of
their gait abnormalities, and ultimately of their motor
disability, may well generate novel spin-offs for rehabilita-
tion planning and treatment. 3-D gait analysis (GA) is
nowadays the most accurate tool to investigate the gait
pattern. From a clinical perspective, measuring the joint
angular displacement, reactions, moments and powers
provides insight into the 'how' (kinematics) and the 'why'
(kinetics) of the movement observed. No studies up to
now have addressed this issue of defining quantitative dif-
ferences in gait strategy between DS and PWS. We could
hypothesise that due to their common clinical and func-
tional features rehabilitation strategies aimed at reducing
motor disability in these two genetic conditions may
share some common bases. In this wake of evidence,
appropriate and effective rehabilitation and exercise pre-
scription could be tailored to the unveiled specific or
common deficits.
The aim of our study was therefore to identify, quantify
and compare the spatiotemporal, kinematic and kinetic
parameters of gait in PWS and DS adult patient using 3D-
Gait analysis (GA) and compare their results with those
obtained in a group of normal-weight control subjects.
Methods
Participants
Nineteen PWS and twenty-one DS patients matched for
age, height, weight and body mass index (kg/m2: BMI),
were enrolled in this study (Table 1).
The PWS patients had been periodically hospitalised at
the Ospedale San Giuseppe, Istituto Auxologico Italiano,
Piancavallo (VB), Italy. At admission, they underwent a
clinical assessment and attended a 4-week comprehensive
rehabilitation program. All patients showed the typical
PWS clinical phenotype [14]. Cytogenetic analysis was
performed in all participants; 13 out of them had intersti-
tial deletion of the proximal long arm of chromosome 15
Table 1: Clinical characteristics of the study groups.
PWS patients DS patients Control Group
Participants (M/F) 19 (11/8) 21 (12/9) 20 (10/10)
Age (years) 25.7 ± 6.1 25.7 ± 6.1 33.4 ± 9.6
Height (cm) 153.1 ± 6.90* 149.2 ± 9.10* 173.3 ± 5.01
Weight (Kg) 97.5 ± 19.0* 84.5 ± 10.9* 66.9 ± 8.5
BMI (Kg/m
2
)
41.3 ± 6.0* 37.2 ± 5.8* 22.8 ± 3.2
*All values are mesn ± sd
Data are expressed as mean (standard deviation).
+ = p < 0.05, PWS GROUP versus DS GROUP; *= p < 0.05 compared with Control Group.
Cimolin et al. Journal of NeuroEngineering and Rehabilitation 2010, 7:28
/>Page 3 of 8
(del15q11-q13). Uniparental maternal disomy for chro-
mosome 15 (UPD15) was found in 6 individuals.
The DS patients were all referred to the IRCCS "San
Raffaele Pisana", Tosinvest Sanità, Roma, Italy. The distri-
bution of chromosomal anomalies is pure trysomy 21 in
all of the DS patients.
All PWS and DS patients were able to understand and
complete the test and walk independently without aids.
Twenty age-matched individuals were included as con-
trols (Control Group: CG). Exclusion criteria for the con-
trol group included prior history of cardiovascular,
neurological or musculoskeletal disorders. They showed
normal flexibility and muscle strength and no obvious
gait abnormalities.
The study was approved by the Ethics Committees of
the two Institutes for PSW and DS patients. Written
informed consent was obtained by the parents or, when
applicable, by the patients.
Methods
The complete evaluation consisted of: clinical examina-
tion, video recording and 3 D Gait Analysis (GA).
The PWS patients were evaluated at the Movement
Analysis Lab of the San Giuseppe Hospital, Istituto Auxo-
logico Italiano, Piancavallo (VB), Italy, using an optoelec-
tronic system with 6 cameras (460 VICON, Oxford
Metrics Ltd., Oxford, UK) with a sampling rate of 100 Hz,
and two force platforms (Kistler, CH).
DS patients were assessed at the Movement Analysis
Lab of the IRCCS "San Raffaele Pisana", Tosinvest Sanità,
Roma, Italy, using a 12-camera optoelectronic system
(ELITE2002, BTS, Milan, Italy) with a sampling rate of
100 Hz, two force platforms (Kistler, CH) and 2 TV cam-
era Video system (BTS, Italy) synchronized with the sys-
tem and the platforms for videorecording.
To evaluate the kinematics of each body segment, pas-
sive markers were positioned on the participants' body, as
described by Davis [15]
After placement of the markers, subjects were asked to
walk barefoot at their own natural pace (self-selected
speed) along a walkway containing the force platforms at
the mid-point. Kinematic and kinetic data were collected
for each patient from five trials in order to guarantee
reproducibility of the results.
Data comparability between Laboratories
A potential bias of this study is the variability of data orig-
inating from the two different laboratory settings. Vari-
ability can indeed be present if different systems for
kinematic acquisition are used and differences in marker
positioning are evident. Therefore, two control subjects
were tested in both laboratories in order to assess the
consistency of the data measured with the two systems,
the markers' placement and the data collection proce-
dures.
Data analysis
All graphs obtained from GA were normalized as % of
gait cycle and kinetic data were normalized for individual
body weight.
For each participant (both patients and controls), three
out of five trials, consistent in terms of gait pattern (spa-
tio-temporal, kinematic and kinetic were considered for
analysis.
Using specific software (BTS EliteClinic, version
3.4.109, for the Movement Analysis Lab of IRCCS "San
Raffaele Pisana", Tosinvest Sanità, and Polygon Applica-
tion, version 2.4, for the Movement Analysis Lab of San
Giuseppe Hospital, Istituto Auxologico Italiano, data
were exported in .txt and .xls files. From these data for-
mat we identified and calculated some parameters (time/
distance parameters, angles joint values in specific gait
cycle instant, peak values in joint power graphs) using the
STATISTICA computer package (StatSoft Inc., Tulsa,
OK, USA). This procedure was performed by the same
operator to ensure data reproducibility. The following
parameters were evaluated:
Spatio-temporal parameters:
- % stance (as % of the gait cycle);
- mean velocity, normalised to the individual's height
(1/s);
- anterior step length, normalised to individual's height;
- cadence: number of steps in a time unit (steps/min).
Kinematics:
- the mean value (Mean PT index) of pelvis on sagittal
plane during the gait cycle;
- the values of angle of ankle (AIC index), knee (KIC
index) and hip joint (HIC index) at the Initial Contact
(IC);
- the values of maximal ankle dorsiflexion during stance
phase (AMSt index) and the maximal flexion of the knee
(KMSw index) during swing phase;
- the values of minimal ankle dorsiflexion in stance
phase (AmSt index), knee (KmSt index), and hip flexion
(HmSt index) during the gait cycle;
- the range of motion of the pelvis on the coronal (PO-
ROM index) and transversal (PR-ROM index) plane; the
range of motion of hip on coronal (HAA-ROM index)
and sagittal (HFE-ROM) plane; the range of motion of
knee (KFE-ROM index) on sagittal plane; the range of
motion of ankle on sagittal plane during stance phase
(ADP-ROM index).
Kinetics:
- the maximum ankle power during terminal stance
(maximum value of positive ankle power; APMax index,
W/Kg) and the same index normalized to the velocity of
progression (APMax norm index, m/s
2
). This parameter
Cimolin et al. Journal of NeuroEngineering and Rehabilitation 2010, 7:28
/>Page 4 of 8
represents the push-off capacity during walking and is
related to the forward propulsive power during gait.
Joint Stiffness:
In order to evaluate the effect of ligament laxity and
hypotonia on joint kinetics and kinematics, hip and ankle
stiffness (hip stiffness: Kh index; ankle stiffness: Ka index)
were expressed by plotting the values of the flexion-
extension moment versus the flexion-extension angle
over the gait cycle interval between 10% and 30%. The
10% to 30% interval (corresponding to the second rocker)
of the gait cycle was selected and the linear regression
was fitted. The angular coefficient of the linear regression
corresponded to the joint stiffness index, as described in
previous studies [16,17]. Knee stiffness was not included
in this study due to the lack of linear relation between
kinematics and kinetics.
These parameters were chosen in line with the studies
on gait strategy in PWS [13] and DS [11,12].
Statistical analysis
All the previously defined parameters were computed for
each participant and then the mean values and standard
deviations of all indexes were calculated for each group.
Data of the two individuals acquired in the two differ-
ent laboratories were compared with the Wilcoxon's test,
in order to detect significant differences due to marker
placement and data collection procedures in the two lab-
oratories. Data of the PWS and DS were compared using
Mann-Whitney U tests, in order to detect significant dif-
ferences between PWS and DS. The patients' and the
controls' data were compared with Mann-Whitney U
tests. Null hypotheses were rejected when probabilities
were below 0.05.
Results
Data comparability between Laboratories
We verified that marker placement and data collection
procedures in the two laboratories were compared and
the differences of all the computed kinematic and kinetic
data of the two healthy subjects were not statistically dif-
ferent (p > 0.05). On this basis data from other 18 control
subjects who served as the CG were acquired at the
Movement Analysis Lab of the San Giuseppe Hospital,
Istituto Auxologico Italiano.
Comparison between PWS and DS
In Table 1 the clinical characteristics of PWS, DS and CG
are reported.
Age was not significantly different among groups. BMI,
weight and height were similar in PWS and DS but signif-
icantly different from CG. In order to take in account the
variability in height and weight between pathological
groups and CG, stride length was normalised to the sub-
ject's height and kinetic data were normalised to the sub-
ject's weight.
In Tables 2 the mean values and standard deviations of
the spatio-temporal and kinematic indices considered in
this study for PWS, DS and CG are reported.
PWS patients were characterised by longer stance
duration than DS and normal cadence when compared to
DS patients. In terms of anterior step length and velocity
of progression, both PWS and DS showed reduced values
as compared to CG, with PSW performing better than
DS.
As for the pelvic joint, PWS and DS showed a forward
tilted pelvis in the sagittal plane (Mean PT index) with no
significant differences between groups. Their pelvic
range of motion in the transversal plane (PR-ROM index)
was close to normal. In the frontal plane (PO-ROM
index), PWS group was characterised by a higher pelvic
range of motion during walking as compared to DS and
CG.
The hip joint exhibited excessive flexion during the
whole gait cycle (HIC and HmSt indices) in both PWS
and DS patients, but PWS walked with a more flexed hip
at the initial contact (HIC index). The hip range of
motion (HFE-ROM index) was close to normal in PWS
and reduced in DS. So despite an increased hip flexion in
PWS, its range of motion was more functional as com-
pared to DS.
As for hip ab-adduction, the PWS patients were charac-
terised by an increased hip movement in the frontal plane
as compared to DS (HAA-ROM index).
The knee flex-extension plot revealed that, whilst the
PWS group showed an excessively flexed knee as com-
pared to DS at the initial contact (KIC index), both PWS
and DS obtained values close to normal in midstance
(KmSt index). In the swing phase, the maximum value of
knee flexion (KMSw index) was reduced in both PWS
and DS, with generally higher mean values in PWS lead-
ing to a wider joint range of motion (KFE-ROM index)
than that observed in DS.
The analysis of the ankle kinematics showed a plantar
flexed position with reduced range of motion (ADP-
ROM index) during the whole stance phase (AIC, AMSt
indices) in DS, while PWS were limited at the initial con-
tact (AIC index) and during midstance (AMSt index),
even if their dorsiflexion capacity, and therefore their
range of motion (ADP-ROM index), in stance phase was
higher than that observed in DS. During the swing phase,
PWS were characterised by higher values of ankle dorsi-
flexion when compared to DS and CG. All these differ-
ences are significant from a statistical point of view (p <
0.05).
As for kinetic parameters (ankle power), both PWS and
DS showed lower maximum ankle power during terminal
stance (APMax index; PWS: 1.96 ± 0.56 W/Kg; DS: 1.35 ±
0.64 W/Kg; p = 0.0003) than CG (3.07 ± 0.86 W/Kg), with
DS significantly more limited than PWS. The APMax
Cimolin et al. Journal of NeuroEngineering and Rehabilitation 2010, 7:28
/>Page 5 of 8
index normalised to the velocity of progression (APMax
norm index) did not reveal significant differences among
groups (PWS: 2.05 ± 0.49 m/s
2
; DS: 2.02 ± 0.86 m/s
2
; CG:
2.42 ± 3.06 m/s
2
; PWS vs. DS: p = 0.2261)
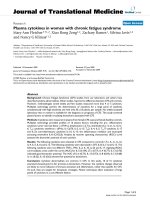
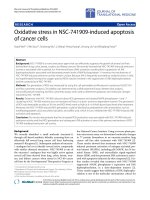
Joint stiffness data are shown in Fig. 1. PWS and DS
were significantly different in terms of hip stiffness (Kh
index): while PWS showed mean values close to CG, DS
showed a significantly stiffer hip as compared to PWS (p
< 0.0368) and CG. As for ankle stiffness (Ka index), no
statistical differences were found between PWS and DS
(p = 0.7716): both groups were characterised by reduced
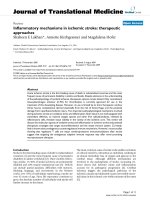
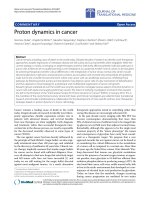
values as compared to CG. An example of hip stiffness for
a PWS, a DS and a CG subject is shown in Fig. 2.
Discussion
The aim of this comparative study was the quantification
of spatio-temporal, kinematic and kinetic parameters
during gait in patients affected by PWS and DS. While
gait pattern in DS has been previously addressed, limited
evidence exists in the PWS population. Lacking objective
functional data, evidence-based rehabilitation strategies
for PWS have failed to be implemented. From a clinical
perspective, the biomechanical comparison of gait in
these two genetic conditions sharing some clinical and
functional features may provide a basis for developing
either deficit-specific or common rehabilitative strate-
gies.
Table 2: Spatio-temporal and kinematic parameters of the study groups.
PWS GROUP DS GROUP Control Group P-value (PWS vs. DS)
Spatio-temporal
parameters
%stance (% gait cycle) 63.88 (9.12)* + 60.95 (3.10) 59.45 (1.45) 0.0034
Anterior step length 0.33 (0.04)*+ 0.28 (0.04)* 0.88 (0.21) 0.0087
Cadence (step/min) 111.76 (9.12)+ 94.32 (11.24)* 111.80 (4.80) 0.0001
Velocity (1/s) 0.63 (0.10)*+ 0.45 (0.08)* 0.78 (0.06) 0.0002
Pelvis (°)
Mean PT 20.86 (8.84)* 18.01 (4.84)* 6.53 (6.97) 0.0859
PO-ROM 8.46 (3.36)*+ 6.05 (2.12) 6.01 (2.53) 0.0003
PR-ROM 10.95 (3.61) 9.95 (2.69) 10.72 (5.32) 0.2803
Hip joint (°)
HIC 45.88 (12.82)* + 33.74 (11.46)* 27.23 (9.57) 0.0001
HmSt 1.52 (10.66)* 1.32 (9.20)* -14.83 (9.60) 0.9242
HFE-ROM 45.37 (5.99)+ 32.42 (8.61)* 43.52 (4.76) 0.0001
HAA-ROM 16.89 (3.95)*+ 12.58 (4.21) 10.71 (3.06) 0.0001
Knee joint (°)
KIC 8.42 (6.64)* + 2.54 (7.75) 4.06 (6.63) 0.0006
KmSt -2.58 (5.92) 0.41 (8.09) 0.12 (3.82) 0.0538
KMSw 53.25 (7.61)* + 41.06 (10.68)* 59.01 (6.18) 0.0001
KFE-ROM 55.83 (8.05)*+ 43.81 (11.34)* 60.28 (6.31) 0.0001
Ankle joint (°)
AIC -3.15 (9.24)* -3.55 (4.88)* 1.81 (6.87) 0.4503
AMSt 14.80 (8.81)* + 11.47 (4.26)* 21.04 (5.16) 0.0303
AmSt -10.25 (8.79)+ -2.94 (3.91)* -8.74 (9.40) 0.0002
ADP-ROM 25.16 (3.38)+ 14.41 (3.77)* 27.72 (6.56) 0.0001
AMSw 13.77 (9.03)* + 6.15 (4.40) 8.63 (9.93) 0.0003
Data are expressed as mean (standard deviation).
+= p < 0.05, PWS GROUP versus DS GROUP; *= p < 0.05 compared with Control Group.
(ROM: Range Of Motion; PT: Pelvic Tilt; PO: Pelvic Obliquity; HIC: Hip at IC; HFE: Hip Flex-Extension; HAA: Hip Ab-Adduction; KIC: Knee at IC;
KFE: Knee Flex-Extension; AIC: Ankle at IC; ADP: Ankle Dorsi-Plantarflexion; IC: Initial Contact; St: Stance; Sw: Swing; M: maximum value; m:
minimum value)
Cimolin et al. Journal of NeuroEngineering and Rehabilitation 2010, 7:28
/>Page 6 of 8
The results of our study revealed that these two syn-
dromes are characterised by different gait patterns. With
regard to spatio-temporal parameters, both PWS and DS
walk with longer stance duration, reduced anterior step
length and lower velocity of progression when compared
to CG. These parameters indicate a cautious, abnormal
gait in both groups, aiming at balance and stability in
individuals who bear an excessive body weight [18]. The
comparison between PWS and DS outlined significant
differences in terms of cadence, anterior step length and
progression velocity. PWS were in fact characterised by
values closer to normal than DS and are were able to walk
with a more "stable" strategy.
Hip flexion was present throughout the gait cycle in
PWS and DS, due to a forward pelvic tilt. PWS, however,
were characterised by a more pronounced flexion at the
initial contact than DS (HIC index). This strategy allows
PWS a fair hip range of motion during gait (HFE-ROM
index), whereas DS showed a limited excursion. The rea-
son for that may be linked to the anatomical configura-
tion of their pelvic girdle: the so-called "mongol pelvis" is
characterised by a deeper acetabulum and a decrease in
the cephalo-caudal diameter and acetabular angle [10,19].
In the frontal plane, hip excursion (HAA-ROM index)
was higher in PWS than DS and CG. This strategy,
directly linked to the pelvis movement in the frontal
plane (PO-ROM index), appears to produce together
with obesity and hypotonia the typical external rotation
of the hip during stance [20]. This may account for faster
walk and longer steps in PWS as compared to DS.
As for ankle kinematics, DS were characterised by an
increased plantar flexion and reduced dorsal flexion
throughout the gait cycle with a globally limited ankle
range of motion. On the contrary, PWS showed an ankle
strategy close to normal, apart from a slight plantar flex-
ion at the initial contact and an increased dorsal flexion
during swing. The PWS group was generally character-
ised by a wider, closer to normal range of motion in all of
the lower limb joints in the sagittal plane.
In terms of ankle kinetics, PWS and even more DS
showed lower peak ankle power than CG (APMax index),
meaning a lower propulsion capacity during terminal
stance. This result was consistent with previous studies
[21]. Two possible hypotheses can be formulated for this
limitation. Firstly, lower gait velocity in PWS and DS may
affect ankle power. After normalising APMax index by
gait velocity (APMax norm index) no significant differ-
Figure 1 Joint stiffness values of the study groups. Data are expressed as mean (standard deviation). + = p < 0.05, PWS GROUP versus DS GROUP;
* = p < 0.05 compared with Control Group. Kh: hip stiffness; Ka: ankle stiffness.
0
0.02
0.04
0.06
0.08
0.1
0.12
0.14
Kh Ka
N*m/Kg* deg
PWS
DS
CG
+ *
**
Cimolin et al. Journal of NeuroEngineering and Rehabilitation 2010, 7:28
/>Page 7 of 8
ences among groups were evident. Secondly, the reduced
push-off may be linked to muscle weakness which is a
general feature of these patients. In particular, the triceps
surae, mostly responsible for the generation of ankle
power, may ineffectively contract during terminal stance.
Capodaglio et al. [22] demonstrated that PWS patients
have a reduced muscular strength as compared to weight-
matched non genetically obese patients. Relative muscle
weakness inducing earlier fatigue has also been described
in obese patients [23].
Interestingly, we found differences in joint stiffness in
PWS and DS. At hip level, PWS showed values close to
normal, while in DS increased stiffness values were mea-
sured. At ankle level, joint stiffness was significantly
decreased in both groups.
It is known that hypotonia and ligament laxity are com-
mon in PWS [24] and DS [25]. Our results suggest that
the degree of hypotonia and ligament laxity may vary
across various joints, being higher at ankle level where
stiffness is decreased in both DS and PSW.
The increased hip stiffness in DS we found is consistent
with the literature and may represent, together with the
anatomical configuration of the pelvic girdle [26], a com-
pensatory mechanism for muscle weakness [12]. Stiffness
values closer to the normal range suggest a more "physio-
logical" walking strategy in PWS than DS.
A potential weakness of this study may be the variabil-
ity of data, since PWS and DS patients were evaluated in
two different laboratories. However, we had previously
compared markers' placement, procedures and data from
normal-weight subjects in the two laboratories and no
inconsistencies between laboratories occurred. Another
bias of the study is that participants were not compared
in terms of orthopaedic characteristics. PWS patients
tend to develop a range of orthopaedic problems includ-
ing scoliosis, hip dysplasia, flat feet, and pain syndromes
of the lower limbs which may have an impact on gait.
Also, the degree of muscular hypotonia and weakness,
ligament laxity and cognitive impairment had not been
measured nor compared between groups, thus hindering
interpretation of the findings. As overweight is a distinc-
tive feature in both PWS and DS, their gait pattern should
have been more rigorously compared with obese instead
of normal-weight individuals. However, the main object
of our investigation was to compare gait strategy in PWS
and DS patients to identify possibly common rehabilita-
tion strategy.
Figure 2 An example of hip angle-moment plot cycle during second rocker for a participant with PWS, for one with DS and one healthy
individual is reported. The slope of the joint moment plotted as a function of joint angle during second rocker represents hip joint stiffness.
y = 0.0215x + 0.1357
R
2
= 0.9407
y = 0.0691x - 0.6008
R
2
= 0.9912
y = 0.0161x - 0.2553
R
2
= 0.9231
-0.4
-0.2
0
0.2
0.4
0.6
0.8
1
-10 0 10 20 30
PWS
DS
CG
PWS:
DS:
CG:
Cimolin et al. Journal of NeuroEngineering and Rehabilitation 2010, 7:28
/>Page 8 of 8
Conclusions
From a clinical point of view, quantitative characterisa-
tion of gait patterns in PWS and DS is important to
develop, differentiate and enhance the rehabilitative
options. The quantification of their peculiar gait deficits
strongly support the issue that PWS and DS patients need
targeted rehabilitation and exercise prescription. Com-
mon to PWS and DS is the aim to improve hypotonia,
muscle strength and motor control during gait. Both
patient groups should be encouraged to walk for its posi-
tive impact on muscle mass and strength and energy bal-
ance. In DS, improving pelvis and hip range of motion
should represent a specific major goal to optimize gait
pattern and prevent the onset of compensatory strategies.
Evidence-based rehabilitation programs would contrib-
ute to improve daily functioning, quality of life and
weight management issues in those patients.
Competing interests
All authors haven't any conflicts of interest and any financial interest.
All authors attest and affirm that the material within has not been and will not
be submitted for publication elsewhere
Authors' contributions
VC made substantial contributions to analysis and interpretation of data and
was involved in drafting the manuscript. MG made contribution to conception,
design and interpretation of data, revising the manuscript critically and gave
the final approval of the manuscript. GG made contribution to interpretation of
data, revising the manuscript critically. LV made substantial contributions to
data acquisition, elaboration and interpretation. GA made contribution to
interpretation of data, revising the manuscript critically. CR made contribution
to interpretation of data and to revision of the final version of the manuscript.
PC made contribution to conception, design and interpretation of data, revis-
ing the manuscript critically and gave the final approval of the manuscript. All
authors read and approved the final manuscript.
Author Details
1
Bioeng. Dept., Politecnico di Milano, p.zza Leonardo Da Vinci 32, 20133,
Milano, Italy,
2
IRCCS "San Raffaele Pisana", Tosinvest Sanità, Roma, Italy,
3
Divisione di Auxologia, Ospedale San Giuseppe, Istituto Auxologico Italiano,
Via Cadorna 90, I-28824, Piancavallo (VB), Italy and
4
Laboratorio di Ricerca in
Biomeccanica e Riabilitazione, Ospedale San Giuseppe, Istituto Auxologico
Italiano, Via Cadorna 90, I-28824, Piancavallo (VB), Italy
References
1. Bittel DC, Butler MG: Prader-Willi syndrome. Clinical genetics,
cytogenetics and molecular biology. Expert Rev Mol Med 2005, 7:1-20.
2. Theodoro MF, Talebizadeh Z, Butler MG: Body composition and fatness
patterns in Prader-Willi syndrome: comparison with simple obesity.
Obesity 2006, 14:1685-1690.
3. Chedd N, Levine K, Wharton RH: Educational considerations for children
with Prader-Willi syndrome. In Management of Prader-Willi syndrome 3rd
edition. Edited by: Butler MG, Lee PDK, Whitman BY. New York: Springer;
2006:302-316.
4. Wiseman FK, Alford KA, Tybulewicz VLJ, Fisher EMC: Down syndrome -
recent progress and future prospects. Hum Mol Genet 2009, 18:R75-R83.
5. American Academy of Pediatrics, Committee on Genetics: Health
supervision for children with Down syndrome. Pediatrics 2001,
107:442-449.
6. Bhaumik S, Watson JM, Thorp CF, Tyrer F, McGrother CW: Body mass
index in adults with intellectual disability: distribution, associations
and service implications: a population-based prevalence study. J
Intellect Disabil Res 2008, 52:287-298.
7. Barnhart RC, Connolly B: Aging and Down syndrome: implications for
physical therapy. Phys Ther 2007, 83:1399-1406.
8. Caselli MA, Cohen-Sobel E, Thompson J, Adler J, Gonzalez L:
Biomechanical management of children and adolescents with Down
syndrome. J Am Pediatr Med Assoc 1991, 81:119-27.
9. Roizen NJ, Patterson D: Down's syndrome. Lancet 2003,
361(9365):1281-9.
10. Parker AW, Bronks R: Gait of children with Down syndrome. Arch Phys
Med Rehabil 1980, 61:345-51.
11. Galli M, Albertini G, Tenore N, Crivellini M: Gait analysis in children with
Down syndrome.
Progr Rep-Intern Rev Med Sci 2001, 13:21-7.
12. Galli M, Rigoldi C, Brunner R, Virji-Babul N, Albertini G: Joint stiffness and
gait pattern evaluation in children with Down syndrome. Gait Posture
2008, 28:502-506.
13. Vismara L, Romei M, Galli M, Montesano A, Baccalaro G, Crivellini M,
Grugni G: Clinical implications of gait analysis in the rehabilitation of
adult patients with "Prader-Willi" Syndrome: a cross-sectional
comparative study ("Prader-Willi" Syndrome vs matched obese
patients and healthy subjects). J Neuroeng Rehabil 2007, 4:14.
14. Holm VA, Cassidy SB, Butler MG, Hanchett JM, Greenswag LR, Whitman BY,
Greenberg F: Prader-Willi syndrome: consensus diagnostic criteria.
Pediatrics 1993, 91(2):398-402.
15. Davis RB, Ounpuu S, Tyburski DJ, Gage JR: A gait analysis data collection
and reduction technique. Human Movement Science 1991, 10:575-587.
16. Davis RB, De Luca A: Gait characterization via dynamic joint stiffness.
Gait Posture 1996, 4:224-31.
17. Frigo C, Crenna P, Jensen LM: Moment-angle relationship at lower limb
joints during human walking at different velocity. J Electromyogr
Kinesiol 1996, 6:177-90.
18. Proto C, Romualdi D, Cento RM, Romano C, Campagna G, Lanzone A: Free
and total leptin serum levels and soluble leptin receptors levels in two
models of genetic obesity: the Prader-Willi and the Down syndromes.
Metabolism Clinical and Experimental 2007, 56:1076-1080.
19. Bettuzzi C, Magnani M, Lampasi M, Donzelli O: Instability and dislocation
of the hip in Down syndrome: report of two cases and proposition of a
diagnostic protocol. Minerva Pediatr 2008, 60:1445-50.
20. Volpe RG, Clark NE, Mazzatta JA, Schlein SR: The lower extremity
manifestations of Prader-Willi syndrome. The Journal of Foot and Ankle
Surgery 1995, 34:223-227.
21. Cioni M, Cocilovo A, Rossi F, Paci D, Valle MS: Analysis of ankle kinetics
during walking in individuals with Down syndrome. Am J Ment Retard
2001, 106(5):470-8.
22. Capodaglio P, Vismara L, Menegoni F, Baccalaro G, Galli M, Grugni G:
Strength characterization of knee flexor and extensor muscles in
Prader-Willi and obese patients. BMC Musculoskelet Disord 2009, 10:47.
23. Syed IY, Davis BL: Obesity and osteoarthritis of the knee: hypotheses
concerning the relationship between ground reaction forces and
quadriceps fatigue in long-duration walking. Med Hypotheses 2000,
54:182-185.
24. Kroonen LT, Herman M, Pizzutillo PD, MacEwen GD: Prader-Willi
syndrome: clinical concerns for the orthopaedic surgeon. J Pediatr
Ortop 2006, 26:673-679.
25. Henderson SE, Morris J, Ray S: Performance of Down syndrome and
other retarded children on the Cratty Gross Motor Test. Am J Ment Defic
1981, 85:416-424.
26. Shaw ED, Beals RK: The Hip Joint in Down's Syndrome. Clinical
Orthopaedics and Related Research 1992, 278:101-7.
doi: 10.1186/1743-0003-7-28
Cite this article as: Cimolin et al., Gait patterns in Prader-Willi and Down syn-
drome patients Journal of NeuroEngineering and Rehabilitation 2010, 7:28
Received: 19 October 2009 Accepted: 21 June 2010
Published: 21 June 2010
This article is available from: 2010 Cimolin et al; licensee BioMed Central Ltd. This is an Open Access article distributed under the terms of the Creative Commons Attribution License ( ), which permits unrestricted use, distribution, and reproduction in any medium, provided the original work is properly cited.Journal of NeuroEn gineerin g and Reha bilitatio n 2010, 7:28