Báo cáo hóa học: "The relation between neuromechanical parameters and Ashworth score in stroke patients" ppt
Bạn đang xem bản rút gọn của tài liệu. Xem và tải ngay bản đầy đủ của tài liệu tại đây (806.31 KB, 16 trang )
RESEA R C H Open Access
The relation between neuromechanical
parameters and Ashworth score in stroke patients
Erwin de Vlugt
1*†
, Jurriaan H de Groot
2,3†
, Kim E Schenkeveld
2
, J Hans Arendzen
2
, Frans CT van der Helm
1
,
Carel GM Meskers
2,3†
Abstract
Background: Quantifying increased joint resistance into its contributing factors i.e. stiffness and viscosity
(“hypertonia”) and stretch reflexes ( “hyperreflexia”) is important in stroke rehabilitation. Existing clinical tests, such as
the Ashworth Score, do not permit discrimination between underlying tissue and reflexive (neural) properties. We
propose an instrumented identification paradigm for early and tailor made interventions.
Methods: Ramp-and-Hold ankle dorsiflexion rotations of various durations were imposed using a manipulator. A
one second rotation over the Range of Motion similar to the Ashworth condition was included. Tissue stiffness and
viscosity and reflexive torque were estimated using a nonlinear model and compared to the Ashworth Score of
nineteen stroke patients and seven controls.
Results: Ankle viscosity moderately increased, stiffness was indifferent and reflexive torque decreased with
movement duration. Com pared to controls, patients with an Ashworth Score of 1 and 2+ were significantly stiffer
and had higher viscosity and patients with an Ashworth Score of 2+ showed higher reflexive torque. For the one
second movement, stiffnes s correlated to Ashworth Score (r
2
= 0.51, F = 32.7, p < 0.001) with minor uncorrelated
reflexive torque. Reflexive torque correlated to Ashworth Score at shorter movement durations (r
2
= 0.25, F = 11,
p = 0.002).
Conclusion: Stroke patients were distinguished from controls by tissue stiffness and viscosity and to a lesser extent
by reflexive torque from the soleus muscle. These parameters were also sensitive to discriminate patients, clinically
graded by the Ashworth Score. Movement duration affected viscosity and reflexive torque which are clinically
relevant parameters. Full evaluation of pathological joint resistance therefore requires instrumented tests at various
movement conditions.
Background
Increased mechanical resistance to an imposed move-
ment is common after central nervous system damage,
such as stroke and may interfere with function. Its
assessment and treatment are therefore major goals in
rehabilitation. Main contributors to increased joint resis-
tance are increased viscosit y and stiffness of muscle and
connective tissue (clinically labeled “hypertonia” )and
hyperactivity of the stretch reflex ( clinically labeled
“spasticity ”) [1]. The Ashworth Score (AS) is a widely
used clinical measure of joint resistance [2]. The AS
subjectively grades the manual sensation of mec hanical
resistance experienced by the examiner during a one
second (1 s) joint rotation over the full range of motion
[3]. The impossibility to discriminate between the
underlying mechanisms and the limited reproducibility
and resolution have been the motivating challenge to
develop an alternative method describing joint resistance
in quantitative neurome chanical measures from the tor-
que response [4]. Discerning muscular and connective
tissue properties from the neural reflexes would facili-
tate the diagnosis of the physiological substrate of
increased joint resistance and the subsequent indi cation
for treatment.
Quantitative studies focused on the characteristics of the
torque response signals, ei ther versus time or joint angle
[2,5-7]. Peak torque, rate of change and offset of the torque
* Correspondence:
† Contributed equally
1
Department of Biomechanical Engineering, Faculty of Mechanical
Engineering, Delft University of Technology, Mekelweg 2, 2628 CD, Delft, The
Netherlands
de Vlugt et al. Journal of NeuroEngineering and Rehabilitation 2010, 7:35
/>JNER
JOURNAL OF NEUROENGINEERING
AND REHABILITATION
© 2010 de Vlugt et al; licensee BioMed Central Ltd. This is an Open Access article distributed under the terms of the Creative Commons
Attribution License ( which permits unrestricted use, distribution, and reprod uction in
any medium, provided the original work is properly cited.
were found to correlate with AS but did not allow for dis-
crimination between individual components of joint resis-
tance. Alternatively, computational models allowed for
simultaneous estimation of viscosity, stiffness and reflex
torque [8-1 1]. Crit ical in s uch model-based system identifi-
cation is the s tructure of the model comprising the rel evant
neuromechanical components. As in almost any biological
system, joint mechanical behavior is highly nonlinea r for
substantial changes of states, i .e. j oint position and velocity,
asisthecaseduringe.g.anAshworthtest[12-14].This
implies that a specific linear model structure that is valid
for one combination of states will be invalid for almost any
other combination. As a consequenc e, result s obta ined
from small amplitude m odels [8,14] may not be generalized
to large amplitude conditions. For large amplitude joint
rotations, important nonlinear properties such as e.g. the
joint angle-dependent stiffness may not be neglected [9]. It
is therefore not surprising that different and sometimes
conflicting r esults were reported from different models a nd
types of joint movements [2,8,9]. For a valid description of
joint neuromechanical behavior during large angular
excursions, nonlinear mod eling is thus required.
The main goal of this study was to quant ify the inde-
pendent neuromechanical determinants of ankle joint
resistan ce, i.e. muscle and connective tissue related stiff-
ness and viscosity and reflex generated torque of stroke
patients and healthy controls for a range of different
movement durations using a nonlinear neuromechanical
model. We then aimed to answer the following ques-
tions:
1. To what extent does duration of an imposed
movement affect neuromechanical parameters, i.e.
stiffness, viscosity and reflexive torque, in chronic
stroke patients and healthy subjects?
2. Do neuromechanical parameters discriminate
between stroke patients and healthy subjects?
3. Do neuromechanic al parameters correlate to dis-
order severity as graded by the AS?
The clinical relevance of the instrumented identifica-
tion is to directly attain patients to the appropriate
treatmentandtobeabletoquantifytheeffectsof
treatment.
Methods
Subjects & patients
A convenience sample of nineteen stroke patients (mean
age 63.6, SD 8.5 years) was recruited from the outpati-
ent clinics of the Department of Rehabilitation Medicine
of the Leiden University Medical Center and the Rijn-
land’s Rehabilitation Center, Leiden, the Netherlands.
Patient demographics are summarized in Table 1. Inclu-
sion criteria were unilateral stroke resulting i n a hemi-
paresis and the ability to walk a minimum distance of
6 meters. The use of an assistive device (cane or AFO,
see Table 1) was permitted. Patients were excluded if
they had seve re cognitive or language deficits interfering
with the comprehension of instructions required to par-
ticipate in the study (Minimal Mental State Examina-
tion, MMSE < 25 points), a pre-existing walking
disability and/or orthopedic problems of the paretic
foot/ankle. Pre-existing walking disability was defined as
a denial to the question “could you walk normally
before the stroke?”.
Seven healthy subjects (mean age 55.4, SD 10.3 years)
were recruited as a control group. The medical ethics
committee of Leiden University Medical Center
approved the study. All participants gave their written
informed consent prior to the experimental procedure.
Instrumentation
Subjects were seated with their hip and knee positioned
at approximately 110° and 160° of flexion respectively.
Ankle rotations were applied by means of an electrically
powered single axis footplate (MOOG FCS Inc., Nieuw
Vennep, The Netherlands), see Figure 1. The foot was
fixed onto the footplate by Velcro straps. Axes of the
ankleandfootplatewerealignedbyvisuallyminimizing
knee translation in the sagittal plane while rotating the
footplate. Foot reaction torque was measured by means
of a force transducer (Interface 1210AE-5000, resolution
<0.1N,positiveforplantarflexion torque). Angular
displacement of the footplate was measured by a poten-
tiometer at the footplate axis (Veccer S1998-1000 LB,
resolution < 0.01 deg., positive for dorsiflexion direc-
tion). The motor was operated to impose either torques
to assess ankle Range of Motion (RoM) or position for
the ramp-and-hold (RaH) measurements to the subject.
Muscle activation of the tibialis anterior (TA), gastro-
cnemius lateralis (GL), soleus (SL) and gastrocnemius
medialis (GM) was measured by electromyography
(EMG) using a Delsys Bagnoli 4 system. Inter electrode
distance was 10 mm. EMG signals were sampled at
2500 Hz, on-line band pass filtered (20-450 Hz) and off-
line rectified and integrated by low pass filtering (3
th
-
order Butterworth) at 20 Hz (IEMG). Reaction torque
and ankle angle were sampled at 250 Hz. Angular velo-
city and acceleration were derived by single and double
differentiation of the recorded angle signal respectively.
To avoid amplification of noise due to differentiation,
angle and force signals were low pass filtered at 20 Hz
(3
th
-order Butterworth).
Protocol
1. Clinical test
Measurements were performed on the affected ankle of
each patient and at the right ankle in case of controls.
de Vlugt et al. Journal of NeuroEngineering and Rehabilitation 2010, 7:35
/>Page 2 of 16
The Ashworth Score (AS) of the affected ankle [3] was
assessed by an experienced physician [HA]. In order to
avoid obtaining a biased and a study-specific Ashworth
test, the physician was instructed to perform the Ash-
worth test as he would perform as usual in the clinic.
Total time to perform the Ashworth test including posi-
tioning and instructing of the patient was about 5 min-
utes. The instrumented rotation measurements were
performed by an experimenter [KS] who was blind to
the clinical outcome. Judgment on the validity of the
model was solely based on the recorded signals (internal
validity). For the control group, only the instrumented
measurements were performed. All measurements were
completed within a single session of approximately one
hour.
2. Instrumented joint rotation
The ankle angle was defined as the position of the foot
with respect to the lower leg; the perpendicular position
was defined as zero degrees or central position. Maxi-
mum dorsiflexion angle was assessed by a monotonically
in- and decreasing dorsiflexion torque (100 s up, 100 s
down) imposed by the manipulator from zero to a maxi-
mum value of 15 Nm resulting in slow rotations of
approximately 0.5 deg/s. The angle before onset of the
dorsiflexion torque was taken as the maximal plantar
flexion angle. The angular e xcursion in plantar flexion
direction was limited to -30 degrees, which was the
maximal angle of the manipulator. RoM was defined as
the difference between the maximum dorsiflexion and
plantar flexion angle and used as boundary for the sub-
sequent RaH rotations. At 15 Nm the foot was approxi-
mately at a perpendicular angle with respect to the
horizontal for all subjects. C onsequently, the variability
in torque introduced by gravity around the maximal
dorsiflexion angles could be considered negligible and
thus there was no need to compensate for gravity during
these tests.
RaH rotations were performed by the manipulator
through the full RoM at four different durations of 0.25,
0.5, 1 a nd 2 s. As RoM differed between subjects while
durations were fixed, rotation velocities were different
Table 1 Patient demographics
ID Age Sex Lesion Post stroke
Time (months)
Ashworth
Score
Spasmolytic
medication
AFO/Cane
1 54 M Hemorrhage R 16 3 - -
2 78 M Ischemia L 9 1 Diclofenac -
3 61 M Ischemia L 7 0 - -
4 66 M Ischemia R 15 0 - -
5 82 M Ischemia R 9 1 - AFO
6 65 M Ischemia R 16 0 - -
7 53 M Hemorrhage L 13 3 - AFO
8 57 M Ischemia R 15 0 - -
9 59 M Ischemia L 12 2 - AFO/Cane
10 63 M Ischemia L 8 1 - -
11 54 M Hemorrhage R 10 0 - -
12 71 M Ischemia L 6 1 - -
13 70 M Hemorrhage R 11 1 - Cane
14 64 M Ischemia R 11 0 - Cane
15 56 M Ischemia R 8 1 - -
16 65 M Hemorrhage L 7 3 - -
17 51 M Ischemia L 12 0 - AFO/Cane
18 70 F Ischemia R 12 0 - -
19 69 M Ischemia L 13 1 - -
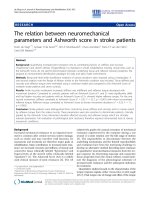
Figure 1 Measurement set-up. The subject’sanklewasfixatedon
the footplate that was rotated by an electrically powered single axis
actuator. Ankle reaction torque, ankle angle and EMG were
measured during imposed ramp-and-hold movements.
de Vlugt et al. Journal of NeuroEngineering and Rehabilitation 2010, 7:35
/>Page 3 of 16
between subjects. Prior to each RaH rotation, the ankle
was moved from central position to the maximal plantar
flexion angle in 2 s time. Subsequently, at a random
time instant but within 3 to 4 s, the RaH rotation was
started. In all cases, the RaH rotation ended at the maxi-
mal dorsiflexion angle. The hold phase lasted for 4 s
after which the ankle was moved back again to the cen-
tral position. Time to cover a complete movement pro-
file did not exceed 15 s. Rest periods of 30 s were
maintained between each movement profile which is
sufficient for full recovery of passive stiffness [15]. All
movement profiles were performed twice to test for
repeatability of the estimation procedure. Subjects were
asked to remain maximally relaxed during the entire
experiment and not actively resist any motions. Level of
relax ation was checked off-line from EMG activity of all
muscles prior to the RaH rotation. When IEMG was lar-
ger than three times standard deviation for longer than
1 s the observation was discarded from the analysis.
Neuromechanical model, parameter estimation and
internal validity
A neuromechanical computational model was used to
simulate the total generated ankle torque. The model
included a passive and an active muscle element, the lat-
ter being a Hill-type muscle model (see Appendix). The
Achilles tendon was assumed to be infinitely stiff (see
Discussion). The recorded ankle angle and IEMG signals
were input for the model. The model was fitted to the
total measured ankle torque defined within a time frame
starting from 0.5 s before ramp onset until 0.5 s after
the start of the hold phase. The model parameter s
where estimated for each single trial by minimizing t he
quadratic difference (error function) between the
recorded and simulated ankle torque. Parameter estima-
tion and analysis were performed in Matlab (The Math-
works Inc., Natick MA). In total ten model parameters
were estimated which are summarized in Table 2.
The covariance matrix P was derived to determine the
interdependence of the model parameters [16]:
P
N
JJee
TT
=⋅ ⋅ ⋅
−
1
1
()
where N is the number of time samples used for esti-
mation of the parameters, J the Jac obian matrix, and e
the 1 × N error vector. The Jacobian is a N × n
p
matrix,
with n
p
= 10 the number of estimated parameters, con-
taining first derivatives of the (final) error to each
parameter.
Two different type of indicators were derived from the
covariance matrix. The first is the interdependence of the
parameters for which the auto-covariance (diagonal
terms of P) of each parameter was compared to the
cross-covariance (off-diagonal terms of P)betweenthe
one parameter and all the others. If the auto-covariance
was higher than all cross-covariances, the corresponding
parameter was estimated/assumed independently and its
estimated value was assumed to be reliable. The second
measur e is the sensitivity of the parameters for which the
auto-covariance value on itself is representative. High
sensitivity means that the parameter has an observable
contribution in the system’s response (i.e. the ankle tor-
que in this study) and therefore can be estimated with
certain accuracy. The square root of the auto-covariance,
such as obtained from P in the above expression, is the
standard error of the mean (SEM) of the parameter esti-
mation [16]. For high sensitivity, the SEM needs to be
low compared to the corresponding parameter value.
For visual inspection, we have normalized the covar-
iance matrix by dividing each i,j-th element by
PP
ii j j,,
(i, j from 1 to n
p
) such that all diagonal terms equal to
one. SEM values were normalized to their corresponding
parameter values and subsequently averaged over all
trials and subjects.
Reproducibility of the parameter estimation was
assessed by taking the difference of the two parameter
values (one repetition) divided by their mean. Model
internal validity was assessed by calculating the Variance
Accounted For (VAF, “goodness of fit”) describing the
remaining difference aft er model optimization between
simulated and measured ankle torque:
VAF
T
meas
tT
mod
t
T
meas
t
=−
−
()
∑
∑
⎛
⎝
⎜
⎜
⎞
⎠
⎟
⎟
⋅1
2
2
100
() ()
()
%
with T
meas
(t) the measured ankle reaction torque and
T
mod
(t) the estimated ankle torque from the model (Eq.
A1, Appendix) over the time frame used for
parameterization.
As a measure of the amount of reflex activity, the root
mean square (r.m.s.) of the modeled reflex torque was cal-
culated over the time frame used for parameterization.
The r.m.s. reflex torque from the triceps surae was derived
from the corresponding reflex force ( Eq. A15, Appendix)
and moment arm (Eq. A5, Appendix) according to:
T
N
Fnr
reflex tri reflex tri achil,,
()=
()
∫
1
2
and similarly for the reflex torque of the tibialis ante-
rior, with n indicating the time sample of the identifica-
tion time frame [1 N]. The r.m.s. value is a common
way to denote the energy of a signal.
The model parameters were defined on the (metric
linea r) musc le level while for interpretation and analysis
of the results, viscosity and stiffness were expressed in
de Vlugt et al. Journal of NeuroEngineering and Rehabilitation 2010, 7:35
/>Page 4 of 16
the (angular) joint domain according to Eqs A10 and
A11 (Appendix). Viscosity and stiffness increase expo-
nentially with joint angle (muscle length). Because of
the exponential relationship, both viscosity and stiffness
couldonlybecomparedatthesamejointangle,θ
comp
,
for all subjects (controls a nd patients). θ
comp
was deter-
mined by the smallest maximal dorsiflexion angle
among st all subject s. Any differences in viscosity and/or
stiffness between subjects and patients was largest at
θ
comp
. Statistical testing of viscosity and stiffness at
smaller joint angles was therefore considered less mean-
ingful, hence not performed.
Statistical analysis
For statistical analysis, a disease gradation was defined,
ranging from healthy subjects to patients graded by AS.
Thus, within the tested population, four groups were
discerned, i.e. controls (C), a clinically unaffected patient
group: AS0; a mildly affected patient group: AS1; and a
severely affected patient group, i.e. the patients exhibit-
ing an AS of 2 and higher: AS2+.
To test the differences in RoM between patients graded
by AS and controls, a one way ANOVA was used with a
Bonferroni post hoc test. Movement duration and velo-
city were separately related with the RoM. As RoM dif-
fered between subjects, duration and velocity were not
interchangeable. Movement duration was standardized
and thus the factor duration (not velocity) was applied in
the analysis. To test the effects of movement duration
and disease gradation, a Linear Mixe d Model was used
with disease gradation as fixed and movement duration
as repeated factor. In case of significant effects of either
factor, a Bonferroni post hoc test was used to specify the
differences between the groups. Correlation between
relevant neuromechanical parameters and AS was
assessed using linear regression. All statistical testing was
performed using SPSS 16.0, SPSS Inc. at an alpha of 0.05.
Results
Both Controls and Patients could perform the tests. No
problems were observed with cognitive or language
deficits interfering with the comprehension of instruc-
tions required to participate in the study. A total of 10
trials from three healthy subjects were removed from
the analysis b ecause of sudden and large IEMG bursts
of all muscles before the on set of the RaH movements,
indicating insufficient relaxation.
Range of Motion (RoM)
RoM differed between groups (F = 10.7, p < 0.001), see
Figure 2. RoM was significantly smaller for the AS2+
group versus both the AS0 and control group and for
the AS1 versus both AS0 and control group. The smal-
lest maximum dorsiflexion angle amongst all subjects
was θ
comp
= 3.03 degrees and was used for comparison
of joint viscosity and stiffness between subjects.
All patients and controls reached to the maximal plan-
tarflexion angle of -30 degrees, which was the limit of
the manipulator. Consequently, all the observed loss in
RoM was accounted for by the reduced dorsiflexion.
To check for stretch induced muscle activity that
might have affected the R oM measurement, the mean
Table 2 Model parameters
Parameter Unit Description Initial Value Estimated Value
(mean ± 1 s.d.)
m kg mass (ankle + footplate) 2 1.86 ± 0.42
b Ns/m viscosity coefficient 5 1.28 ± 1.08
k 1/m stiffness coefficient 100 26.4 ± 15.4
x
0
m muscle length shift 0 -0.0081 ± 0.0023
F
0
N muscle force shift -25 -21.2 ± 9.6
e
1
,e
2
,
e
3
,e
4
N/Volts EMG weighting factors 10000 3.5 ± 1.05, 2.0 ± 0.96,
3.1 ± 0.77, 2.6 ± 1.1 (× 10
5
)
f Hz activation cutoff frequency 1.5 1.28 ± 0.34
Model parameters, initia l values used for estimation and estimated values (mean and standard deviation of all conditions and subjects).
CON AS0 AS1 AS2+
0
10
20
30
40
50
ROM [deg.]
Figure 2 Range of motion. Range of motion (RoM) of all subject
groups (mean and standard deviation). The asterisk denotes
significant difference (see Results).
de Vlugt et al. Journal of NeuroEngineering and Rehabilitation 2010, 7:35
/>Page 5 of 16
IEMG at zero torque (before dorsiflexion torque was
imposed) was compared to the mean IEMG at the maxi-
mal dorsiflexion torque. Mean IEMG was taken over a
1 s interval and was larger at 15 Nm than at zero torque
for almost all subjects. However, the increments were
small (0.5-1%) relative to the magnitude of the IEMG
responses observed during the RaH movements (see
further). Therefore, the small IEMG increment during
the RoM measurements were considered to have a neg-
ligible effect on the reported RoM values.
Torque response to ramp-and-hold movement
As an example, Figure 3 shows the imposed movement
for all four durations and the corresponding torque and
muscle activity (IEMG) of all muscles of a stroke patient
(AS3). Torque typically increased exponentially during
the ramp phase, rea ching to a peak value near the end of
the RaH movement. Peak torque increased with shorter
duration (higher velocity) of movement. When the
movement stopped at the dorsiflexion angle, the torque
decayed to a value that was independent on duration.
Amongst all muscles, the soleus showed the highest
activity in response to the imposed movements. Muscle
activity emerge d in brief bursts that increased in magni-
tude with shorter movement duration.
Figure 4 shows a detailed view of the recordings
(traces in grey) together with the model fits (traces in
black). The measured torque (Figure 4: C, D) exhibited
a brief inertial response at movement onset due to
initial acceleration (Figure 4: I, J). Visco us, stiffness,
inertia and gravitational torques are show n in Figure 4:
G-J. Stiffness torque was observed at movement onset,
increased rapidly during the ramp phase and sustained
during the holding phase. Viscous torque was small
compared to the stiffness torque (Figure 4: G, H). In
both stroke pati ents and controls, IEMG activity of the
triceps surae during the ramp phase was observed, gen-
erally consisting of one peak and occasionally followed
by additional peaks (Figure 4: E and Figure 5: I). Reflex
generat ed torque persisted for about 1 s due to the acti-
vation dynamics of the muscles (Figure 4: E, F). TA
activity occurred in some cases at random time
instances causing but a small dorsiflexion torque com-
pared to the plantar flexion torque as generated by the
triceps surae activity (Figure 4: E, F).
The composition of the net muscle activity from the
individual IEMG signals is presented in Figure 5 (same
subjects and conditions as in Figure 4; recordings in
grey and model estimates in black). TA activity was
absent.Forthestrokepatient,soleusactivityshowed
distinct bursts and dominated the net estimated activity
of the triceps surae. The estimated contribution of the
three calf muscles to the total estimated reflexive torque
(Figure 5 M), as obtain from the optimized weighting
factors (e
2,
e
3
and e
4
) was 3%, 91% and 6% for the GL,
SL and GM respectively . Comparable distribution o f
muscle torque amongst the triceps surae was found for
all other subjects and patients.
Model validity and parameter accuracy
The Variance Accounted For (VAF) was above 90% in
all cases, meaning that the observed ankle torque could
be well described by the model and the model structure
was a valid representation of the dynamics of the ankle
joint. The norma lized parameter covariance matrix for
all model parameters is visualized in Figure 6 (top). On
the average, the auto-covariance (diagonal) was larger
than the cross-covariance (off-diagonal) for all para-
meters, meaning that each parameter was estimated
independently from the others, i.e. the interdependence
was sufficiently low. The interdependence was expressed
as the percentage (number of times) the auto-covariance
was smaller than the corresponding cross-covariance
0 1 2 3 4 5
−30
0
30
2.0 s
Angle [deg.]
0 1 2 3 4 5
0
20
40
Torque [Nm]
0 1 2 3 4 5
1
2
3
x 10
−3
TA EMG [V]
0 1 2 3 4 5
1
2
3
x 10
−3
GL EMG [V]
0 1 2 3 4 5
1
2
3
4
5
x 10
−3
SL EMG [V]
0 1 2 3 4 5
1
2
3
4
5
x 10
−3
GM EMG [V]
Time [sec]
0 1 2 3 4 5
−30
0
30
1.0 s
0 1 2 3 4 5
0
20
40
0 1 2 3 4 5
1
2
3
x 10
−3
0 1 2 3 4 5
1
2
3
x 10
−3
0 1 2 3 4 5
1
2
3
4
5
x 10
−3
0 1 2 3 4 5
1
2
3
4
5
x 10
−3
0 1 2 3 4 5
−30
0
30
0.5 s
0 1 2 3 4 5
0
20
40
0 1 2 3 4 5
1
2
3
x 10
−3
0 1 2 3 4 5
1
2
3
x 10
−3
0 1 2 3 4 5
1
2
3
4
5
x 10
−3
0 1 2 3 4 5
1
2
3
4
5
x 10
−3
0 1 2 3 4 5
−30
0
30
0.25 s
0 1 2 3 4 5
0
20
40
0 1 2 3 4 5
1
2
3
x 10
−3
0 1 2 3 4 5
1
2
3
x 10
−3
0 1 2 3 4 5
1
2
3
4
5
x 10
−3
0 1 2 3 4 5
1
2
3
4
5
x 10
−3
Figure 3 Imposed ramp-and-hold movement profiles, joint
torque and IEMG. Rows from top to bottom: Ankle joint angle
showing the imposed (dorsiflexion) ramp-and-hold (RaH) joint
rotation profiles at four different movement durations (columns:
0.25, 0.5, 1.0, 2.0 s), corresponding joint torque responses and IEMG
signals from all four muscles. Traces are shown over a five second
time frame for an AS3 patient. Positive values indicate to
dorsiflexion.
de Vlugt et al. Journal of NeuroEngineering and Rehabilitation 2010, 7:35
/>Page 6 of 16
0 0.5 1 1.5
−40
0
40
Control
B
0 0.5 1 1.5
0
25
D
0 0.5 1 1.5
0
10
F
0 0.5 1 1.5
−5
0
5
10
15
H
0 0.5 1 1.5
0
5
J
Time [s]
0 0.5 1 1.5
−40
0
40
Angle [deg]
Patient
A
0 0.5 1 1.5
0
25
[Nm]
C
measured
model
0 0.5 1 1.5
0
10
[Nm]
E
tric. reflex
tib. reflex
0 0.5 1 1.5
−5
0
5
10
15
[Nm]
G
stiffness
viscous
0 0.5 1 1.5
0
5
[Nm]
Time [s]
I
inertial gravitational
Figure 4 Model fit. Typical model fits at 0.5 s dorsiflexion duration. Left column: patient (AS3). Right column: control subject. A-B: imposed
ankle movement; C-D: measured joint torque (grey) and torque as predicted from the model (black); E-F: reflex torque from triceps surae and
tibialis anterior muscles; G-H; torque due to stiffness (solid) and viscosity (dashed); I-J: inertial (solid) and gravitational torque (dashed).
de Vlugt et al. Journal of NeuroEngineering and Rehabilitation 2010, 7:35
/>Page 7 of 16
values (Figure 6, next to each row at the right). For the
mass, damping and stiffness parameters (upper four
rows), the interdependence was smaller than 20%. The
IEMG weighting factors showed even smaller interde-
pendence (< 2%), with an exception for the TA weight-
ing (31%). Interdependence of the activation cutoff
frequency was highest (35%).
On the average, the SEM was less than 10% except for
the IEMG weighting factors (Figure 6, bottom). The
weighting factors of both gastrocnemii (e
2
and e
4
)were
least sensitive.
Intertrial difference was less than 20% on average for
all parameters, with exceptions for the IEMG weighting
factors which showed larger differences (Figure 7). Visc-
osity and stiffness coefficients became smaller (positive
difference) for the repeated measurements although only
significant for the stiffness coefficient. Muscle length
shift and force shift coefficients were larger (i.e. less
negative values for the length shift parameter) with
I
6 %
Parameter Covariance [normalized]
b
8 %
k
13 %
x
0
19 %
e
1
31 %
e
2
2 %
e
3
1 %
e
4
0 %
f
35 %
0
1
F
0
26 %
Ibk
x
0
e
1
e
2
e
3
e
4
f
F
0
0
10
20
30
40
50
Ibk
x
0
e
1
e
2
e
3
e
4
f
F
0
SEM [% of mean parameter value]
Figure 6 Parameter covariance. Covariance matrix P (top) and
SEM values (bottom) of all estimated model parameters. Only the
upper part of P is shown because of its symmetry. For
normalization, see Method Section. Averages over all conditions and
subjects (solid bars) ± 1 s.d. (grey error bars). The auto-covariance is
on the diagonal of P. The off-diagonal terms of P are the relative
cross-covariances between two different corresponding parameters.
Percentages at the right are measures of interdependence, i.e. the
number of times the auto-covariance was smaller than any of the
corresponding cross-covariance values. The SEM is equal to the
square root of the auto-covariance, divided by the corresponding
mean parameter value.
0 0.5 1 1.5
0
1250
F
0 0.5 1 1.5
0
1250
N
Time [s]
0 0.5 1 1.5
−40
0
40
Control
B
0 0.5 1 1.5
0
3
x 10
−3
D
0 0.5 1 1.5
0
3
x 10
−3
H
0 0.5 1 1.5
0
3
x 10
−3
J
0 0.5 1 1.5
0
3
x 10
−3
L
0 0.5 1 1.5
0
1250
ESTIM. TA
E
0 0.5 1 1.5
0
1250
ESTIM. TRICEPS
M
Time [s]
0 0.5 1 1.5
−40
0
40
Angle [deg]
Patient
A
0 0.5 1 1.5
0
3
x 10
−3
IEMG TA [V]
C
0 0.5 1 1.5
0
3
x 10
−3
IEMG GL [V]
G
0 0.5 1 1.5
0
3
x 10
−3
IEMG SL [V]
I
0 0.5 1 1.5
0
3
x 10
−3
IEMG GM [V]
K
Figure 5 Estimated IEMG activity. Same patient (left column) and
control subject (right column) and conditions as in Figure 4. Traces
in grey are the IEMG signals from all muscles (C-D and G-L). The
black traces (E-F and M-N) are the estimated (synthesized) muscle
activity of the TA and triceps surae (sum of GL, SL and GM)
respectively. The estimated signals were obtained from
multiplication of the IEMG signals with the optimized weighting
factors (e
1
-e
4
) and served as inputs to the muscle activation filters to
produce the reflexive torque such as shown in Figure 4 (E-F).
−100
−50
0
50
100
Ibk
x
0
e
1
e
2
e
3
e
4
f
F
0
% of mean value
Intertrial Difference
Figure 7 Intertrial difference. Intertrial parameter difference (solid
bars: mean; error bars ± 1 s.d.) relative to the mean value of both
measurements (one repetition), and then averaged over all
conditions and subjects and for all parameters (horizontal axis).
Asterisk denotes statistical difference from zero value.
de Vlugt et al. Journal of NeuroEngineering and Rehabilitation 2010, 7:35
/>Page 8 of 16
repetition. Intertrial difference for the mass a nd activa-
tion cutoff frequency were smallest (< 5%).
Estimated mass (1.86 ± 0.42 kg), muscle length shift
(-0.0081 ± 0.0023 m), muscle force shift (-21.2 ± 9.6 N)
and activation cut-off frequency (1.28 ± 0.34 Hz) did
not change significantly with movement duration and
also were not different between the patients and the
control group. Viscosity and stiffness coefficients and
reflex torque markedly differed as descr ibed in the fol-
lowing sections. Table 2 summarizes the initial and
averaged (optimal) estimated values of all model
parameters.
Influence of movement duration
Viscosity significantly increased with movement dura-
tion (F = 10.5, p < 0.0001). However, post hoc testing
revealed that only for the 2sdurationviscositywas
significantly larger (Figure 8, top). Reflexive torque
(r.m.s) from the triceps surae (Figure 9, top) signifi-
cantly decreased with movement duration (F = 56.3,
p < 0.001). Stiffness was not affected by movement
duration (Figure 8, bottom).
Difference between patients and controls
Ankle viscosity (F = 20.2, p < 0.0001), stiffness (F =
19.5, p < 0.0001) and reflexive torque of the triceps
surae (F = 5.8, p = 0.003) differed with disease grade.
Post hoc testing revealed that for ankle viscosity and
stiffness, control subjects could be discerned from
stroke patients with an AS of 1 and higher; for reflexive
torque, controls differ ed significantly from patients with
an AS2+.
Interaction of disease grade and test condition
Reflexive torque of the triceps surae decreased with
duration and this effect was stronger for patients with
higher AS (Figure 9, top, interaction term F = 2.91, p =
0.013). At the 1 s movement duration, stiffness signifi-
cantly related to AS (r
2
= 0.51, F = 32.7, p < 0.001)
while reflex torque did not (r
2
= 0.09, F = 3.22, p =
0.08). At shorter durations, reflex torque significantly
related to disease grade (r
2
= 0.25, F = 11, p = 0.002 ).
0 5 10 15 20 25 30
0
1
2
3
4
5
Ankle Joint Viscosity
[Nms/rad]
0.25 0.5 1.0 2.0
0
20
40
60
80
c012+
Ankle Joint Stiffness
[Nm/rad]
Movement Duration [s]
Figure 8 Ankle Joint Viscosity and Stiffness. Viscosity (top) and
stiffness (bottom) for all subject groups against dorsiflexion
duration. Subject groups (C, AS0, AS1, AS2+) from left to right for
each cluster, denoted by c, 0, 1 and 2+ respectively. Joint viscosity
and stiffness were taken at the same ankle angle for all subjects
(controls and patients) being 3.03 degrees dorsiflexion (see
Methods).
0 5 10 15 20 25 30
−2
0
2
4
6
8
10
Reflexive Torque (Triceps Surae)
[Nm]
0.25 0.5 1.0 2.0
−2
0
2
4
6
8
10
Reflexive Torque (Tibialis)
[Nm]
c012+
Movement Duration [s]
Figure 9 Reflexive torque. Stretch reflex torque (r.m.s.) for all
subject groups against movement duration for triceps surae (top)
and tibialis anterior (botttom) muscles. Subject groups (C, AS0, AS1,
AS2+) from left to right for each cluster, denoted by c, 0, 1 and
2+ respectively.
de Vlugt et al. Journal of NeuroEngineering and Rehabilitation 2010, 7:35
/>Page 9 of 16
Reflex torque from tibialis anterior did not relate to
movement duration nor to AS.
Discussion
Theoverallaimofthisstudywastoestimateneuro-
mechanical parameters at the ankle joint in stroke
patients during ramp-and-hold (RaH) rota tions with
different duration using a nonlinear dynamic ankle
model. The experiments included the Ashworth test
condition: a typical 1 s rotation over the full range of
motion, which is clinically used to judge joint resis-
tance in spasticity.
Influence of movement duration on neuromuscular
properties
Stretch reflex torque from the triceps surae showed a
marked threshold in the movement duration in between
0.5 - 1.0 s, above which there was no substantial reflex
response observed (Figure 9, top). The increase of
reflexive torque from the triceps sur ae with movement
duration beyond the threshold was expected for it is
consistent with the well known velocity depend ence of
the stretch reflex [17].
The only other parameter that w as influenced by
movement duration, albeit slightly, was joint viscosity
(Figure 8, top). The slower the jo int was rotated the lar-
ger its viscosity (velocity to force relation). The
increased viscosity was significant only for the longest
(2 s) duration indicating to a nonlinear relationship.
Difference between controls and patients
Stiffness, viscosity and reflexive torque from the triceps
surae significantly differed between controls and the
stroke patients with an AS of one and higher. Increased
stiffness was not s ignificantly higher for patients with
AS0 compared to controls, indicating small differences
with a statistical problem of power.
Although subjects were instructed to relax and not
react to the RaH movements, stroke patients may have
exhibited an increased ankle torque due to a possible
higher background activity of the muscles at rest, as was
reported by [18]. Also, an increa se in stiffness from
within the interior of the muscle cell was found in spas-
tic muscle tissue and which is believed to originate from
altered strain properties of intracellular proteins like
titin [19,20]. We assumed that the increased stiffness in
the stroke patients as found in this study was mainly
from intracellular tissues since the observed stiffness
behavior was well described by an exponential force-
length relationship (Eq. A9) that is typical for passive
tissues [13,21-23]. Increasedstiffnessatjointpositions
beyond the ‘relaxed’ position is believed to underlie con-
tractures (muscle shortening) as observed in spastic
patients [19,20].
Disease severity is expressed by tissue stiffness in stroke
Intr insic ankle stiffness was responsible for the increased
AS in stroke patients. This means that joint resistance, as
was indicated by the AS, is accounted for by the physical
property ‘stiffness’, which is most likely originating from
passive tissues. For the extent that AS provides a measure
of disease severity, a t least for the changes within the
mechanical condition of the joint secondary to the neural
disorder, we now may state that stiffness of the passive
tissues increases with disease severity in stroke.
Ashworth Scale does not comprises the stretch reflex
response
Mechanical joint resistance is never determined by pas-
sive stiffness only, since reflexive torque was present
during all applied RaH movements. However, for the
two longest movement durations lasting 1 s, i.e. the
Ashworth test duration, and 2sthereflexivecontribu-
tions were small. At shorter movement durations of
0.5 s and 0.25 s, the reflex torque from the triceps surae
increased with AS.
Ashworth test versus instrumented ramp-and-hold
movements
It is important to realize that the manual performance
of the Ashworth test may differ from the instrumented
ramp-and-hold movements as applied in the present
study. The instrumented conditions were of a constant
velocity (ramp phase) whereas imposed manual manipu-
lations may result in a bell-shaped velocity profile [24].
Therefore, the instrumented tests in this study are to be
considered as separate tests next to the Ashworth test.
Direct comparison to the Ashworth test must be taken
with some care, but only for those properties that
appeared to be dependent on movement velocity being
joint viscosity and the stretch reflex torque, as was dis-
cussed above.
For the sake of direct comparison to the AS, move-
ment duration was chosen to be the independent con-
trolled variable, but resulted in different velocities
between patients and controls. Thus, a structural bias
with higher Controls velocities (because of increase
RoM) was included in the inter-subject analysis of visc-
osity and triceps surae reflex torque. If velocity was con-
trolled for, viscosity would likely exhibit less differences
between controls and patients and less interaction with
disease grade (AS). For the triceps surae reflex torque,
the opposite would occur: differences between controls
and patients, and in between AS groups, would be larger
if velocity was controlled for. Although viscous torques
have a marginal contribution to the overall joint torque
in comparison to the stiffness and reflex torques, the
bias problem requires the inter-subjective significance of
(only) the tissue viscosity to be taken with care.
de Vlugt et al. Journal of NeuroEngineering and Rehabilitation 2010, 7:35
/>Page 10 of 16
However, discrepancy between the description of the
Ashworth test and the actual manual performance
underlines the necessity of applying controlled test con-
ditions to obtain reliable and valid outcome parameters.
Validity of the method
The full model consisted of 10 parameters that were
estimated reliably as indicated by the low interdepen-
dence values (Figure 6, top). For all but the IEMG
weighting factors, the sensitivity was high (low SEM
values). The combination of low interdependence and
high sensitivity indicates that these parameters were
estimated reliably and accurately.
Both viscosity and stiffness coefficients decreased 17%
and 12% on average respectively with repetition. This
decrease in passive joint visco-elasticity with ongoing
loading was previous ly reported in both the normal and
spastic case, e.g. [23,25,26]. Also, the length shift para-
meter was 9% larger with repetition which means that
the ankle joint angle beyond which the visco-elastic tor-
que started to increase shifted to dorsiflexion, which is
probably related to the decrease in visco-elasticity.
The force shift coefficient (F
0
)hadinfluenceonall
parameters (last column of the covar iance matrix).
Based on the small interdependence amongst most
other parameters, it follows that the estimation of F
0
was influenced by the other parameters to some extent.
The prime role of F
0
was to shift the exponential force-
length characteristic to have more flexibility in describ-
ing the ankle stiffness but perhaps it was also used to
account for small model remnants.
The IEMG weighting factors, in particular these for
the gastrocnemii muscles, were least sensitive while
their interdependence was exceptionally small. This
means that the contributions of the ga strocnemii could
be estimated independently but their estimated contri-
butions to reflexive torque were far less compared to
the soleus muscle. The intertrial difference for the
soleus was smallest (12 ± 20%) which confirmed its
dominant contribution to triceps surae reflex torque
compared to the gastrocnemii muscles.
Because the gain (participation) of each EMG channel
was also estimated, the method was free to select which
muscles contributed and to what extent. Any c ross-talk
between agonists (soleus and both gastrocnemii) was
therefore of no problem. Cross-talk between antagonis-
tic muscles may have disturbed the selection between
muscles. However, it has been shown that there is 5%
cross-talk from the tibialis to the soleus at most and
under supra maximal stimulation [27]. It was not likely
that supra maximal activation occurred during our
experiment so any effect of cross-talk was most likely
very small.
In our model, the Achilles and tibialis tendons were
taken as infinitely stiff. Over all subjects and patients
plantarflexi on torque never exceeded 30 Nm. In normal
subjects maximal voluntary contraction (MVC) produces
about 150-225 Nm (female-male ) of plantarflexion tor-
que at 10 degrees dorsiflexion [28]. Thus, plantarflexion
torque was in the range of 13-20% MVC of normal,
resulting in a maximal tendon elongation of 0.4-0.6 cm
respectively [29]. The total muscle-tendon length change
followed direct ly from the ankle angle and moment arm
and varied in the range of 3.5-4.7 cm, which means that
17% of the muscle-tendon length change would be from
the Achilles tendon at most. As the consequence of
omission of the Achilles tendon in our model, joint stiff-
ness and viscosity values may be slight ly underestimated
sinceweassumedoneelementinsteadoftwoelements
in series. An infinitely stiff Achilles tendon has also
bee n ass umed in previous studies that estimat ed neuro-
mechanical properties of the elbow and ankle joint
[8,9,14,30].
Overall model validity is illustrated by high “goodness
of fit” (VAF) values that were above 90% for all move-
ment conditions tested. Together with the low interac-
tion between the parameters and high sensitivity of the
model parameters we therefore may conclude that the
underlying neuromechanical behavior of the ankle joint
waswellquantifiedbythemodelforallconditions
tested.
Comparison to the literature
Increased stiffness was also observed in a comparable
study [8] in the p aretic limb of stroke patients, but
which did not increase with AS. In that particular study,
continuous (> 30 s) small amplitude joint rotations (1.5
degrees) were applied at high speeds. Since the joint sys-
tem (as any biological system) is highly nonlinear [13,31]
and varies as a function of time, long lasting small
amplitude behavior cannot be generalized or extrapo-
lated to brief (< 2 s) large amplitude behavior (> 15
degrees) as used in an Ashworth test and appl ied in the
current study.
Anklejointviscosityhadameanvalueof0.69Nms/
rad and 1.14 Nms/rad for the cont rol and patient group
respectively, which are in the same ranges as found pre-
viously by [14]. Mean ankle joint stiffness was 14 Nm/
rad for the control group and 31 Nm/rad for the stroke
patients, which are both a factor 3 to 4 lower than
found by [14] and for the controller group a factor 3
lower than found by [13]. The discrepancy can be
explained from the usage of much smaller displacements
(several degrees) in [13,14] as passive joint stiffness
strongly increases with decreasing amplitude of displace-
ment [13,31].
de Vlugt et al. Journal of NeuroEngineering and Rehabilitation 2010, 7:35
/>Page 11 of 16
The mean estimated mass was 1.86 kg and modeled as
a point mass at a fixed distance of 0.15 m from the rota-
tion center of the ankle joint, i.e. the inertia was 0.042
Nms
2
/rad. The inertia of the footplate was 0.032 Nms
2
/
rad such that the mean foot inertia was 0.010 Nms
2
/rad,
which is only slightly higher than the range of 0.007-
0.009 Nms
2
/rad as previously reported [32,33].
In previous studies, reflex contrib utions to ankle tor-
que were estimated by quantification of pa rameters
from a feedback model representing the functioning of
the muscle spindles and Golgi tendon organs [8,14,34].
However, the inputs to proprioceptive sensors such as
length (velocity) and force of the muscle fibers cannot
be measured during movement experiments accurately
to date. This study directly estimates reflex torque from
measured muscle activity (IEMG) and therewith no
assumptions about the function ing of the proprioceptive
sensors were required, allowi ng for direct estima tions of
the net reflex torque.
Ankle stretch reflexes in stroke patients were pre-
viously found above angular velocities of 80 deg/s [29],
which is comparable to the RaH rotations of 0.5 s dura-
tion (≈ 40 deg. ROM in 0.5 s) in this study. Rotation
velocity during the Ashworth test, performed as a 1 s
full RoM movement [3], is therefore assumed to be sub-
threshold not evoking stretch reflexes.
Themusclelengthshiftparameterx
0
was used for
shifting the exponential stiffness function with muscle
length and can be interpreted as the muscle length at
which the passive elastic force starts to increase s ub-
stantially. The shift was -8.1·10
-3
monaverage.In[13],
theankleangleatwhichpassive plantarflexion torque
started to increase rapidly was approximately 0.4 rad
plantarflexion (-23 deg). F or our model, the angle at
which the passive stiffness torque started to increase
was for that muscle length x where the exponential
power term x-x
0
(Eq.A8)waszero,thatisforx =
-x
0
=8.1·10
-3
m. From Eqs. A4 and A5 it follows that
this value for x corresponded to an angle of -0.43 rad,
which is close to the referred value above. The shift
parameter can be interpreted as a physiological mean-
ingful parameter describing the passive elasticity prop-
erty of the triceps surae and was not different for the
stroke patients compared to the controls. Apparently,
the increase in pas sive tissue stiffness in the stroke
patients was fully described by the (increased) curvature
parameter k of the stiffness force-length relationship
(Eq. A8).
Cut-off frequencies of second order models describing
muscle activation dynamics have been reported in sev-
eral previous studies. Most o f these studies found values
ranging from 1 to 3.3 Hz. In [14] maximal values
around 7 Hz were found for the ankle triceps, which
seems too high to our opinion. The mean value of
1.28 Hz as reported in our study is within the range of
1.0 - 1.4 Hz as found by [35] and somewhat lower than
the cut-off frequencies found for the trunk (2.0 -
3.3 Hz) [36] and for elbow muscles (1.9 - 2.8 Hz) [37],
likely because the soleus muscle is composed largely of
slow twitch muscle fibers.
Muscle activity in response to the imposed (fastest)
movements was observed as distinctive bursts (Figure 5:
I)andweremorepronouncedforthestrokepatients
(not shown). Similar bursts of activity during compar-
able joint movements were reported by others
[23,38,39]. Likely, the motoneurons in stroke patients
tend to fire in a more synchronized way in response to
afferent input from the stretch receptors that may be
the result of decreased motoneuron thresholds [40] or
increased sensitivity of afferent inputs [41].
In [42], a similar nonlinear relationship was found for
the ankle in SCI pa tients with largest increase in viscos-
ity below 20 deg./s, which is in the same range as the
velocities during the 2 s movements (~ 40 deg.) in the
current study. Viscous behavior of connective tissues
(intra and extra muscular) [43] and a possible small
amount of actin-myosin cross-bridges in the resting
muscle [44] may have contributed to the velocity depen-
dent behavior. The relationship between movement
velocity and joint viscosity remains to be solved and
may be important for understanding energy dissipation
in functional tasks, e.g. during walking.
Clinical implications
The current findings that joint viscosity and reflex tor-
que depended on the duration, and thus the velocity of
movement, implicate t hat for unambiguous assessment
of joint resistance the Ashworth test should be per-
formed in a strictly standardized way, actually according
toaprescribedvelocityinsteadofa1smovement.
However, stretch velocity is difficult to standardize in
manual testing. Instrumented evaluation comprising
extended experimental conditions in combination with
nonlinear computational modeling may prove to be a
powerful tool to evaluate joint function.
Instrumented tests, like the one applied here, facilitate
assessment of quantitative and objective ranges of neu-
romechanical properties correlating to disorder severity
and may guide the clinician in optimal treatment plan-
ning e.g. choosing a stiffness reducing strategy instead
of reducing reflex activity.
Limitations
Functional evaluation, e.g. during walking, is compulsory
for treatment guidance which can not be extrapolated
from passive movements as studied here. We prepare
for a larger study to compare neuromuscular prop erties
as measured during static (sitting) and dynamic
de Vlugt et al. Journal of NeuroEngineering and Rehabilitation 2010, 7:35
/>Page 12 of 16
(walking) conditions to determine to what extent static
measures can be used to predict functional improve-
ment during dynamic conditions.
Future research
Contribution to joint stiffness and viscosity from any
muscle background activity could not be explicitly sepa-
rated by the current model. That is, all angular velocity
andanglerelatedintrinsictorqueswherelumped
together into a viscous and a stiffness torque component
respectively. A further division between passive visco-
elastic torque and torque emerging from (constant)
muscle activation is planned for future studies. To
determine its clinical value, we plan to apply the current
method to a larger cohort of patients to study the effect
of different interventions on neuromuscular properties
of the ankle joint.
Conclusion
This study demonstrated a new measurement techni-
que for quantification of neuromechanical parameters
of the individual ankle joint from a single do rsiflexion
movement. Tissue and reflex torque were most sensi-
tive parameters to discrimi nate stroke patients from
healthy control subjects and also “ grade” patients.
Stroke patients exhibited increased ankle stiffness and
viscosity with AS. For movement durations shorter
than 1 s stroke patients also showed increased reflex
torque with AS. Joint resistance observed during the 1
s movement over its RoM originated mainly from
increased tissue stiffness. Correlations of relevant para-
meters to AS were assessed on group level and the
relatively high standard deviations illustrate the diffi-
culty experienced in discrimination between AS grades
in the clinical practice.
The developed model fully covered the observed neu-
romechanical behavior of the ankle joint. It provides a
basis for further dividing the visco-elasticity into contri-
butions fro m connect ive and (active) musc le tissue, and
thereflextorqueintocontributions from muscle spin-
dles and Golgi tendon organs. The present study was
primarily aimed at development of the method. Inclu-
sion of larger and more divergent patient groups will
demonstrate whether clinical phenotypes can be identi-
fied in (combinations of) abnormal system properties,
such as enhanced stiffness and reflex torque. This may
then be the foundation for therapy guidance, e.g. splint-
ing, casting or surgery versus botulinum toxin. Estab-
lishing the sensitivi ty to interventions is a first step
towards therapy evaluation.
We conclude that the combination of instrumented
evaluation including multiple experimental conditions
and nonlinear computational modeling is a powerful
tool to quantitatively assess joint resistance. Objective
and high resolution identification of neuromuscular
parameters will be of use in daily clinical practice.
Appendix 1: Neuromuscular model
Ankle joint resistance is described by:
TtItTtTtT
mod tri tib grav
() () () () ( )=+ − +
(A1)
where t is the independent time variable [s], T
mod
the
modeled ankle reaction torque [Nm],
()t
the ankle
angular acceleration [rad/s
2
], I the inertia of ankle plus
footplate [kg.m
2
], T
tri
the torque generated by the
plantar flexion muscles (GL, SL, GM), or triceps surae
[Nm], T
tib
the torque generated by the dorsiflexion
muscle (TA) [Nm], and T
grav
the torque due to gravity
[Nm].
Although the TA was not substantially stretched dur-
ing the ramp phases in the current experiment there
was considerable reflex activity during some RaH move-
ments. For these reasons, viscosity and stiffness were
modeled for the plantar flexor muscles only and reflex-
ive force was included for both plantar and dorsiflexion
muscles.
Muscle torques were described by:
Tt F xxF x F tr
tri visc stiff reflex tri achil
() ( , ( ) () ( )
,
=++
()
(A2)
Tt F tr
tib reflex tib tib
() () ( )
,
=
(A3)
where x is the (change) of muscle length (linear dis-
placement) [m],
x
therateofchangeofmusclelength
[m/s], F
visc
the velocity related muscle force from tissue
viscosity [Ns/m], F
stiff
the length related muscle force
from tissue stiffness [N/m], F
reflex,tri
and F
reflex, tib
the
reflexive muscle forces from the triceps surae and TA
respectively [N], and r
achil
(θ) and r
tib
(θ) the angle depen-
dent moment arm [m] of the Achilles tendon and tibia-
lis anterior tendon respectively.
Triceps surae muscle length change was obtained
from its moment arm:
xr
tri achil
= ()tan()
(A4)
Positive values for θ [rad] denote dorsiflexion direc-
tion, and thus positive values for x denote lengthening
of the triceps surae. Achilles tendon moment arm (r
achil
)
was assumed to scale linearly with joint angle, as derived
from [45], according to:
achil() ( . .). [ ]
=−
−
5 1 91 10
2
m
(A5)
de Vlugt et al. Journal of NeuroEngineering and Rehabilitation 2010, 7:35
/>Page 13 of 16
The moment arm of the tibialis anterior tendon was
described by [46]:
r
tib
() (. . ). [ ]
=+
−
3 75 2 84 10
2
m
(A6)
Inertia of ankle plus footplate was modeled as a point
mass m [kg] at distance l
a
(fixed at 0.15 m) from the
center of rotation, i.e.
Iml
a
=
2
[kg.m
2
]. Torque due to
gravity equals:
Tmgl
grav a fgnd
=−cos( )
(A7)
where θ
fgnd
represents the angle of the foot with
respect to the horizontal (ground) at zero degrees ankle
angle [rad]. Here, θ
fgnd
equals to the angle the point
mass had (around the ankle rotation axis) with the hori-
zontal in central position and which was fixed at 10
degrees, and g is the gravitational acceleration (g =
9.8 m/s
2
).
The viscous and stiffness components were modeled
as follows:
Fte xtb
visc
kxt x
() ()
(() )
=
−
0
(A8)
Fte F
stiff
kxt x
()
(() )
=+
−
0
0
(A9)
Force due to stiffness (Eq. A9) exponentially increases
with ankle angle correspo nding to the length tension
properties of ligamentous, tendinous and muscular elastic
tissues [12,23,47-49]. Increased tissue stiffness, as often
seen in spasticity [20], can be described by Eq. A9 as a
steeper (or shifted) force-length relationship. We assume
viscous forc es of tissues along the ankle joint to relate to
compression (shear forces), which increase with tens ion.
Therefore, both viscous and stiffness force scale with posi-
tion (Eq. A8, A9). Exponential increase in viscous force
with joint angle was also derived from [23]. The exponen-
tial curvature is shaped by k [1/m], called the stiffness
coefficient, while the amount of viscosity is obtained by
multiplication the same curvature with the viscosity coeffi-
cient b [Ns/m]. Two shift parameters are inclu ded in Eqs
A8 and A9 such that the viscous an d stiffness forces can
be shifted in two dimensions, that is, in length by x
0
and
in force by F
0
. The muscle length beyond which the force
starts to increase exponentially is determined by the shift
parameter x
0
, a known property of passive mu scle stiff-
ness. The offset force term, F
0
, served purely as a shaping
parameter for the stiffness model.
For comparison, joint viscosity, B
joint
, and join t stiff-
ness, K
joint
, were taken at an angle that was the same for
all subjects (θ
comp
) and equal to the smallest dorsiflexion
angle amongst all subjects (see also Methods):
B
dT
stiff
d
dF
stiff
r
comp
dx r
comp
e
joint
kx x
comp
== =
−
()
/( )
()
0
bbr
achill comp
2
()
(A10)
K
dT
stiff
d
dF
stiff
r
comp
dx r
comp
ke r
joint
kx x
comp
== =
−
()
/( )
()
0
aachill comp
2
()
(A11)
where x
comp
thetricepssuraemusclelengthcorre-
sponding to θ
comp
.
Neural muscle activity for both tibialis and triceps
surae due to stretch reflexes was estimated from corre-
sponding IEMG signals according to:
ut eIEMGt
tib TA
() ()=
1
(A12)
u t e IEMG t e IEMG t e IEMG t
tri GL SL GM
() () () ()=++
234
(A13)
where u
tib
and u
tri
theneuralactivityforthetibialis
and triceps surae respectivly, e
1
- e
4
are weighting f ac-
tors [N/Volts], numerical subscripts (1 - 4) correspond
to the IEMG signals of the four muscles as referred to
by subscripts TA, GL, SL and GM respectively.
The neural activity is then passed through a linear
secondorderfilter(equalforbothmusclegroups)
describing the muscle activation process to produce the
active state of the muscle [35,50]:
tri tri
s
ss
us() ()=
++
0
2
2
2
0
0
2
(A14)
and similarly for the tibialis anterior, where a
tri
the
active state of the triceps surae, ω
0
= 2π f
0
the cutoff
frequency of the activation filter, and s the Laplace
operator denoting the first time derivative. The relative
damping b was set to one (critically damped) [35].
A Hill-type muscle model was used to compute the
muscle force from the active state and the muscle length
and velocity according to:
Ffvfl
reflex tri v tri tri tri,
()()=
(A15)
and similarly for the tibialis anterior. For a full
description of t he structure and the parameters of the
force-velocity and force-length relationships of the
model (Eq. A15) we refer to [47]. The most important
parameter values were: optimum muscle length triceps
surae(tibialis)3.5(4.6)cmoccurringatcentralankle
angle; maximum shortening velocity 8 (8) times opti-
mum muscle length; maximum eccentric force was 1.5
(1.5) times the isometric force, and the isometric force
was normalized to 1 since scaling of force was fully
determined by the weighting factors e
1
-e
4
.
de Vlugt et al. Journal of NeuroEngineering and Rehabilitation 2010, 7:35
/>Page 14 of 16
Acknowledgements
This study was performed as part of the Dutch TREND project (Trauma
RElated Neuronal Dysfunction), supported by the Dutch Government (grant
nr. BSIK03016).
Author details
1
Department of Biomechanical Engineering, Faculty of Mechanical
Engineering, Delft University of Technology, Mekelweg 2, 2628 CD, Delft, The
Netherlands.
2
Department of Rehabilitation Medicine, Leiden University
Medical Center, Albinusdreef 2, 2333 AL, Leiden, The Netherlands.
3
Laboratory for Kinematics and Neuromechanics, Departments of
Rehabilitation Medicine and Orthopaedics, Leiden University Medical Center,
Albinusdreef 2, 2333 AL, Leiden, The Netherlands.
Authors’ contributions
EV designed the experiment, wrote the processing software, developed the
mathematical models and wrote the manuscript. JG co-designed the
experiment, assisted in the data processing and interpretation and writing of
the manuscript. KS conducted the experiments and recruited the patients.
HA took part in discussions on the outcome and critically reviewed the
manuscript. FH took part in discussions on the outcome. CGM co-designed
the experiment, assisted in the processing and interpretation of data and
critically reviewed the manuscript. All authors read and approved the final
manuscript.
Competing interests
The authors declare that they have no competing interests.
Received: 16 November 2009 Accepted: 27 July 2010
Published: 27 July 2010
References
1. Katz RT, Rymer WZ: Spastic hypertonia: mechanisms and measurement.
Arch Phys Med Rehabil 1989, 70:144-155.
2. Damiano DL, Quinlivan JM, Owen BF, Payne P, Nelson KC, Abel MF: What
does the Ashworth scale really measure and are instrumented measures
more valid and precise? Dev Med Child Neurol 2002, 44:112-118.
3. Ashworth B: Preliminary Trial of Carisoprodol in Multiple Sclerosis.
Practitioner 1964, 192 :540-542.
4. Pandyan AD, Johnson GR, Price CI, Curless RH, Barnes MP, Rodgers H: A
review of the properties and limitations of the Ashworth and modified
Ashworth Scales as measures of spasticity. Clin Rehabil 1999, 13:373-383.
5. Pandyan AD, Price CI, Barnes MP, Johnson GR: A biomechanical
investigation into the validity of the modified Ashworth Scale as a
measure of elbow spasticity. Clin Rehabil 2003, 17:290-293.
6. Starsky AJ, Sangani SG, McGuire JR, Logan B, Schmit BD: Reliability of
biomechanical spasticity measurements at the elbow of people
poststroke. Arch Phys Med Rehabil 2005, 86:1648-1654.
7. Chung SG, van Rey E, Bai Z, Rymer WZ, Roth EJ, Zhang LQ: Separate
quantification of reflex and nonreflex components of spastic hypertonia
in chronic hemiparesis. Arch Phys Med Rehabil 2008, 89:700-710.
8. Alibiglou L, Rymer WZ, Harvey RL, Mirbagheri MM: The relation between
Ashworth scores and neuromechanical measurements of spasticity
following stroke. J Neuroeng Rehabil 2008, 5:18.
9. McCrea PH, Eng JJ, Hodgson AJ: Linear spring-damper model of the
hypertonic elbow: reliability and validity. J Neurosci Methods 2003,
128:121-128.
10. de Vlugt E, Schouten AC, van der Helm FC: Adaptation of reflexive
feedback during arm posture to different environments. Biol Cybern 2002,
87:10-26.
11. van der Helm FC, Schouten AC, de Vlugt E, Brouwn GG: Identification of
intrinsic and reflexive components of human arm dynamics during
postural control. J Neurosci Methods 2002, 119:1-14.
12. Harlaar J, Becher JG, Snijders CJ, Lankhorst GJ: Passive stiffness
characteristics of ankle plantar flexors in hemiplegia. Clin Biomech (Bristol,
Avon) 2000, 15:261-270.
13. Weiss PL, Kearney RE, Hunter IW: Position dependence of ankle joint
dynamics–I. Passive mechanics. J Biomech 1986, 19:727-735.
14. Mirbagheri MM, Barbeau H, Ladouceur M, Kearney RE: Intrinsic and reflex
stiffness in normal and spastic, spinal cord injured subjects. Exp Brain Res
2001, 141
:446-459.
15. Gajdosik RLaL, DJ, McFarley DC, Meyer KM, Riggin TJ: Dynamic elastic and
static viscoelastic stress-relaxation properties of the calf muscle-tendon
unit of men and women. Isokinetics and Exercise Science 2006, 14:33-44.
16. Ljung L: System Identification - Theory for the User New Jersey: Prentice Hall,
second 1999.
17. Houk JC, Rymer WZ, Crago PE: Dependence of dynamic response of
spindle receptors on muscle length and velocity. J Neurophysiol 1981,
46:143-166.
18. Burne JA, Carleton VL, O’Dwyer NJ: The spasticity paradox: movement
disorder or disorder of resting limbs? J Neurol Neurosurg Psychiatry 2005,
76:47-54.
19. Lieber RL, Steinman S, Barash IA, Chambers H: Structural and functional
changes in spastic skeletal muscle. Muscle Nerve 2004, 29:615-627.
20. O’Dwyer NJ, Ada L, Neilson PD: Spasticity and muscle contracture
following stroke. Brain 1996, 119(Pt 5):1737-1749.
21. Gajdosik RL: Influence of a low-level contractile response from the
soleus, gastrocnemius and tibialis anterior muscles on viscoelastic stress-
relaxation of aged human calf muscle-tendon units. Eur J Appl Physiol
2006, 96:379-388.
22. Gajdosik RL, Vander Linden DW, McNair PJ, Riggin TJ, Albertson JS,
Mattick DJ, Wegley JC: Viscoelastic properties of short calf muscle-tendon
units of older women: effects of slow and fast passive dorsiflexion
stretches in vivo. Eur J Appl Physiol 2005, 95:131-139.
23. Singer BJ, Dunne JW, Singer KP, Allison GT: Velocity dependent passive
plantarflexor resistive torque in patients with acquired brain injury. Clin
Biomech (Bristol, Avon) 2003, 18:157-165.
24. Rabita G, Dupont L, Thevenon A, Lensel-Corbeil G, Perot C, Vanvelcenaher J:
Differences in kinematic parameters and plantarflexor reflex responses
between manual (Ashworth) and isokinetic mobilisations in spasticity
assessment. Clin Neurophysiol 2005, 116:93-100.
25. McNair PJ, Hewson DJ, Dombroski E, Stanley SN: Stiffness and passive
peak force changes at the ankle joint: the effect of different joint
angular velocities. Clin Biomech (Bristol, Avon) 2002, 17:536-540.
26. Yeh CY, Chen JJ, Tsai KH: Quantifying the effectiveness of the sustained
muscle stretching treatments in stroke patients with ankle hypertonia. J
Electromyogr Kinesiol 2007, 17:453-461.
27. De Luca CJ, Merletti R: Surface myoelectric signal cross-talk among
muscles of the leg. Electroencephalogr Clin Neurophysiol 1988, 69:568-575.
28. Gravel D, Richards CL, Filion M: Angle dependency in strength
measurements of the ankle plantar flexors. Eur J Appl Physiol Occup
Physiol
1990, 61:182-187.
29. Muramatsu T, Muraoka T, Takeshita D, Kawakami Y, Hirano Y, Fukunaga T:
Mechanical properties of tendon and aponeurosis of human
gastrocnemius muscle in vivo. J Appl Physiol 2001, 90:1671-1678.
30. Hidler JM, Rymer WZ: Limit cycle behavior in spasticity: analysis and
evaluation. IEEE Trans Biomed Eng 2000, 47:1565-1575.
31. Kearney RE, Hunter IW: Dynamics of human ankle stiffness: variation with
displacement amplitude. J Biomech 1982, 15:753-756.
32. Hidler JM, Rymer WZ: A simulation study of reflex instability in spasticity:
origins of clonus. IEEE Trans Rehabil Eng 1999, 7:327-340.
33. Mirbagheri MM, Barbeau H, Kearney RE: Intrinsic and reflex contributions
to human ankle stiffness: variation with activation level and position. Exp
Brain Res 2000, 135:423-436.
34. de Vlugt E, Schouten AC, van der Helm FC: Quantification of intrinsic and
reflexive properties during multijoint arm posture. J Neurosci Methods
2006, 155:328-349.
35. Olney SJ, Winter DA: Predictions of knee and ankle moments of force in
walking from EMG and kinematic data. J Biomech 1985, 18:9-20.
36. Potvin JR, Norman RW, McGill SM: Mechanically corrected EMG for the
continuous estimation of erector spinae muscle loading during
repetitive lifting. Eur J Appl Physiol Occup Physiol 1996, 74:119-132.
37. Bobet J, Norman RW: Least-squares identification of the dynamic relation
between the electromyogram and joint moment. J Biomech 1990,
23:1275-1276.
38. Pisano F, Miscio G, Del Conte C, Pianca D, Candeloro E, Colombo R:
Quantitative measures of spasticity in post-stroke patients. Clin
Neurophysiol 2000, 111:1015-1022.
39. Sinkjaer T, Magnussen I: Passive, intrinsic and reflex-mediated stiffness
in the ankle extensors of hemiparetic patients. Brain 1994,
117(Pt 2):355-363.
de Vlugt et al. Journal of NeuroEngineering and Rehabilitation 2010, 7:35
/>Page 15 of 16
40. Gorassini MA, Knash ME, Harvey PJ, Bennett DJ, Yang JF: Role of
motoneurons in the generation of muscle spasms after spinal cord
injury. Brain 2004, 127:2247-2258.
41. Nielsen JB, Crone C, Hultborn H: The spinal pathophysiology of spasticity–
from a basic science point of view. Acta Physiol (Oxf) 2007, 189:171-180.
42. Lamontagne A, Malouin F, Richards CL, Dumas F: Impaired viscoelastic
behaviour of spastic plantarflexors during passive stretch at different
velocities. Clin Biomech (Bristol, Avon) 1997, 12:508-515.
43. Bartoo ML, Linke WA, Pollack GH: Basis of passive tension and stiffness in
isolated rabbit myofibrils. Am J Physiol 1997, 273:C266-276.
44. Proske U, Morgan DL: Do cross-bridges contribute to the tension during
stretch of passive muscle? J Muscle Res Cell Motil 1999, 20:433-442.
45. Maganaris CN: In vivo measurement-based estimations of the moment
arm in the human tibialis anterior muscle-tendon unit. J Biomech 2000,
33:375-379.
46. Maganaris CN, Baltzopoulos V, Sargeant AJ: Changes in the tibialis anterior
tendon moment arm from rest to maximum isometric dorsiflexion: in
vivo observations in man. Clin Biomech (Bristol, Avon) 1999, 14:661-666.
47. Thelen DG: Adjustment of muscle mechanics model parameters to
simulate dynamic contractions in older adults. J Biomech Eng 2003,
125:70-77.
48. Gajdosik RL: Passive extensibility of skeletal muscle: review of the
literature with clinical implications. Clin Biomech (Bristol, Avon) 2001,
16:87-101.
49. Esteki A, Mansour JM: An experimentally based nonlinear viscoelastic
model of joint passive moment. J Biomech 1996, 29:443-450.
50. Genadry WF, Kearney RE, Hunter IW: Dynamic relationship between EMG
and torque at the human ankle: variation with contraction level and
modulation. Med Biol Eng Comput 1988, 26:489-496.
doi:10.1186/1743-0003-7-35
Cite this article as: de Vlugt et al.: The relation between
neuromechanical parameters and Ashworth score in stroke patients.
Journal of NeuroEngineering and Rehabilitation 2010 7:35.
Submit your next manuscript to BioMed Central
and take full advantage of:
• Convenient online submission
• Thorough peer review
• No space constraints or color figure charges
• Immediate publication on acceptance
• Inclusion in PubMed, CAS, Scopus and Google Scholar
• Research which is freely available for redistribution
Submit your manuscript at
www.biomedcentral.com/submit
de Vlugt et al. Journal of NeuroEngineering and Rehabilitation 2010, 7:35
/>Page 16 of 16