Báo cáo hóa học: " A biofeedback cycling training to improve locomotion: a case series study based on gait pattern classification of 153 chronic stroke patients" pdf
Bạn đang xem bản rút gọn của tài liệu. Xem và tải ngay bản đầy đủ của tài liệu tại đây (1.91 MB, 13 trang )
JNER
JOURNAL OF NEUROENGINEERING
AND REHABILITATION
A biofeedback cycling training to improve
locomotion: a case series study based on gait
pattern classification of 153 chronic stroke
patients
Ferrante et al.
RESEARCH Open Access
A biofeedback cycling training to improve
locomotion: a case series study based on gait
pattern classification of 153 chronic stroke
patients
Simona Ferrante
1*
, Emilia Ambrosini
1
, Paola Ravelli
1
, Eleonora Guanziroli
2
, Franco Molteni
2
, Giancarlo Ferrigno
1
and
Alessandra Pedrocchi
1
Abstract
Background: The restoration of walking ability is the main goal of post-stroke lower limb rehabilitation and
different studies suggest that pedaling may have a positive effect on locomotion. The aim of this study was to
explore the feasibility of a biofeedback pedaling treatment and its effects on cycling and walking ability in chronic
stroke patients. A case series study was designed and participants were recruited based on a gait pattern
classification of a population of 153 chronic stroke patients.
Methods: In order to optimize participants selection, a k-means cluster analysis was performed to subgroup
homogenous gait patterns in terms of gait speed and symmetry.
The training consisted of a 2-week treatment of 6 sessions. A visual biofeedback helped the subjects in maintaining
a symmetrical contribution of the two legs during pedaling. Participants were assessed before, after training and at
follow-up visits (one week after treatment). Outcome measures were the unbalance during a pedaling test, and the
temporal, spatial, and symmetry parameters during gait analysis.
Results and discussion: Three clusters, mainly differ ing in terms of gait speed, were identified and participants,
representative of each cluster, were selected.
An intra-subject statistical analysis (ANOVA) showed that all patients significantly decreased the pedaling unbalance
after treatment and maintained significant improvements with respect to baseline at follow-up. The 2-week
treatment induced some modifications in the gait pattern of two patients: one, the most impaired, significantly
improved mean velocity and increased gait symmetry; the other one reduced significantly the over-compensation
of the healthy limb. No benefits were produced in the gait of the last subject who maintained her slow but almost
symmetrical pattern. Thus, this study might suggest that the treatment can be beneficial for patients having a very
asymmetrical and inefficient gait and for those that overuse the healthy leg.
Conclusion: The results demonstrated that the treatment is feasible and it might be effective in translating
progresses from pedaling to locomotion. If these results are confirmed on a larger and controlled scale, the
intervention, thanks to its safety and low price, could have a significant impact as a home- rehabilitation treatment
for chronic stroke patients.
* Correspondence:
1
NearLab, Bioengineering Department, Politecnico di Milano, Milano, Italy
Full list of author information is available at the end of the article
Ferrante et al. Journal of NeuroEngineering and Rehabilitation 2011, 8:47
/>JNER
JOURNAL OF NEUROENGINEERING
AND REHABILITATION
© 2011 Ferra nte et al; licensee BioMed Central Ltd. This is an Open A ccess article distributed under the terms of the Creative Commons
Attribution Lice nse ( which permits unrestricted use, distribution, and reproduction in
any mediu m, provided the original work is properly cited.
Background
Stroke is the leading cause of acquired adult disability
[1,2]. The most common and widely recognized deficit
caused by stroke is motor impairment, which typically
affects one side of the body, controlateral to the brain
hemisphere where the lesion occurs. The ensuing hemi-
paresis foresees some degrees of motor recovery
depending on the severity of the lesion and on the reha-
bilitative training [3]. Several studies have revealed that
motor experience plays a major role in the subsequent
physiological reorganization occurring in the intact tis-
sues adjacent to the lesion [4,5]. Clinical studies on cen-
tral motor neuroplasticity support the role of goal-
oriented, active, repetitive movements in the training of
the paretic limb to enhance motor relearning and recov-
ery [6-8].
The recovery of walking ability is considered the most
important objective of the lower limb rehabilitation of
individuals after stroke [9]. However, effective interven-
tions for gait training are limited because extensive
assistance is required for individuals with unstable bal-
ance, muscle weakness, and a persistent deficit in move-
ment coordination.
In the last dec ade different studies suggested that sig-
nificant improvements in the lower extremity function
mightresultfromusingcyclingasarehabilitative
method and that repetitive bilateral training provided by
pedaling may have a positive effect on walking ability
[10-13]. Cycling and walking share a similar kinematic
pattern: both tasks are cyclical, require reciprocal flexion
and extension movements of hip, knee, and an kle, and
have an alternating activation of agonist/antagonist mus-
cles in a well-timed and coordinated manner [14,15].
Furthermore, cycling avoids problems of balance and
can be safely performed even from a wheelchair, without
requiring expensive robotic devices or the constant
supervision of a therapist which are, on the contrary,
necessary to support body weight and to prevent falls
during gait training. For all these reasons, leg cycling
trainingisasaferandmoreeconomicinterventionto
supplement functional ambulation training after stroke
and it is also becoming an interesting option for home
rehabilitation of hemiparetic patients.
Providing an online feedback about patients’ perfor-
mance to the training improves patients’ motivation,
allows the therapists to assess the exercise and may lead
to an enhancement in the motor relearning process
[16]. This rehabilitative method is well known with the
term of biofeedback (BF) and consists of the use of
instrumentation to make covert physiological processes
more overt. BF refers to an artificial feedback on biolo-
gical quantities, transferred to a biological system
(human) [17]. The use of BF re-endows patients with
sensorimotor impairments with the ability to assess
physiological responses and possibly to relearn self-con-
trol of those responses [18]. Besides, continued training
could establish new sensory engrams and help the
patients to perform tasks without feedback [19]. To
maximize the effect of BF it may be important to apply
it within task-oriented activity and with a feedback
mode that facilitates motor relearning [18] . During ped-
aling, visual BF methods were developed based on EMG
activity [20] and power output produced during a treat-
ment of cycling induced by electrical stimulation [21].
Because of the laterality of the motor impairment, the
postural imbalance or asymmetrical movements between
thetwolowerlimbsarecommonlyobservedinhemi-
paretic patients, making the recovery of a symmetrical
involvement of the two legs strictly correlated with the
improvement of o verground locomotion [22,23]. To
minimize gait asymmetry could be clinically crucial
since it may be associated with a number of negative
consequences such as inefficiency, challenges to balance
control, risks of musculo skeletal injury to the non-pare-
tic lower limb and loss of bone density in the paretic
lower limb [24]. During cycling, since the two legs are
simultaneously acting on a single crank, not optimal
solutions could be adopted by stroke patients: for ex am-
ple, the non- paretic leg can completely compensate for
the paretic one [11], making the pedaling strategy effec-
tive in terms of speed and total power output, but
strongly unbalanced. This solution could limit the possi-
ble benefits and even worsen the gait performance in
terms of symmetry. To solve this problem, it could be
useful to display a feedback that provides infor mation
about the force s produced at the pedals, asking patients
to increase the task symmetry.
Commercial available cycle-ergometers are usually
equipped with a torque sensor measuring the total tor-
que provided by both legs at the crank, but this signal
does not allow to dist inguish the contribution provided
by each leg during pedaling. To overcome this limita-
tion, in our laboratory a cycle-ergometer was instrumen-
ted by mounting strain gauges on each crank a rm to
measur e independently the torque produced by each leg
during pedaling [25]. Starting from this setup, an infor-
mation fusion algorithm was implemented in order to
visually display to the patient an intuitive index strictly
correlated with the symmetrical involvement of the two
legs in terms of torques provided at the crank arms dur-
ing pedaling. The aim of t he present study was to
develop a BF controller and to evaluate its feasibility
and clinical efficacy as a reh abilitation treatment for
chronicstrokepatients.Thehypothesiswasthata2-
week BF cycling treatment might induce some improve-
ments not only in the pedaling performance but a lso in
the walking ability both in terms of gait speed and sym-
metry indices. A case series study was designed and
Ferrante et al. Journal of NeuroEngineering and Rehabilitation 2011, 8:47
/>Page 2 of 12
participants wer e recruited based on a gait pattern clas-
sification of a population of 153 chronic stroke patients.
In particular, subjects representative of each category
were included in the stu dy in order to identify those
patients who can benefits the most from the proposed
treatment.
Methods
Participants
Gait pattern categorization of chronic stroke patients
A population of 153 chronic stroke patients, included in
a previous study [26], was chosen to perform the gait
pattern categorization. All these patients underwent
orthopedic procedures to correct equinovarus foot
deformity and performed either prior and postoperative
gait evaluation. Participants included in that study [26]
satisfied the following inclusion criteria: (1) left or right
hemiparesis because of ischemic or hemorrhagic stroke
(diagnosis confirmed by computed tomographic scan/
magnetic resonance imaging or clinical documentation
or both); (2) age > 18 years; (3) time since stroke of at
least 12 months; (4) mild spasticity level for all lower
limb muscles (Modified Ashworth Scale ≤ 2).
The results of the postoperative gait evaluations were
chosen for the gait categorization, being well represen-
tative of the walking ability of chronic stroke patients
in a stable condition. During these assessments, all
patients were ambulant, without using any special
orthosis; some o f them were helped by walking aids
such as sticks (n = 70), tripods (n = 8), quadripods (n
= 11), whereas the remaining group of patients (n =
64) did no t use any aid.
The gait classification was based on temporal and spa-
tial parameters able to identify the overall locomotor
performance and the movement symmetry. The mean
velocity was included as a variable for the cluster analy-
sis, being defined as a reliable marker of functional dis-
ability [9] and being reported as the strongest
determinant of group placement in a cluster analysis o f
stroke patients [27]. Besides, temporal parameters able
to discriminate gait pattern in term of symmetry were
chosen [24]. In particular, we considered the ratio
between the values obtained by the paretic and healthy
leg for the following par ameters: stance time in percen-
tage of stride time, swing time in percentage of stride
time, and the intra-limb ratio of swing time against
stance time. The double support time ratio was not con-
sidered in the gait categorization because it was unable
to identify asymmetric individuals and the mean value
did not differ a lot from healthy subjects [24].
A k-means cluster analysis was used to subgroup
homogeneous gait patterns. A Mahanalobis distance cri-
terion was adopted to eliminate any outlier from the
data sample. The clustering technique is very sensitive
to variables which are highly correlated, so all the vari-
ables were assessed for correlation and those highly cor-
related to others were removed. The selected variables
were standardized before entering the c luster analysis.
The Squared Euclidean distance measure was used and
the number of clusters was optimized performing an a
posteriori measurement of the silhouette coefficient
which evaluated both cohesion and separation of the
obtained centroids [28].
Choice of stroke participants
After having performed the cluster analysis of the
population of chronic stroke patients, we chos e a num-
ber of participants equal to the number of identified
clusters: each patient was considered as representative
of one cluster at baseline. Therefore, participants
recruited in this study satisfied the same inclusion cri-
teria of the population chosen for the gait categoriza-
tion. In addition, patients were characterized by a joint
mobility ranges which did not preclude pedaling (knee
extension up to 150° and hip flexion up to 80°). The
only exclusion criteria was an insufficient cognitive
capacity to participate in the program, including recep-
tive aphasia.
The chosen patients were prevented to perform any
other lower limb intervention during the BF training.
Healthy subjects participants
A group of 12 healthy subjects (age 22.6 ± 3.3 years,
heigh t 171.8 cm ± 9.7 cm, weight 63.3 kg ± 8.9 kg) par-
ticipated in the study in order to compute the normality
ranges for both the pedaling and the walking test used
to evaluate the motor recovery induced by the training.
Experimental setup
The THERA-live™ (Medica Medizintechnik GmbH,
Germany) motorized cycle-ergometer was chosen for
the treatment. It was equipped with a shaft encoder for
the acquisition of the crank angle and with strain gauges
attached on the crank arms to measure the torque pro-
duced by each leg during pedaling [25]. During the
treatment, patients sat on a chair or a wheelchair in
front of the ergometer and their legs were stabilized by
calf supports fixed to the pedals.
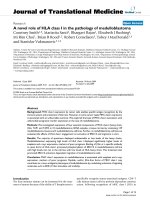
A master computer, called master PC, running
Matlab/Simulink
®
under Linux, acquired all signals
coming from the ergometer with a sampling frequency
of 200 Hz and calculated, at the end of each revolution,
the BF indices. Then, these indices were sent to a sec-
ond PC, called slave PC, which provided the visual bio-
feedback to the patients, displaying the values of the BF
indices through a graphical interface implemented in
Matlab. The communication between the PCs was
obtained through LAN connection according to the
UDP/IP protocol. The experimental setup is shown in
Figure 1.
Ferrante et al. Journal of NeuroEngineering and Rehabilitation 2011, 8:47
/>Page 3 of 12
Intervention
The BF treatment was performed 3 days a week for two
weeks, obtaining a total of 6 sessions. Each session
lasted 14 minutes:
• 1 minute of passive cycling;
• 2 minutes of voluntary cycling without visual bio-
feedback (VOL1);
• 8 minutes of voluntary cycling with visual biofeed-
back (BF phase);
• 1 minute of passive cycling;
• 2 minutes of voluntary cycling without visual bio-
feedback (VOL2).
Passive cycling was guaranteed by the ergometer’s
motor which maintained the speed at a constant value
of 30 rpm.
The communication between the two PCs, shown in
Figure 1, was active only during the BF phase. During
theotherphasesthedatawereonlyacquiredandsaved
by the master PC.
To compute the BF indices during the BF phase, the
active torque profiles for each leg as function of the
cra nk angle were obtained by subtracting the mean tor-
que computed during passive cycling from the torque
profile calculated during each revolution of voluntary
pedaling. In this way, the inertial and gravitational con-
tribution of the limbs were eliminated. Then, the BF
indices for each revolution consisted of the mechanical
work produced by the paretic (W
PL
) and healthy leg
(W
HL
) and were computed as follows:
W
PL
=
360
◦
0
◦
T
PL
(θ)d
θ
(1)
W
HL
=
360
◦
0
◦
T
HL
(θ)d
θ
(2)
where T
PL
and T
HL
are the active torque pro files pro-
duc ed by the paretic and healthy leg, respectively, while
θ represents the crank angle.
The slave PC displayed in real-time, at the end of each
revolution, the values of work produced by the two legs,
through a graphical interface consisting of two bars with
a height proportional to the work values and a yellow
band indicating the target (see Figure 1). Patients were
asked to voluntary compensate a potential unbalance
producing with each leg a value of work within the tar-
get band (yellow bands on the two bars). When the two
work values were both within the yellow bands, the bars
becamegreen;otherwisetheywerered.Tomakethe
exercise more challenging, the target band increased the
valueofrequiredworkwhenthesubjectswereableto
fulfill the goal for at least 7 over 10 consecutive revolu-
tions. If the patients failed to maintain the increased tar-
get for 1 minute, the target decreased again not to
discourage the subjects. The target value was subject-
dependent and was fixed before the beginning of each
sessionbymeansofapreliminarytest.Thistestcon-
sisted of a 30-second period of passive cycling and a 30-
second period of voluntary cycling during which patients
were asked t o pedal with maximal effort. At the end of
the test, the values of W
PL
and W
HL
for each revolution
were computed and the maximal value achieved by the
paretic leg (W
PLmax
)wasusedtosetthetargetinterval
used during the BF phase: the target could range
between 80% W
PLmax
and 120% W
PLmax
and the target
band was fixed at ± 10% W
PLmax
.
The proposed protocol was approved by the Ethical
Committee of the rehabilitation center and each partici -
pant signed an informed consent.
Assessment
Participants were tested before, after the intervention
and in a follow-up assessment one week after the end of
the treatment by means of the following assessment
tests:
1. a pedaling test, which comprised a 1-minute period
of passive cycling and a 2-minute period of voluntary
cycling. The same ergometer used for the BF treatment
was employed for this test. Thus, the crank angle and
the torque produced independently b y the paretic and
healthy leg were measured and sampled at 200 Hz.
2. a walking test on a 10-meter walkway. Patients were
asked to walk without the shoes at a self selected speed.
No constraints were imposed to the subjects and neither
assistive devices were used during the test. Three-
dimensional kinemat ics of the subject ’slowerlimbs
were recorded with the Elite clinic™ (BTS, Milano,
Italy) motion analysis system (8 cameras, sample rate
100 Hz) using the SAFLo protocol [29]. Ground
Figure 1 Experimental setup used for the intervention.
Ferrante et al. Journal of NeuroEngineering and Rehabilitation 2011, 8:47
/>Page 4 of 12
reaction forces were measured with two dynamometric
force platforms (Kistler, Winterthur, Switzerland).
Data analysis
Intervention
The performance achieved daily during the BF phase
was evaluated by means of the ratio between the num-
ber of symmetrical revolutions and the total number of
revolutions (BF
perf
).
During VOL1 and VOL2, the values of W
PL
and W
HL
were computed for each revolution as in equations (1,
2). Then the pedaling unbalance (U) was defined as:
U =
|
W
HL
− W
PL
|
(
|W
HL
| + |W
PL
|
)
(3)
U could range from 0 (two identical works) to 100%
(WPL negative or equal to zero).
Assessment
The pedaling test was evaluated in terms of WHL, WPL,
and U computed at each revolution. During each assess-
ment test, considering that patients were pedaling at 30
rpm for 2 minutes, the number of revolution was about
60.
Regarding the walking test, all r aw data were filtered
with a fifth order causal Butterworth filter (cutoff fre-
quency of 5 Hz) and elaborated to compute kinematics,
kinetics and standard temporal and spatial gait para-
meters [26,29].
To evaluate gait symmetry two indices were
computed:
- ST ratio, i.e., the ratio between the stance time in
percentage of the stride time obtained by the paretic leg
and the one obtained by the healthy leg. The ST ratio
could be related to balance control issues leading t he
patients to shorten the paretic stance time [24].
- SV ratio, i.e., the ratio between the swing velocity
obtained by the paretic leg and the one obtained by the
healthy leg. The SV ratio could be related to an insuffi-
cient power gene rated to swing the paretic limb quickly
and to an increased time for paretic foot placement [24].
All values of the temp oral and spatial gait par ameters
reported are the me an values of 4 to 5 repeated gait
trials along the walkway at the preferred speed.
Statistics
After having evaluated that all patients’ parameters were
normally distributed, an intra-subj ect one way Analysis
of Variance (ANOVA, p < 0.05) was performed to com-
pare pre-, post-training and follow-up outcome mea-
surements. Moreover, a Mann-Whitney U test (p <
0.05) was used to compare patients’ perfor mance before
training, after training, and at follow-up visits, with the
group of healthy volunteers. A non-parametric test was
preferred to identify any statistically significant
difference between patients and healthy subjects, being
the group of able-bodied participants not normally
distributed.
Results
Participants
Gait pattern categorization
Thestancetimeinpercentageofthestridetime,the
swing time in percentage of the stride time, and the
intra-limb ratio of the swing time against the stance
time obtained in the whole population were highly cor-
related. This result confirmed what obtained by Patter-
son and collaborators [24] and, accordingly, onl y one of
these parameters was chosen for the gait patterns cate-
gorization: the ST ratio. Thus, the two parameters used
in the cluster analysis were the ST ratio and the mean
velocity. Two outliers were eliminated before performing
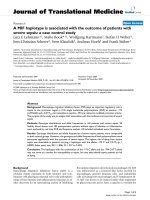
the cluster analysis. After having observed that the mean
silhouette coefficient decreased moving from a three to
a four-clusters solution, participants were assigned to 3
homogenous subgroups. Subgroup 1 contained 58 parti-
cipants (mean ± standard deviation (SD) ): ST ratio, 0.79
± 0.08; mean velocity, 0.45 m/s ± 0.07 m/s), Subgroup 2
contained 70 participants (ST ratio, 0.75 ± 0.09; mean
velocity, 0.22 m/s ± 0.07 m /s), and Subgroup 3 con-
tained 23 participants (ST ratio 0.84 ± 0.06, mean velo-
city, 0.71 m/s ± 0.11 m/s). The three clusters are
reported in Figure 2. The stroke p opulation differed
from the group of healthy subjects (grey area in Figure
2). This difference was more evident in terms of mean
velocity than in terms of ST ratio. Indeed, some patients
Figure 2 The patients’ distribution in the identifie d clusters at
baseline. The three clusters are reported with asterisks of different
colors. S1, S2 and S3 are the black, red and light blue points,
respectively. The normality ranges obtained by the group of healthy
subjects are represented by the grey area (the boundary are the
minimum and maximum values).
Ferrante et al. Journal of NeuroEngineering and Rehabilitation 2011, 8:47
/>Page 5 of 12
were characterized by an almost symmetrical gait pat-
tern but were still significantly slower than healthy sub -
jects. The distribution of the three clusters denote s that
they were well distinct only in terms of mean velocity
corroborating the hypothesis that the gait speed could
be a reliable marker of function disability [9]. The popu-
lation covered a huge variability of stroke patients star t-
ing from very slow walkers to quite fast patients: the
minimum mean velocity was lower than 0.1 m/s, corre-
sponding to patients who need long term care, while the
maximum speed was 0.9 m/s, a value that permits
unrestricted walking in the community.
Patients chosen for the intervention
After giving their informed consent, 3 chronic stroke
subjects, were included in the case series study. Patients’
details are reported in Table 1. Two of the three partici-
pants (S2 and S3) underwent orthopedic procedures to
correct equinovarus foot deformity, whereas the last one
(S1) did not. Figure 2 shows the participants distribution
with respect to the identif ied clusters before the begin-
ning of the intervention. The selected patients were cho-
sen in order to differ significantly from each other not
only in terms of mean velocity (as it was because they
belong to the th ree different clusters) but also in terms
of gait symmetry, i.e., ST ratio. In p articular, S2 was
characterized by a slow gait speed and an asymmetrical
gait pattern; S1 had a more symmetrica l but still slow
gait; S3 walked faster but his pattern was unbalanced.
The treatment is mainly focused on the recovery of a
symmetrical use of the legs during pedaling involving
maximally the paretic one. Thus, given the significant
difference between the three chosen patients, our
hypot hesis was that the treatme nt could induce a differ-
ent effect in the three patients: we were expecting an
increase of strength and symmetry in S2 resulting in a
faster and more s ymmetric gait, onl y a decrease of
asymmetry in S3, and a muscle strengthen probably
resulting in a faster gait in S1.
Normality Ranges
In the pedaling test, the healthy subject group obtained
a median value of unbalance equal to 1.50% with a n
interquartile range (IQR) of 3.05%.
The normality ranges obtained during the walking test
in terms of spatio-temporal variables and symmetry
parameters are reported in Table 2.
Intervention
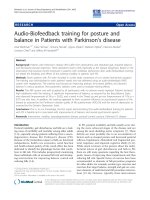
Figure 3 depicts a comparison between the performance
obtained by the three patients during the first (upper
panels) and the last (lower panels) day of treatment in
termsofworkproducedbythetwolegsduringthe8
minutes of voluntary cycling with visual biofeedback (BF
phase).
In the first day of treatment, S1 (panel (A)) was not
able to produce a symmetric pedaling. Indeed , the work
values produced by the paretic and non-paretic leg
(asterisks and circles, respectively) were not included in
the tolerance area (yellow band). It is noticeable that her
performance improved after treatment: in the last day
(panel (D)), she was also able to achieve a symmetric
pedaling, and, thus, the target value of work (black line)
increased. This symmetric pedaling was only partly
maintained in the middle part of the session (sometimes
the target decreased because she was tired or not able
to be concentrated for a long time), but then, in the
final part, she was able to reach the maximal level of the
target (120% WPLmax). Furthermore, the target work
used in the last day of treatment (ranges from 25 Nm to
35 Nm) was higher than the one used in the first day
(about 18 Nm). This result suggested us that S1 was
able to understand and exploit properly the visual
biofeedback.
Table 1 Participants baseline details
Subject Age
(years)
Gender Etiology Time since stroke
(years)
Affected
Side
Modified
Ashworth
Scale
(0-4)
Mean Velocity (m/s)
*
ST ratio (0-1)
*
S1 23 female Ischemic stroke 1 left 1 0.44 (0.03) 0.92 (0.04)
S2 51 male Ischemic stroke 10 right 1 0.31 (0.04) 0.57 (0.05)
S3 27 male Hemorrhagic
stroke
9 right 2 0.78 (0.04) 0.80 (0.04)
* Values: Mean (SD)
Table 2 Normality ranges for the walking assessment test
Leg Median (IQR)
Stance Time [%stride] Right Left 59 (1) 58 (2)
Swing Time [%stride] Right Left 40 (1) 41 (2)
Stride Time [ms] Right Left 1045 (112) 1065 (100)
Stride Length [mm] Right Left 1374 (140) 1393 (159)
Swing Velocity [m/s] Right Left 3.27 (0.20) 3.17 (0.27)
Mean Velocity [m/s] 1.33 (0.12)
ST Ratio 0.98 (0.02)
SV Ratio 0.97 (0.03)
Values: Median (IQR) of the spatio-temporal and symmetry parameters
computed on the healthy subjects group during the walking test.
Ferrante et al. Journal of NeuroEngineering and Rehabilitation 2011, 8:47
/>Page 6 of 12
S2 was able to achieve a symmetric pedaling neither in
the first nor in the last day of treatment (panels (B) and
(E)). However, in the last day of treatment, he reversed
his pedaling strategy: he was very concentrated on ped-
aling with the paretic side, trying to relax the healthy
one. Thus, his pedaling resulted to be unbalance d in
favor of the paretic side. In particular, the target value
and the work produced by the paretic leg during the
last day of treatment were doubled with respect to the
values produced during the first day, implying an
increase of strength achieved by S2.
Finally, S3 was overusing the healthy leg in the first day
of treatment (pane l (C)), while he suc ceeded in understand-
ing the visual biofeedback in the last day of treatment.
Indeed, he achieved and maintained a symmetric pedaling
(panel F): the target work increased till the maximal value
and was maintained for the whole period of the BF phase.
In addition, the treatment induced an increase of force also
in S3, being the target work used in the last day of treat-
ment about the double of the one used in the fir st day.
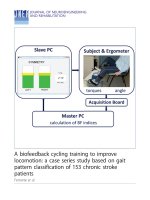
Figure 4 shows the performance obtained daily by the
three patients. All patients were able to increase their per-
formance (BF
perf
in panel (A)) during the treatment,
implying the efficacy and easiness of the visual feedback
given to the patients. Furthermore, the unbalance com-
puted during VOL1 decreased over time for all patients,
suggesting that they learnt how to execute a symmetrical
task (panel (B)), also without being helped by the feedback.
Assessment
Table 3 reports the mean and the standard deviation
values of the works produced by the paretic and healthy
Figure 3 Performance obtained during the BF phase in the first and last day of treatment. Results obtained by the three patients in the
first (upper panels) and last (lower panels) day of treatment during the BF phase. Each asterisk and circle indicate the mean value, among 10
consecutive revolutions, of the work produced by the paretic and healthy leg, respectively. The black line shows the target value and the
surrounding yellow area represents the tolerance band. In all panels, double vertical axes are used to indicate the absolute work value and the
minimum and maximum target values in percentage of W
PLmax
.
Ferrante et al. Journal of NeuroEngineering and Rehabilitation 2011, 8:47
/>Page 7 of 12
legs, and of the pedaling unbalance obtained in the pre,
post-treatment, and follow-up assessment, while Table 4
reports the results obtained during the walking assess-
ment test by the three participants. In what follows, the
results are presented case by case.
S1
After the 2-week treatment, S1 achieved a significant
decrease of the unbalance (Table 3) obtained by a slight
increase of W
PL
and a slight decrease of W
HL
. The ped-
aling unbalance was further reduced in the follow-up
assessment. Although the treatment induced a signifi-
cant improvement of the pedaling unbalance, the U-test
performed to compare the performance of S1 with the
group of healthy subjects (median [IQR]:
unbalance,1.50% [3.05%]) showed significant differences
at all assessment tests (pre-, post-training and follow-
up).
The results obtained in the pedaling assessment tests
were not translated to improvements in terms of walking
ability. Indeed, S1 at baseline was characterized by a slow
and almo st symmetric gait and the treatment did not
induce any gait improvement in her locomotor perfor-
mance (Table 4). The only significant variation in the gait
parameters was an increase of the swing velocity of the
healthy leg but it seems not to be related to the treatment
because the post-hoc analysis revealed that a difference
existed between the pre-treatment and the follow -up
assessment but did not soon after the end of the training.
The U-test performed to compare each walking
assessment of S1 with the group of healthy subjects
showed that S1 resulted not significantly different from
the healthy subject group in terms of ST ratio and SV
ratio during the pre-training and the follow-up
assessment.
S2
S2 significantly improved his pedaling unbalance after
treatment. To achieve this performance, he increased
both values of work, but WPL increased the more (it
was doubled after treatment with respect to baseline).
Comparing the follow-up with the p ost-training assess-
ment, S2 worsened the unbalance, although his pedaling
remained significantly more symmetrical than in the
pre-treatment evaluation. The pedaling unbalance was
always very different from the healthy subject normali ty
range (U-test, p < 0.01).
The BF treatment see med to be beneficial in terms of
walking ability recovery for S2 (Table 4). Indeed, the
treatment produced a statistically reliable increase of the
Figure 4 D ay-by-day perfor mance duri ng the in tervention.
Trend of the performance obtained during the 6 days of treatment
in terms of BF
perf
, computed during the BF phase (panel (A)), and
unbalance (panel (B)) during VOL1.
Table 3 Results of the pedaling assessment test
PRE POST FU P * P *
(pre vs post)
P*
(pre vs fu)
P*
(post vs fu)
S1
U (%) 31.5 (8.0) 24.7 (9.6) 18.3 (7.3) < 0.01 < 0.01 < 0.01 < 0.01
W
HL
(Nm) 47.8 (5.5) 45.0 (5.8) 43.3 (5.6) < 0.01 < 0.01 < 0.01 0.07
W
PL
(Nm) 25.2 (5.5) 27.4 (5.3) 30.1 (5.6) < 0.01 0.01 < 0.01 0.01
S2
U (%) 45.4 (7.8) 29.2 (13.0) 39.9 (13.7) < 0.01 < 0.01 0.02 < 0.01
W
HL
(Nm) 35.0 (6.5) 43.5 (12.7) 43.1 (10.3) < 0.01 < 0.01 < 0.01 0.97
W
PL
(Nm) 13.0 (2.6) 25.7 (10.9) 19.3 (7.9) < 0.01 < 0.01 < 0.01 < 0.01
S3
U (%) 38.1 (9.4) 12.4 (10.1) 13.6 (10.6) < 0.01 < 0.01 < 0.01 0.69
W
HL
(Nm) 78.5 (8.3) 36.2 (4.3) 42.8 (3.9) < 0.01 < 0.01 < 0.01 < 0.01
W
PL
(Nm) 35.9 (9.2) 29.3 (4.9) 33.7 (6.8) < 0.01 < 0.01 0.06 < 0.01
Values: Mean (SD)
* P: Significance level of one way ANOVA (p < 0.05)- Post-hoc: Scheffè
U indicates the pedaling unbalance; W
HL
and W
PL
, the works produced by the healthy and paretic legs, respectively.
Ferrante et al. Journal of NeuroEngineering and Rehabilitation 2011, 8:47
/>Page 8 of 12
mean velocity, due to both a significant increase of the
stride length and a significant decrease of the stride
time for the two legs. These improvements were main-
tained at follow-up keeping the mean velocity signifi-
cantly higher than in the pre-training assessment, even
if it was lower than at post-treatment evaluation.
Furthermore, S2 changed his gait pattern: he modified
the step temporization producing a more symmetrical
balance between the stance and swing phases, and main-
tained this temporization in the follow-up assessment.
Table 4 Results of walking assessment test
Leg PRE POST FU P * P *
(pre vs post)
P*
(pre vs fu)
P*
(post vs fu)
S1
Stance Time P 64 (2) 63 (2) 65 (3) 0.43
[%stride] H 70 (2) 72 (2) 71 (3) 0.48
Swing Time P 36 (2) 37 (2) 35 (3) 0.43
[%stride] H 30 (2) 28 (2) 29 (3) 0.48
Stride Time P 1896(121) 1754 (38) 1764(129) 0.10
[ms] H 1880 (84) 1742(100) 1770(125) 0.13
Stride Length P 859 (18) 817 (26) 845 (34) 0.29
[mm] H 820 (25) 812 (51) 872 (40) 0.07
Swing Velocity P 1.27(0.08) 1.28(0.04) 1.40(0.14) 0.11
[m/s] H 1.47(0.05) 1.67(0.15) 1.69(0.13) 0.03 0.07 0.04 0.95
Mean Velocity [m/s] 0.44(0.03) 0.47(0.01) 0.49(0.03) 0.07
ST Ratio 0.92(0.04) 0.89(0.03) 0.92(0.04) 0.32
SV Ratio 0.86(0.05) 0.77(0.09) 0.83(0.11) 0.30
S2
Stance Time P 48 (4) 54 (2) 53 (2) 0.03 0.04 0.02 0.76
[%stride] H 79 (8) 69 (1) 66 (3) 0.01 0.04 0.10 0.97
Swing Time P 52 (4) 46 (2) 47 (2) 0.03 0.04 0.02 0.76
[%stride] H 21 (8) 31 (1) 34 (3) 0.01 0.04 0.10 0.97
Stride Time P 1870(206) 1400 (96) 1663 (93) < 0.01 < 0.01 0.96 < 0.01
[ms] H 2402(515) 1528(101) 1630 (79) < 0.01 < 0.01 0.03 0.90
Stride Length P 637 (46) 745 (31) 630 (13) < 0.01 < 0.01 0.16 < 0.01
[mm] H 619 (72) 788 (37) 666 (20) < 0.01 < 0.01 0.50 0.03
Swing Velocity P 0.66(0.27) 1.12(0.07) 0.81(0.07) < 0.01 < 0.01 0.16 < 0.01
[m/s] H 1.37(0.25) 1.66(0.14) 1.21(0.07) 0.02 0.05 0.50 0.02
Mean Velocity [m/s] 0.31(0.04) 0.5 (0.03) 0.40(0.01) < 0.01 < 0.01 0.04 < 0.01
ST Ratio 0.57(0.05) 0.72(0.03) 0.83(0.05) < 0.01 < 0.01 < 0.01 0.02
SV Ratio 0.53(0.14) 0.70(0.06) 0.67(0.03) 0.02 0.05 0.20 0.92
S3
Stance Time P 57 (2) 56 (2) 55 (3) 0.38
[%stride] H 68 (3) 65 (1) 65 (2) 0.04 0.05 0.14 0.91
Swing Time P 43 (2) 44 (2) 45 (3) 0.38
[%stride] H 32 (3) 35 (1) 35 (2) 0.04 0.05 0.14 0.91
Stride Time P 1264 (52) 1333 (84) 1297 (24) 0.24
[ms] H 1324 (55) 1332 (68) 1357 (77) 0.76
Stride Length P 986 (30) 1016 (59) 1012 (87) 0.42
[mm] H 1026 (19) 1053 (50) 1088 (69) 0.20
Swing Velocity P 1.82(0.14) 1.74(0.13) 1.73(0.05) 0.53
[m/s] H 2.45(0.27) 2.25(0.16) 2.31(0.26) 0.38
Mean Velocity [m/s] 0.78(0.04) 0.78(0.06) 0.78(0.04) 0.93
ST Ratio 0.80(0.04) 0.87(0.05) 0.81(0.07) 0.15
SV Ratio 0.75(0.09) 0.78(0.07) 0.76(0.09) 0.79
Values: Mean (SD)
* P: Significance level of one way ANOVA (p < 0.05) - Post-hoc: Scheffè
P indicates the paretic side; H, the healthy one.
Ferrante et al. Journal of NeuroEngineering and Rehabilitation 2011, 8:47
/>Page 9 of 12
The post treatment evaluation was also characterized by
an increase of the swing velocity of the paretic leg (p <
0.01); this latter benefit was not maintained at follow-
up. All the gait parameters obtained by S2 were always
outside the normality ranges.
S3
In the pedaling assessment test carried out after treatment,
S3 decreased significantly his unbalance with respect to
the pre-test. This improvement was produced by a signifi-
cant reduction of the performance of both legs, particu-
larly the healthy one. The results obtained were
maintained at follow-up. In all the pedaling assessment
tests, S3 produced a significant difference with respect to
the healthy subject group in terms of unbalance.
The BF treatment induced a significant change in
terms of gait pattern timing also for S3: the stance and
swing time percentages with respect t o the stride time
significantly changed in the healthy leg (p = 0.04). This
adaptation of the healthy leg behavior corresponded to a
sligh tly longer stride length for both paretic and healthy
side. All these progresses were preserved at follow-up.
Among all spatio-temporal parameters reported in Table
4, only the stance and swing time of the paretic leg of S3
resulted to be always included in the normality ranges.
Figure5showsthedistributionofthe3patientswith
respect to the gait pattern categorization in the three
gait assessments. The gait performance obtained by S2
was so improved after treatment that he could change
his cluster. The new class was maintained at follow-up.
Discussion
The present work investigated the feasibility and utility
of a biofeedback cycling treatment and its effects on
cycling unbalance and walking parameters in three case
studies of chronic stroke patients. After having per-
formed a gait pattern categorization of a population of
153 chronic stroke patients, three participants, each of
them representative of one of the clusters in which the
population resulted to be divided, were enr olled in the
study: S1 presented a slow and almost symmetric gait;
S2, the most impaired one, was characterized by a very
asymmetrical and slow gait; S3 showed the strongest
and fastest gait, but still exhibited gait asymmetry due
to an overuse of the healthy limb. In our experimental
approach we tried to keep to the key ingredients for
motor functional recovery providing an intensive and
repetitive task training able to maintain a high active
involvement of the patie nts during the intervention [18].
Furthermore, to maximize patients’ involvement we
increased the task difficulty as participants’ skill
improved.
The results obtained by the three patients emphasized
the importance of developing biofeedback treatment
approaches that are effective in maximizing underlying
mechanisms responsible for neurological and adaptive
recovery in individuals with hemiparesis, even in chronic
state. The c hosen visual feedback resulted s imple to be
understood by patients. Indeed, as shown in Figure 4, all
patients improved their performance obtained during
the biofeedback phase.
The most appealing questions for the proposed treat-
ment are whether the effects obtained during the BF
phase can be maintained also when the exercise is per-
formed without the visual BF and most of all whether
the effects obtained on cycling symmetry can be trans-
lated to the walking performance. To reply to the first
question, it can be noticed that in the post-treatment
assessments all patients significantly reduced their ped-
aling unbalance with respect to baseline (Table 3). Con-
cerning the s econd question, the treatment, even short,
seems to produce some modifications on the gait kine-
matic pattern in two of the three chronic patients.
The most significant improvement was obtained by
S2, the patient who strengthened the most the paretic
side (he doubled W
PL
after training, see Table 3). This
subject was characterized by a very slow and asymmetri-
cal gait at baseline (mean velocity = 0.32 m/s; ST ratio
= 0.57 ± 0.05; SV ratio 0.53 ± 0.14). After treatment he
doubled the swing velocity of the paretic leg, meaning
that the patient started to produce the inertia to gener-
ate the step also with the paretic leg and started to
translate this inertia in distal propulsive force improving
the kinetic bot h at the foot and knee (results not
shown). This result is confirmed by a significant
improvement of gait symmetry that was also maintained
(SV ratio) or further increased (ST ratio) at follow-up.
In the post-treatment assessment, S2 obtained also a
Figure 5 The patients’ distribution in the identified clusters. S1,
S2 and S3 are the black, red and light blue points, respectively. The
pre-training, post-training and follow-up assessments are reported
with a circle, square and triangle, respectively.
Ferrante et al. Journal of NeuroEngineering and Rehabilitation 2011, 8:47
/>Page 10 of 12
significant increase of the mean gait speed that is a cru-
cial functional indicator of an improved walking ability
[30]. The sel f-selecte d speed of S2 incr eased of the 67%
with respect to baseline changing from 0.32 m/s to 0.51
m/s; this increase can be recognized as enough to
change from a category of a house hold walker to a full
community walker, and thus it can indicate a potential
improvement in the quality of life following the pro-
posed treatment [31].
The progress on walking velocity was preserved at fol-
low-up even if at lower levels, implying that a 2-week
treatment was probably not enough to induce perma-
nent changes in the walking ability of S2.
The biofeedback cycling treatment produced some
benefits also in the gait pattern of S3. He obtained a sig-
nificant change in the alternation of stance and swing
phases of the h ealthy limb, thus r educing the compensa-
tion strategy used during walking. This behavior was
exactly the same he adopted also to reduce unbalance
during cycling; indeed, he signific antly reduced the work
produced by the healthy limb. For this patient, the
improvements induced by the treatment were maintained
oneweekaftertheendoftheintervention.Thesignifi-
cant benefits obtained in pedaling unbalance were not
translated in a sign ificant im provement in gait sym metry
even if a slight increase of both SV a nd ST ratio were
obtained after treatment (see S3 results in Table 4).
Finally, S1 did not change her gait pattern after only 2
weeks of treatment and maintained her slow but safe and
almost symmetrical gait mostly due to a general hypoto-
nia. Thus, our hypothesis that such a BF treatment could
induce a general strengthen in S1 resulting in an increase
of her g ait speed was not valid. Our pre liminary results
seem to suggest that the proposed treatment was not use-
ful for a patient characterized by gait symmetry para-
meters included in the normality ranges before treatment.
The main limitation of this study is that all the pre-
sented results need to be substantiated by testing on a lar-
ger number of patients. Further more, the results seem to
suggest that the small number of sessions administered (n
= 6) is not enough to have a clear ide a about the training
potentiality in producing the carry-over effect from pedal-
ing to overground locomotion. In addition, our follow-up
assessment, very clo se to the end o f the trea tment, is no t
representative of a long term effect of training but gives
only a first indication about the maintenance of the
induced motor recovery. A t last, our study is limited to a
population of chronic stroke patients with mild spasticity
(Modified Ashworth Scale ≤ 2) and this does not cover the
whole stroke population [32].
Conclusions
The results of this study suggest that a treatment of only
6 days is able to produce improvements in terms of
pedaling unbalance and, sometimes, also in terms of
walking ability, but probably a more prolonged treat-
mentwouldbemoreeffectiveintranslatingprogresses
from pedaling performance into locomotor capability
and in m aintaining the results over time. Naturally, the
duration of the treatment has to be optimized depend-
ing on the specific patients’ condition in strict collabora-
tion with physicians. This study tries also to give some
suggestions about ho wtochoosepatients’ categories
which can avail themselves of the treatment. The treat-
ment seems to be beneficial for people with a very
asymmetrical and inefficient gait such as S2 and for peo-
ple that make an overuse of the healthy leg to compen-
sate for their asymmetry, like S3.
Certainly a more robust statistical study (e.g. rando-
mized controlled trial) is required to provide a clear evi-
dence that a pedaling treatment with visual biofeedback
significantly improves walking ability in chronic stroke
patients. To validate a carry-over effect from pedaling to
overground locomotion, a more prolonged treatment (e.
g. a 4-week intervention) will be tested on a targeted
category of individuals with stroke, i.e., patients included
in the initial cluster of S2, that are characterized by a
very asymmetrical and slow gait. If the effect is demon-
strated on a larger and controlled scale, the proposed
intervention, thanks to its safety and low price, could
really have an impact also as a home-rehabilitation
treatment for chronic stroke patients.
Abbreviations
ANOVA: analysis of variance; BF: biofeedback; EMG: electromyography; VOL1:
first phase of voluntary cycling without visual biofeedback; VOL2: second
phase of voluntary cycling without visual biofeedback; W
PL
: Work produced
by the paretic leg; W
HL
: Work produced by the healthy leg; T
PL
: Active
torque produced by the paretic leg; T
HL
: Active torque produced by the
healthy leg; W
PLMAX
: maximum work value produced by the paretic leg; U:
unbalance; ST ratio: the ratio between the stance time in percentage of the
stride time obtained by the paretic leg and the one obtained by the healthy
leg; SV ratio: the ratio between the swing velocity obtained by the paretic
leg and the one obtained by the healthy leg; BF
perf
: performance obtained
daily by the three patients during the BF phase; S1: Subject 1; S2: Subject 2;
S3: Subject 3; SD: standard deviation; IQR: interquartile range.
Acknowledgements and Funding
This work was supported by the Italian Institute of Technology (IIT).
Author details
1
NearLab, Bioengineering Department, Politecnico di Milano, Milano, Italy.
2
Villa Beretta, Rehabilitation Center, Valduce Hospital, Como, Italy.
Authors’ contributions
SF participated to study design, data collection and analysis, and manuscript
writing; EA participated to study design, data collection and analysis, and
manuscript definition; PR participated at data collection; EG participated at
data collection; FM participated to recruitment of stroke patients and
manuscript revision; GF participated to study design and manuscript
revision; AP participated to study design, and manus cript revision.
All authors read and approved the final manuscript.
Competing interests
The authors declare that they have no competing interests.
Ferrante et al. Journal of NeuroEngineering and Rehabilitation 2011, 8:47
/>Page 11 of 12
Received: 2 February 2011 Accepted: 24 August 2011
Published: 24 August 2011
References
1. Aminoff MJ, Greenberg DA, Simon RP: Clinical Neurology. McGraw- Hill/
Lange;, 6 2005.
2. Francescutti C, Mariotti S, Simon G, D’Errigo P, Di Bidino R: The impact of
stroke in Italy: first step for a national burden of disease study. Disability
and Rehabilitation 2005, 27(5):229-240.
3. Rossini PM, Calautti C, Pauri F, Baron JC: Post stroke plastic re-organization
in adult brain. Lancet Neurol 2003, 2(8):493-502.
4. Nelles G, Spiekermann G, Jueptner M, Leonhardt G, Muller S, Gerhard H,
Diener C: Reorganization of sensory and motor system in hemiplegic
stroke patients: a positron emission tomography study. Stroke 1999,
30:1510-6.
5. Cao Y, D’Olhaberriague L, Vikingstad EM, Levine SR, Welch KM: Pilot study
of functional MRI to assess cerebral activation of motor function after
post-stroke hemiparesis. Stroke 1998, 29:112-22.
6. Krakauer JW: Motor learning: its relevance to stroke recovery and
neurorehabilitation. Curr Opin Neurol 2006, 19(1):84-90.
7. Lotze M, Braun C, Birbaumer N, Anders S, Cohen LG: Motor learning
elicited by voluntary drive. Brain 2003, 126(4):866-872.
8. Langhorne P, Coupar F, Pollock A: Motor recovery after stroke: a
systematic review. Lancet Neurol 2009, 8(8):741-54.
9. Dickstein R: Rehabilitation of gait speed after stroke: a critical review of
intervention approaches. Neurorehabil Neural Repair 2008, 22(6):649-660.
10. Potempa K, Lopez M, Braun LT, Szidon JP, Fogg L, Tincknell T: Physiological
outcomes of aerobic exercise training in hemiparetic stroke patients.
Stroke 1995, 26(1):101-105.
11. Brown DA, Kautz SA: Increased workload enhances force output during
pedaling exercise in persons with poststroke hemiplegia. Stroke 1998,
29(3):598-606.
12. Brown DA, Nagpal S, Chi S: Limb-load cycling program for locomotor
intervention following stroke. Phys Ther 2005, 85(2):159-68.
13. Tang A, Sibley KM, Thomas SG, Bayley MT, Richardson D, McIlroy WE,
Brooks D: Effects of an aerobic exercise program on aerobic capacity,
spatiotemporal gait parameters, and functional capacity in subacute
stroke. Neurorehabil Neural Repair 2009, 23(4):398-406.
14. Raasch C, Zajac F: Locomotor strategy for pedaling: muscle groups and
biomechanical functions. J Neurophysiol 1999,
81:515-525.
15. Ting LH, Kautz SA, Brown DA, Zajac FE: Phase reversal of biomechanical
functions and muscle activity in backward pedaling. J Neurophysiol 1999,
81:544-551.
16. Sveistrup H: Motor rehabilitation using virtual reality. J Neuroengineering
and rehabilitation 2004, 10(1):10.
17. Riener R, Lünenburger L, Colombo G: Human-centered robotics applied to
gait training and assessment. J Rehabil Res Dev 2006, 43(5):679-694.
18. Huang H, Wolf SL, He J: Recent developments in biofeedback for
neuromotor rehabilitation. J Neuroeng Rehabil 2006, 3:11.
19. Wolf SL: Electromyographic biofeedback applications to stroke patients,
A critical review. Phys Ther 1983, 63:1448-1459.
20. Brown DA, DeBacher GA: Bicycle ergometer and electromyographic
feedback for treatment of muscle imbalance in patients with spastic
hemiparesis. Suggestion from the field. Phys Ther 1987, 67(11):1715-1719.
21. McRae CGA, Johnston TE, Lauer RT, Tokay AM, Lee SCK, Hunt KJ: Cycling
for children with neuromuscular impairments using electrical
stimulation-development of tricycle- based systems. Med Eng Phys 2009,
31(6):650-9.
22. Chen HY, Chen SC, Jason Chen JJ, Fu LL, Wang YL: Kinesiological and
kinematical analysis for stroke subjects with asymmetrical cycling
movement patterns. J Electromyogr Kinesiol 2005, 15(6):587-595.
23. Ambrosini E, Ferrante S, Schauer T, Ferrigno G, Molteni F, Pedrocchi A:
Design of a symmetry controller for cycling induced by electrical
stimulation - Preliminary results on post-acute stroke patients. Artificial
Organs 2010, 34(8):663-667.
24. Patterson KK, Gage WH, Brooks D, Black SE, McIlroy WE: Evaluation of gait
symmetry after stroke: a comparison of current methods and
recommendations for standardization. Gait Posture 2010, 31(2):241-246.
25. Comolli L, Ferrante S, Pedrocchi A, Bocciolone M, Ferrigno G, Molteni F:
Metrological characterization of a cycle ergometer to optimise the
cycling induced by functional electrical stimulation on patients with
stroke. Med Eng & Phys 2010, 32:339-348.
26. Carda S, Bertoni M, Zerbinati P, Rossini M, Magoni L, Molteni F: Gait
changes after tendon functional surgery for equinovarus foot in patients
with stroke: assessment of temporo- spatial, kinetic, and kinematic
parameters in 177 patients. Am J Phys Med Rehabil 2009, 88(4):292-301.
27. Mulroy S, Gronley J, Weiss W, Newsam C, Perry J: Use of cluster analysis
for gait pattern classificationof patients in the early and late recovery
phases following stroke. Gait Posture 2003, 18:114-25.
28. Rousseeuw PJ: Silhouettes: a Graphical Aid to the Interpretation and
Validation of Cluster Analysis. Computational and Applied Mathematics
1987, 20:53-65.
29. Frigo C, Rabuffetti M, Kerrigan DC, Deming LC, Pedotti A: Functionally
oriented and clinically feasible quantitative gait analysis method. Med
Biol Eng Comput 1998, 36:179-185.
30. Bowden MG, Balasubramanian CK, Behrman AL, Kautz SA: Validation of a
speed-based classification system using quantitative measures of
walking performance poststroke. Neurorehabilitation and Neural Repair
2008, 22:672-675.
31. Jonsdottir J, Cattaneo D, Recalcati M, Regola A, Rabuffetti M, Ferrarin M,
Casiraghi A: Task- oriented biofeedback to improve gait in individuals
with chronic stroke: motor learning approach. Neurorahabilitation and
Neural Repair 2010, 24(5):478-485.
32. Brainin M, Norrving B, Sunnerhagen KS, Goldstein LB, Cramer SC,
Donnan GA, Duncan PW, Francisco G, Good D, Graham G, Kissela BM,
Olver J, Ward A, Wissel J, Zorowitz R, International PSS Disability Study
Group: Poststroke chronic disease management: towards improved
identification and interventions for poststroke spasticity- related
complications. International Journal of Stroke 2011, 6:42-46.
doi:10.1186/1743-0003-8-47
Cite this article as: Ferrante et al.: A biofeedback cycling training to
improve locomotion: a case series study based on gait pattern
classification of 153 chronic stroke patients. Journal of NeuroEngineering
and Rehabilitation 2011 8:47.
Submit your next manuscript to BioMed Central
and take full advantage of:
• Convenient online submission
• Thorough peer review
• No space constraints or color figure charges
• Immediate publication on acceptance
• Inclusion in PubMed, CAS, Scopus and Google Scholar
• Research which is freely available for redistribution
Submit your manuscript at
www.biomedcentral.com/submit
Ferrante et al. Journal of NeuroEngineering and Rehabilitation 2011, 8:47
/>Page 12 of 12