Báo cáo hóa học: " Gait characteristics of subjects with chronic fatigue syndrome and controls at self-selected and matched velocities" pdf
Bạn đang xem bản rút gọn của tài liệu. Xem và tải ngay bản đầy đủ của tài liệu tại đây (226.26 KB, 7 trang )
BioMed Central
Page 1 of 7
(page number not for citation purposes)
Journal of NeuroEngineering and
Rehabilitation
Open Access
Research
Gait characteristics of subjects with chronic fatigue syndrome and
controls at self-selected and matched velocities
Lorna Paul
1
, Danny Rafferty*
2
, Leslie Wood
3
and William Maclaren
4
Address:
1
Nursing and Health Care – Faculty of Medicine, University of Glasgow, Glasgow, UK,
2
School of Health & Social Care, Glasgow
Caledonian University, Glasgow, UK,
3
School of Life Sciences, Glasgow Caledonian University, Glasgow, UK and
4
School of Engineering and
Computing, Glasgow Caledonian University, Glasgow, UK
Email: Lorna Paul - ; Danny Rafferty* - ; Leslie Wood - ;
William Maclaren -
* Corresponding author
Abstract
Background: Gait abnormalities have been reported in individuals with Chronic Fatigue
Syndrome (CFS) however no studies exist to date investigating the kinematics of individuals with
CFS in over-ground gait. The aim of this study was to compare the over-ground gait pattern
(sagittal kinematics and temporal and spatial) of individuals with CFS and control subjects at their
self-selected and at matched velocities.
Methods: Twelve individuals with CFS and 12 matched controls participated in the study. Each
subject walked along a 7.2 m walkway three times at each of three velocities: self-selected, relatively
slow (0.45 ms
-1
) and a relatively fast (1.34 ms
-1
). A motion analysis system was used to investigate
the sagittal plane joint kinematics and temporal spatial parameters of gait.
Results: At self-selected velocity there were significant differences between the two groups for all
the temporal and spatial parameters measured, including gait velocity (P = 0.002). For the kinematic
variables the significant differences were related to both ankles during swing and the right ankle
during stance. At the relatively slower velocity the kinematic differences were replicated. However,
the step distances decreased in the CFS population for the temporal and spatial parameters. When
the gait pattern of the individuals with CFS at the relatively fast walking velocity (1.30 ± 0.24 ms
-1
)
was compared to the control subjects at their self-selected velocity (1.32 ± 0.15 ms
-1
) the gait
pattern of the two groups was very similar, with the exception of both ankles during swing.
Conclusion: The self-selected gait velocity and/or pattern of individuals with CFS may be used to
monitor the disease process or evaluate therapeutic intervention. These differences may be a
reflection of the relatively low self-selected gait velocity of individuals with CFS rather than a
manifestation of the condition itself.
Background
Chronic Fatigue Syndrome (CFS) is thought to have a
population prevalence of around 0.5% [1]. Although CFS
is a recognised clinical condition the aetiology and
pathology remain uncertain and consequently there is no
specific diagnostic test for CFS. Recent research, however,
has reported alterations in the expression of 16 specific
genes in those with CFS, suggesting a pathology involving
Published: 27 May 2008
Journal of NeuroEngineering and Rehabilitation 2008, 5:16 doi:10.1186/1743-0003-5-16
Received: 12 September 2006
Accepted: 27 May 2008
This article is available from: />© 2008 Paul et al; licensee BioMed Central Ltd.
This is an Open Access article distributed under the terms of the Creative Commons Attribution License ( />),
which permits unrestricted use, distribution, and reproduction in any medium, provided the original work is properly cited.
Journal of NeuroEngineering and Rehabilitation 2008, 5:16 />Page 2 of 7
(page number not for citation purposes)
T cell activation and irregularities in neuronal and mito-
chondrial function [2].
Although there is no mortality associated with the condi-
tion, a recent systematic review suggested that only
around seven percent of sufferers experience a full recov-
ery whilst just under 40% report some improvement over
time [3]. Thus the effects of CFS can lead to significant and
prolonged functional disability.
Whilst there is a clinical impression that those with CFS
display a different gait pattern compared to their healthy
peers there is a paucity of studies investigating the effect of
CFS on gait. Boda et al [4] examined the gait pattern of 11
individuals with CFS as they walked on a treadmill at
three different velocities 0.45 ms
-1
, 0.89 ms
-1
and 1.34 ms
-
1
. The researchers identified that those with CFS displayed
significant differences in a number of the kinematic varia-
bles compared to the healthy control group. Specifically
they reported reduced knee flexion during stance and
swing at the slower velocity (0.45 ms
-1
) and increased hip
flexion during stance and swing phases at the faster veloc-
ity (1.34 ms
-1
). Whilst it is interesting to compare the kin-
ematics of gait at a number of different velocities the study
utilised a treadmill for walking and the debate continues
as to whether the gait pattern during treadmill walking is
indeed comparable to over-ground walking [5-7].
Paul et al. [8] used a pressure sensitive, instrumented
walkway to examine the temporal and spatial gait param-
eters of individuals with and without CFS before, and at
intervals up to 24 hours after a 15 minute period of exer-
cise. The results of the study suggested that, overall, there
was a significant difference between the two groups with
respect to step distance and step time on both right and
left sides, single support time on the right, velocity and
cadence. Although the data suggested changes in the tem-
poral and spatial parameters at preferred walking pace
these could have been influenced by the reduced over-
ground walking velocity in individuals with CFS rather
than changes due to the condition.
The aim of this study was to compare the sagittal joint kin-
ematics and the temporal and spatial parameters of gait
during over-ground walking at three velocities: self-
selected, 0.45 ms
-1
and 1.34 ms
-1
between individuals
with CFS and a control group. The two latter velocities
correspond to the velocities previously examined [4] and
are relatively slower and faster respectively than the pre-
ferred walking velocity of individuals with CFS (1.05 ms
-
1
) already reported [8]. It is important to examine the joint
kinematics at matched velocities to assess where any dif-
ferences occur, and from a rehabilitation perspective,
allow clinicians to plan more effective and focussed treat-
ment programmes.
Methods
Subjects
Twelve individuals with CFS (aged 52.2 ± 11.3 years) and
12 age and sex matched control subjects (aged 52.8 ± 11.8
years) participated. The individuals with CFS were
recruited from three local CFS support groups and had a
diagnosis of CFS confirmed by their medical practitioner.
The control subjects were a convenience sample of Uni-
versity staff and friends. For both the individuals with CFS
and control group subjects were excluded from the study
if they suffered from significant orthopaedic, neurological
or cardiovascular problems which may affect their gait
pattern. The mean height of the individuals with CFS and
control group were 163.0 cm (± 9.2) and 166.0 cm (± 7.1)
respectively and this difference was not statistically signif-
icant (p = 0.209). Similarly there were no statistically sig-
nificant differences between the two groups in terms of
body mass (controls 70.1 ± 7.4 kg and CFS 68.5 ± 10.9 kg;
p = 0.644). The individuals with CFS had been suffering
from the condition for an average of 13.6 years ± 4.5
years). From the SF-36, the mean physical functioning
score of the CFS group was 27.9 (± 19.7) [9]. Of the 12
individuals with CFS 3 had taken early retirement due to
their condition, 8 were unable to work and received state
benefits and only one person was able to work part time.
In terms of walking aids only three of the twelve individ-
uals with CFS occasionally walked with a walking stick but
no one in the control group required any walking aids.
During the data collection none of the individuals with
CFS used their walking aid.
Ethical approval
The study was approved by South Glasgow University
Hospital's Ethics Committee and all subjects gave written
consent before participating in the study. All subjects were
required to attend the Glasgow Caledonian University's
Clinical Research Centre within the South Glasgow Uni-
versity Hospital for testing.
Procedure
Each subject completed three successful trials at the three
velocities; their preferred walking velocity, and then two
controlled velocities: a slower velocity and a faster veloc-
ity. For the controlled velocities the subjects were expected
to cover 7.2 m from a standing start and stopping after 16
and 5.4 seconds respectively, indicative of averaging walk-
ing velocity of 0.45 ms
-1
and 1.34 ms
-1
. The order of tests
was the same for each subject (preferred, slow and then
fast). A seat was positioned at the beginning of the walk-
way and all subjects, especially the individuals with CFS
were encouraged to rest as required; between each test
and/or each velocity. For the set velocities an audible tone
was generated on a PC using PowerPoint (Microsoft Cor-
poration) slide transition advance facility to signal the
subject to begin walking and a further tone when the sub-
Journal of NeuroEngineering and Rehabilitation 2008, 5:16 />Page 3 of 7
(page number not for citation purposes)
ject should have reached the end of the walk. Prior to data
collection the subjects were given clear instruction, dem-
onstration and practice if necessary of the gait velocity
required. If the subject did not reach the end of the walk-
way as the finish tone occurred the trial was repeated.
Gait analysis was conducted using a seven camera Qual-
isys Motion Analysis System (Qualisys Medical AB, Esper-
antoplatsen 7–9, S-411 19 Gothenburg, SWEDEN).
Subjects wore cycling shorts and spherical reflective mark-
ers were attached to the pelvis and lower limbs. The ana-
tomical landmarks for marker attachment were the
anterior superior iliac spine (ASIS), the greater trochanter
(GT), the lateral femoral condyle (LFC), the lateral malle-
olus (LM) and the base of the fifth metatarsal (FM). Data
were collected at 60 Hz and the system calibrated to col-
lected a volume of 5.0 (sagittal plane – X axis – direction
of travel) by 1.5 (Z axis – vertical) by 1.0 (Y axis – coronal
plane) metres using Qualysis TrackManager. Only calibra-
tions with average residuals of less than 1.5 mm in all
cameras were accepted prior to data collection. Kinematic
parameters were calculated using Visual 3D (Version
3.28) (C-Motion, Inc., 15821-A Crabbs Branch Way,
Rockville, MD 20855, USA). Virtual markers were created
for the medial femoral condyle (VMFC), medial malleo-
lus (VMM), and first metatarsal (VFM) from anthropo-
metric data taken from each participant. All marker data
were low-pass filtered using a 4
th
order Butterworth filter
with cut-off frequency of 6 Hz, and interpolated with a
maximum gap fill of 5 frames using a 3
rd
order polyno-
mial. The body segments were defined using the ASIS and
GT for the pelvis; GT, LFC, and VMFC, with radius deter-
mined by anthropometic data from each subject, for the
thigh; LFC, VFMC, LM, VMM for the shank; and LM,
VMM, FM and VFM for the foot. Hip angle was defined as
the Cardan (default setting for Visual 3D) representation
between the proximal pelvis and distal thigh; knee angle
between proximal thigh and distal shank; and ankle angle
between proximal shank and distal foot. All proximal seg-
ments were considered as the reference segment. Joint
angles were normalised to the joint angles during quiet
standing (the angle measured at each joint during quiet
standing were considered to be the joint in neutral and all
subsequent measures expressed relative to that), collected
for a duration of 1s before the gait collection for each sub-
ject. Only successfully interpolated data were included in
the analysis. A successful trial was considered to be one
which required no interpolation of the marker trajectories
and no markers were obscured during collection. Most
subjects completed this in their 1
st
three trials at each
velocity however 2 controls and 3 individuals with CFS
required 4 trials (1 fast and 1 self selected, and 1 fast and
two self selected respectively). Time events were generated
from visual inspection of the modelled gait for initial con-
tact (when the lateral malleolus became static in the X
direction) and final contact (when the 5
th
metatarsal
started to move forward in the X direction) for both sides.
Stance phase was defined as initial contact on one side to
final contact on the ipsilateral side and swing phase was
final contact to initial contact. Joint angles were calculated
for stance and swing phases. All data were normalised in
the time domain to 100% for each phase. One stride per
side per trial for each velocity were averaged and sagittal
peak to peak range of motion for stance and swing phases
analysed.
Data analysis
Data were checked and entered to Excel spreadsheets, then
imported to the GenStat statistical package (GenStat
Committee, Oxford 2005). The mean and standard devia-
tion of each spatial and temporal parameter and each kin-
ematic parameter were calculated for individuals with CFS
and controls separately, at each of the walking velocities.
A Manova (Multivariate analysis of variance) was carried
out comparing individuals with subjects with CFS and
controls. Manovas were performed on the following
Table 1: Temporal and spatial parameters of gait of both the individuals with CFS and control group. Temporal and spatial parameters
of gait of both the individuals with CFS and control subjects at self selected pace, at the slower matched velocity and at faster matched
velocity. R = Right side of the body and L = left side of the body. NS represents a non significant result from the MANOVA, reported P
values are those calculated from resulting paired t-tests between individuals with CFS and controls.
Self Selected Slower matched velocity Faster matched velocity
Parameter CFS Control p value CFS Control p value CFS Control p value
Velocity (ms
-1
) 0.99 1.32 0.002 0.46 0.48 NS 1.3 1.31 NS
Step distance R (cm) 55.8 64.9 0.037 42.1 46.1 0.003 65.3 64.9 NS
Step distance L (cm) 55.5 65.7 0.010 41.5 48.2 0.047 62.8 65.7 NS
Step time R (s) 0.57 0.50 0.002 0.92 0.97 NS 0.49 0.50 NS
Step time L (s) 0.58 0.51 0.002 0.92 0.99 NS 0.48 0.51 NS
Single support R (s) 0.44 0.39 0.003 0.62 0.66 NS 0.39 0.39 NS
Single support L (s) 0.45 0.39 0.010 0.63 0.63 NS 0.41 0.39 NS
Double support (s) 0.26 0.21 0.017 0.59 0.68 NS 0.19 0.21 NS
Cadence (steps/min) 105 120 0.001 68 63 NS 124 120 NS
Journal of NeuroEngineering and Rehabilitation 2008, 5:16 />Page 4 of 7
(page number not for citation purposes)
parameters. Step Distance; Step Time; Single and Double
Support Time; and range of movement at hip; knee and
ankle. Within each Manova results for both right and left
sides were grouped, in addition for Manovas on kinematic
data results for both stance and swing phases were
grouped. This approach resolves many issues regarding
multiple comparisons. The Manova performs two tests;
Status of case-control (CFS versus control), of velocity
(self-selected versus slower versus faster). If the Manova
was non-significant then no further tests were performed.
Where a Manova test yielded a significant result (P < 0.05)
then paired t-tests were conducted on those variables. A
difference between the two groups was regarded as statis-
tically significant for the paired t-test if P < 0.05.
Results
Self-selected velocity
The mean self-selected velocity of the CFS and control
groups was 0.99 ms
-1
(± 0.27 ms
-1
) and 1.32 ms
-1
(± 0.15
ms
-1
) respectively (P = 0.002), At the self-selected velocity
there was a significant difference between the two groups
for all the temporal and spatial variables (Table 1). These
results were very similar to those previously reported [8].
Results of the MANOVAs and appropriate follow up
paired t-test are presented in Table 2. Analysis of the kine-
matic variables at self-selected velocities indicated that the
group mean joint excursion was generally less for individ-
uals with CFS than the controls. The range of movement
at the ankle during swing phase, for both sides, showed a
significant reduction for the individuals with CFS in com-
parison to the controls. For the right ankle there was a sig-
nificant, though marginal, reduction in range of
movement during the stance phase (P = 0.049).
Thus it does appear that there are a number of significant
gait differences between individuals with CFS and control
subjects at their self-selected velocity. All temporal and
spatial parameters showed a significant reduction, and
although not significant for many of the kinematic param-
eters all but one showed a reduction in the range of
motion for the individuals with CFS.
However as previously stated the self selected velocity of
the individuals with CFS was significantly slower than
that of their matched control and, as many gait parame-
ters are dependent on velocity it was important to com-
pare subsequently the two groups at matched velocities
[10-13]. The protocol used in this study aimed to compare
the gait patterns at a slower walking velocity (0.45 ms
-1
)
and a faster velocity (1.34 ms
-1
). However although the
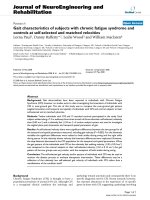
average walking velocity along the total walkway was
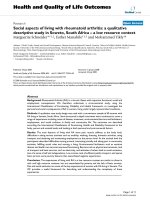
close to the desired velocity it can be seen from Figure 1
that, when the data were captured i.e. around the middle
of the 7.2 m walkway, there was an obvious difference in
walking velocity between the two groups at the faster
velocity. Any differences which were found between the
individuals with CFS and controls group at this faster
velocity may have been a reflection of the difference in
velocity. Therefore it was decided only to analyse the
Table 2: Kinematic variables (degrees) of gait for both the individuals with CFS and control subjects. Kinematic variables (in degrees)
of gait for both the individuals with CFS and control subjects at Self selected velocity, at the slower matched velocity and at the faster
matched velocity. Results are given for both the right and left sides. All values given represent the group mean range of movement of
each of the lower limb joints during both stance and swing phase. NS represents a non significant result from the MANOVA, reported
P values are those calculated from resulting paired t-tests between individuals with CFS and controls.
Self – selected velocity Slower matched velocity Faster matched velocity
ROM (degrees)
Right
CFS Control p value CFS Control p value CFS Control p value
Hip stance 35.2 39.4 NS 28.6 32.3 NS 39.1 39.4 NS
Hip swing 32.9 37.4 NS 25.5 30.7 NS 37.3 37.4 NS
Knee stance 22.1 22.1 NS 22.0 22.2 NS 23.5 22.1 NS
Knee swing 53.3 59.3 NS 47.4 53.7 NS 54.6 59.3 NS
Ankle stance 12.6 16.8 0.049 14.5 21.4 0.014 13.6 16.9 NS
Ankle swing 11.5 20.9 <0.001 11.9 19.4 0.001 14.6 20.9 0.001
ROM (Degrees)
Left
CFS Control p value CFS Control p value CFS Control p value
Hip stance 38.0 40.2 NS 31.2 30.7 NS 41.3 40.2 NS
Hip swing 35.2 37.8 NS 27.1 30.3 NS 38.5 37.8 NS
Knee stance 22.3 22.5 NS 23.7 20.1 NS 22.1 22.6 NS
Knee swing 53.7 60.1 NS 49.1 53.8 NS 54.0 60.1 NS
Ankle stance 16.3 17.8 NS 18.2 20.5 NS 16.8 17.8 NS
Ankle swing 13.9 22.0 0.008 12.9 18.5 0.032 15.9 22.0 0.010
Journal of NeuroEngineering and Rehabilitation 2008, 5:16 />Page 5 of 7
(page number not for citation purposes)
slower velocity, and also to compare the individuals with
CFS at the faster walking velocity with the controls at their
self-selected walking velocity, where both groups were
closely matched in terms of walking velocity.
Matched Velocities
There was no statistical difference in walking velocity
between the two groups at the slower velocity (P = 0.120).
In terms of the temporal and spatial parameters, the only
statistical difference between the two groups, CFS and
controls, was a reduction in the step distance of both right
and left sides. There were no statistical differences
observed in any of the other temporal and spatial gait
parameters (Table 1). With regards the kinematic results
the pattern of differences between the two groups was
similar to that observed at the self selected velocity i.e. a
reduction in the group mean range of movement of the
right ankle during both swing and stance phases and the
left ankle during swing phase (Table 2).
There was no statistical difference in walking velocity
when comparing the individuals with CFS at the faster
velocity (1.30 ± 0.24 ms
-1
) and the Controls at their self-
selected walking velocity (1.32 ± 0.15 ms
-1
) (p = 0.781).
No statistical differences were observed for any of the tem-
poral and spatial parameters (Table 1). For the kinematic
data the only statistical differences were observed as a
reduction in the range of movement of both ankles during
the swing phase (Table 2).
Thus overall the results of this study suggest that, at self-
selected velocity, the gait pattern of those with CFS is quite
different to that of healthy controls but many of the differ-
ences observed may be a direct result of the relatively slow
self-selected gait velocity of the individuals with CFS.
When the walking velocities of the two groups were
matched during a relatively slow gait velocity there were
fewer differences in the temporal, spatial parameters.
More importantly, however, when the individuals with
CFS subjects were matched to a more 'normal' gait veloc-
ity, the two groups displayed a similar gait pattern which
suggests that the observed differences between the groups
at self-selected velocity may have been primarily a reflec-
tion of the relatively slow walking velocity of the individ-
uals with CFS. The range of ankle motion during the
swing phase of gait was the only kinematic consistently
lower for individuals with CFS regardless of the velocity of
the walk.
Discussion
One of the most obvious results of the present study was
a statistically significant difference in the self-selected
walking velocities of the CFS and control groups. Indeed
the CFS group exhibited an average self-selected walking
velocity of 0.99 ms
-1
(SD ± 0.27) which is below the nor-
mal walking velocity of around 1.2–1.4 ms
-1
and is com-
parable to the walking velocity of above knee amputees
[14]. The differences appear to be mainly in the temporal
and spatial parameters with the CFS subjects taking
smaller and slower steps compared to the controls. These
temporal and spatial differences are consistent with those
previously reported [8]. Kinematic data suggest the altered
gait pattern may be a result of reduced range of movement
of the lower limb joints, although not significant other
than ankle range of motion during swing phase for both
sides and marginally during stance for the right side,
cumulatively these reductions in range of motion at the
joints result in an altered gait pattern. This study confirms
previous work that those who suffer from CFS have an
altered self selected gait pattern.
The cause of the gait differences cannot be inferred from
the present study however work to investigate this is cur-
rently underway. Chronic Fatigue Syndrome has a com-
plex presentation, characterised by a variety of physical
signs and symptoms which may alone, or in combination,
affect the gait pattern of those with CFS. For example pain
may be a significant factor affecting the way people with
CFS walk. Very little is known about the pain pattern of
those with CFS and, critically for the present study,
whether it follows a symmetrical or asymmetrical presen-
tation. Boda et al. [4] proposed that the gait differences
they observed between CFS subjects and controls could be
due to altered balance mechanisms, peripheral neu-
romuscular dysfunction and/or neurological abnormali-
The group means (and standard deviation) of the gait velocity obtained at the different velocitiesFigure 1
The group means (and standard deviation) of the gait
velocity obtained at the different velocities. The actual
group mean (and standard deviation) of the gait velocity
obtained at each of the different testing velocities (self
selected, slower matched velocity and faster matched veloc-
ity. CFS subjects are shown in black and controls in white.
NS represents non-significant differences and * denotes a sig-
nificant difference.
Journal of NeuroEngineering and Rehabilitation 2008, 5:16 />Page 6 of 7
(page number not for citation purposes)
ties in those with CFS. It would seem reasonable that any
of these factors could explain the differences we observed.
For example Sieminonow et al. [15] reported a greater
level of cortical activation required to undertake voluntary
tasks for those with CFS compared to healthy subjects.
The increased effort required for walking in those with
CFS might lead to greater central contribution to muscle
fatigue and may explain the differences in step length
between the CFS and control subjects. One way to investi-
gate this central contribution to fatigue may be to monitor
changes in spinal motoneuronal activity following fatigu-
ing exercise in the CFS group, and this is currently being
undertaken by our group.
As already stated, the self-selected gait velocity was signif-
icantly lower in the CFS group compared to the control
subjects. It is likely that the individuals with CFS adopt a
slower self selected walking velocity to reduce their energy
expenditure when walking however although the energy
expenditure is reduced it is known that slower walking
speeds are less efficient and that overall the metabolic cost
of walking increases at slower, and also faster, walking
velocities [14,16,17]. Thus the slower self-selected veloc-
ity may in itself increase the overall effort required for nor-
mal walking in those with CFS. Investigating the
physiological cost of walking is relatively straightforward
with current gas analysis equipment and our group are
currently investigating the physiological cost of over-
ground walking in CFS sufferers as a follow up to the
present study.
When the walking velocity was matched between the two
groups at the slower velocity (0.45 ms
-1
) it was found that
the only difference in the temporal and spatial parameters
was the step distances on both sides. Furthermore the kin-
ematic profile at matched (slow) walking velocities was
very similar to the data obtained at the self-selected veloc-
ity in that the differences were observed in the range of
movement of the ankle during both the stance (right side
only) and swing phases of gait. There are very few studies
which have examined the gait patterns of subjects with
CFS. Boda et al [4] examined CFS and control subjects
walking on a treadmill at the same slow walking velocity
used in the present study (0.45 ms
-1
). They reported that
the CFS group utilised shorter steps than the controls and
this is consistent with the results of the present study. They
suggested that this difference was due to reduced flexion
at both hips and knees of the CFS group. However, the
kinematic results of the present study found differences
only at both ankles during swing and at the right ankle
during stance. These differences in the kinematic parame-
ters between the two studies may be related to the fact that
subjects in the study by Boda et al. [4] were walking on a
treadmill whereas in the present study the subjects were
walking over-ground. Whilst the debate over the associa-
tion between the gait pattern of over-ground and tread-
mill walking continues [5,18] it is true that one of the
main advantages of the treadmill is that walking velocity
can be more accurately standardised and therefore
matched between subjects. In the current study we were
unable to directly compare subjects at the faster velocity
(1.34 ms
-1
) as the achieved gait velocity was statistically
different between the two groups. Treadmill walking
would have allowed better control of faster walking veloc-
ities but may have changed the natural gait pattern which
we wished to observe.
These results therefore appear to suggest that there are gait
differences between the CFS and control group and this
may be due to the factors already discussed in relation to
self-selected velocity. However this comparison was made
at a relatively slow walking velocity (0.45 ms
-1
) which
would not reflect normal activity.
Perhaps the key finding of the present study was that
when performing a more functionally relevant compari-
son: that of the control subjects at their self selected veloc-
ity to the CFS subjects at their faster walking velocity
(which represented a 'normal' velocity) results revealed
very similar gait patterns between the two groups. The
only parameter which showed a statistically significant
difference was the ankle range of movement during swing
for both legs which may suggest peripheral muscle weak-
ness although this cannot be specifically inferred from the
present results. Thus it appears that this sample of CFS
subjects are able to walk at a 'normal' gait velocity, with a
'normal' kinematic gait pattern but for whatever reasons
they do not do so.
As with many studies in this area one of the main limita-
tions is the small sample recruited for the study. Individ-
uals in the CFS group were not specifically asked if they
also had fibromyalgia, a condition with many overlap-
ping symptoms to CFS. Pain is the primary feature of
fibromyalgia and may have affected the gait in some indi-
viduals, however the presence or extent of gait abnormal-
ity in those with fibromyalgia is unknown.
Conclusion
It appears that those with CFS exhibit an altered gait pat-
tern compared to healthy controls at self-selected velocity
confirming previous studies and clinical reports of altered
gait in CFS. However when CFS subjects increase their
walking velocity they are able to attain a more 'normal'
gait pattern for sagittal kinematic and temporal-spatial
parameters. Further research is required to investigate the
underlying cause of these gait differences in CFS and the
physiological cost and kinetics of walking at self-selected
and matched velocities in order that therapeutic interven-
Publish with BioMed Central and every
scientist can read your work free of charge
"BioMed Central will be the most significant development for
disseminating the results of biomedical research in our lifetime."
Sir Paul Nurse, Cancer Research UK
Your research papers will be:
available free of charge to the entire biomedical community
peer reviewed and published immediately upon acceptance
cited in PubMed and archived on PubMed Central
yours — you keep the copyright
Submit your manuscript here:
/>BioMedcentral
Journal of NeuroEngineering and Rehabilitation 2008, 5:16 />Page 7 of 7
(page number not for citation purposes)
tions can be effectively implemented to encourage a more
normal and efficient gait pattern in this group of people.
Competing interests
The authors declare that they have no competing interests.
Authors' contributions
LP contributed to the design, data collection, clinical rele-
vance, and analysis of the data presented.
DR contributed to the design, data collection, technical
aspects of the measurements, and analysis of the data pre-
sented.
LW contributed to the design, data collection, physiologi-
cal interpretation, and analysis of the data presented.
WMacL contributed to the design, and statistical analysis
of the data presented.
All Authors have read and approved final manuscript
Acknowledgements
The authors would like to acknowledge all the subjects who participated in
this study and Ms Rebecca Marshal for her assistance in analysing the SF36
questionnaire.
References
1. Fukuda K, Struas SE, Hickie I, Sharpe MS, Dobbins JG, Komaroff A:
The chronic fatigue syndrome; a comprehensive approach
to its definition and study. Ann Intern Med 1994, 121:953-959.
2. Kaushik N, Fear D, Richards SCM, McDermott CR, Nuwaysir EF, Kel-
lam P, Harrison TJ, Wilkinson RJ, Tyrrell AJ, Holgate ST, Kerr JR:
Gene expression in peripheral blood mononuclear cells from
patients with chronic fatigue syndrome. J Clin Pathol 2005,
58:826-832.
3. Cairns R, Hotopf M: A systematic review describing the prog-
nosis of chronic fatigue syndrome. Occup Med (Lond) 2005,
55:20-31.
4. Boda WL, Natelson BH, Sisto SA, Tapp WN: Gait abnormalities in
chronic fatigue syndrome. J Neurol Sci 1995, 131:156-161.
5. Alton F, Baldey L, Caplan S, Morrissey MC: A kinematic compari-
son of overground and treadmill walking. Clin Biomech (Bristol,
Avon) 1998, 13(6):434-440.
6. Murray MP, Spurr GB, Sepic SB, Gardner GM, Mollinger LA: Tread-
mill vs floor walking; kinematics, electromyogram and heart
rate. J App Phys 1985, 59(1):89-91.
7. Strathy GM, Chao EY, Laughman RK: Changes in knee function
associated with treadmill ambulation. J Biomech 1983,
6:517-522.
8. Paul LM, Wood L, Maclaren W: The effect of exercise on gait and
balance in patients with chronic fatigue syndrome. Gait Pos-
ture 2001, 14:19-27.
9. Ware JE, Sherbourne CD: The MOS 36-item short-form health
survey (SF-36). Med Care 1992, 30:473-483.
10. Winter DA: The biomechanics and motor control of human
gait: normal, elderly and pathological. second edition. Water-
loo, Ontario: University of Waterloo Press; 1991.
11. Murray MP, Kory RC, Clarkson BH, Sepic SB: Comparison of free
and fast speed walking patterns of normal men. Am J Phys Med
1996, 45(1):8-23.
12. Murray MP, Kory RC, Sepic SB: Walking patterns of normal
women. Arch Phys Med Rehabil
1970, 51:637-650.
13. Kim CM, Eng JJ: Magnitude and pattern of 3D kinematic and
kinetic gait profiles in persons with stroke; relationship to
walking speed. Gait Posture 2004, 20:140-146.
14. Tesio L, Roi GS, Moller F: Pathological gaits: inefficiency is not
a rule. Clin Biomech 1991, 6:47-50.
15. Siemionow V, Fang Y, Calabrese L, Sahgal V, Yue GH: Altered cen-
tral nervous system signal during motor performance in
chronic fatigue syndrome. Clin Neurophysiol 2004,
15(10):2372-2381.
16. Zamparo P, Francescato MP, De Luca G, Lovati L, Di Prampero PE:
The energy cost of level walking in patients with hemiplegia.
Scand J Med Sci Sports 1995, 5:348-52.
17. Danielsson A, Sunnerhagen KS: Energy expenditure in stroke
subjects walking with a carbon composite ankle foot ortho-
sis. J Rehabil Med 2004, 36:165-169.
18. Bayat R, Barbeau H, Lamontagne A: Speed and Temporal-Dis-
tance Adaptations during Treadmill and Overground Walk-
ing Following Stroke. Neurorehabil Neural Repair 2005,
19:115-124.