Báo cáo hóa học: " Movement variability in stroke patients and controls performing two upper limb functional tasks: a new assessment methodology" docx
Bạn đang xem bản rút gọn của tài liệu. Xem và tải ngay bản đầy đủ của tài liệu tại đây (509.71 KB, 12 trang )
BioMed Central
Page 1 of 12
(page number not for citation purposes)
Journal of NeuroEngineering and
Rehabilitation
Open Access
Research
Movement variability in stroke patients and controls performing
two upper limb functional tasks: a new assessment methodology
Sibylle B Thies*
1
, Phil A Tresadern
1
, Laurence P Kenney
1
, Joel Smith
1
,
David Howard
1
, John Y Goulermas
2
, Christine Smith
1
and Julie Rigby
1
Address:
1
Centre for Rehabilitation and Human Performance Research, University of Salford, Salford, Greater Manchester, UK and
2
Department
of Electrical Engineering and Electronics, University of Liverpool, Liverpool, UK
Email: Sibylle B Thies* - ; Phil A Tresadern - ;
Laurence P Kenney - ; Joel Smith - ; David Howard - ;
John Y Goulermas - ; Christine Smith - ; Julie Rigby -
* Corresponding author
Abstract
Background: In the evaluation of upper limb impairment post stroke there remains a gap between
detailed kinematic analyses with expensive motion capturing systems and common clinical
assessment tests. In particular, although many clinical tests evaluate the performance of functional
tasks, metrics to characterise upper limb kinematics are generally not applicable to such tasks and
very limited in scope. This paper reports on a novel, user-friendly methodology that allows for the
assessment of both signal magnitude and timing variability in upper limb movement trajectories
during functional task performance. In order to demonstrate the technique, we report on a study
in which the variability in timing and signal magnitude of data collected during the performance of
two functional tasks is compared between a group of subjects with stroke and a group of
individually matched control subjects.
Methods: We employ dynamic time warping for curve registration to quantify two aspects of
movement variability: 1) variability of the timing of the accelerometer signals' characteristics and 2)
variability of the signals' magnitude. Six stroke patients and six matched controls performed several
trials of a unilateral ('drinking') and a bilateral ('moving a plate') functional task on two different days,
approximately 1 month apart. Group differences for the two variability metrics were investigated
on both days.
Results: For 'drinking from a glass' significant group differences were obtained on both days for
the timing variability of the acceleration signals' characteristics (p = 0.002 and p = 0.008 for test and
retest, respectively); all stroke patients showed increased signal timing variability as compared to
their corresponding control subject. 'Moving a plate' provided less distinct group differences.
Conclusion: This initial application establishes that movement variability metrics, as determined
by our methodology, appear different in stroke patients as compared to matched controls during
unilateral task performance ('drinking'). Use of a user-friendly, inexpensive accelerometer makes
this methodology feasible for routine clinical evaluations. We are encouraged to perform larger
studies to further investigate the metrics' usefulness when quantifying levels of impairment.
Published: 23 January 2009
Journal of NeuroEngineering and Rehabilitation 2009, 6:2 doi:10.1186/1743-0003-6-2
Received: 28 April 2008
Accepted: 23 January 2009
This article is available from: />© 2009 Thies et al; licensee BioMed Central Ltd.
This is an Open Access article distributed under the terms of the Creative Commons Attribution License ( />),
which permits unrestricted use, distribution, and reproduction in any medium, provided the original work is properly cited.
Journal of NeuroEngineering and Rehabilitation 2009, 6:2 />Page 2 of 12
(page number not for citation purposes)
Background
Stroke affects approximately 2 in 1000 people in the UK
per year [1] and impaired upper limb function is reported
to be a major problem [2]. At 3 months post stroke only
20% of patients have normal upper limb function [3] and
less than 15% with initial paralysis may regain complete
motor recovery [4]. Although there exist a number of
promising approaches to the promotion of upper limb
recovery after stroke, quantifying the effectiveness of such
interventions remains somewhat limited by the available
outcome measures.
Previous research found that following stroke upper limb
movement trajectories during point-point reaching are
more spatially segmented and motions are performed at
slower speeds and with greater trunk involvement as com-
pared to healthy controls [5]. Furthermore, upper limb
movement smoothness during reaching, as characterized
by jerk, has shown good correlation with stroke recovery
[6]. Although these studies provided valuable insights
into how stroke affects upper limb kinematics, only the
forward reach and retraction of the arm during pointing
tasks were investigated with expensive equipment such as
3D camera motion analysis systems that cannot easily be
moved within the clinic or to a patient's home.
At present there remains a gap between such objective kin-
ematic measures of upper limb impairment which charac-
terise non-functional tasks (e.g. pointing tasks) in great
detail [5-8] and clinical measures that evaluate functional
task performance. Clinical tests often measure the time to
complete a certain task (e.g. box-and-blocks test) [9], or
collect categorical measurements of performance (e.g.
ARAT) [9]. Others, for example the Motricity Index [9],
evaluate impairment quantitatively, however, previous
work has addressed limitations of such tests, for example,
poor standardization and/or reliability [10-13].
We therefore developed a new methodology for the char-
acterization of functional upper limb movements which
could bridge the gap between clinical assessment tests and
complex, objective kinematic description of non-func-
tional pointing tasks. More specifically, we employed
user-friendly, inexpensive accelerometers for which we see
many advantages in routine clinical evaluations. A small
number of studies [14-16] have recently made use of iner-
tial sensor technology to describe upper limb kinematics
in functional tasks but have yet to develop appropriate
metrics to characterise the motions.
Standard approaches to movement variability quantifica-
tion in upper limb movements are typically based on the
spread in the value of characteristic features, such as peak
velocity, or end point error in pointing tasks [5]. For gait
data, Chau [17] makes a strong case for considering varia-
bility across the entire curves, rather than variability in the
magnitude of particular, discrete features. Chau and oth-
ers also identify that random noise and phase variation
between trials suggests the use of more sophisticated
approaches than time normalisation and simple descrip-
tive statistics when comparing motion curves[17,18].
Clearly, for upper limb functional tasks, in which the
duration of each part of the movement (e.g. reach, manip-
ulate, release) is likely to vary both within and between
individuals, time normalisation introduces the risk of
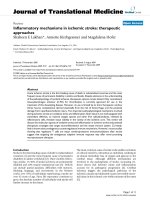
aligning trials inappropriately. For example, consider two
trials of a functional upper limb task in which the subject
took significantly longer to complete the grasp of the
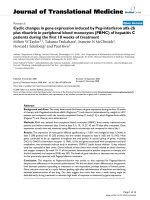
object in Trial A, as compared to Trial B (Figure 1, top). By
linearly compressing signals, it is highly likely that data
points from one part of the task gathered during Trial A
could be compared with data from a completely different
part of the task gathered during Trial B (Figure 1, bottom).
Such inappropriate alignment would lead to inappropri-
ate estimation of inter-trial variation in signal magnitude.
Our new assessment method uses software algorithms
that address these limitations and allows for separate con-
sideration of timing and signal magnitude variability,
both of which may contain useful information with
which to characterise variability in task performance.
This paper is the first to demonstrate the use of our meth-
odology in characterising impaired upper limb motion
during functional tasks. More specifically, we chose to
investigate upper limb movement variability in chronic
(stable) stroke patients and matched controls for a unilat-
eral ('drinking') and bilateral ('moving a plate') func-
tional task. Previous analysis of kinematic data collected
with a 3D motion capturing system [5] as well as recent
computer modelling [19] suggest that upper limb move-
ment variability increases following stroke. We therefore
hypothesize that stroke patients will exhibit increased
movement variability as compared to healthy control sub-
jects in constrained functional tasks, i.e. when the start/
end point of the hand, and the sequence of events within
the task, are both fixed and the object is picked up from
and returned to a marked target position in each trial. Fur-
thermore, we hypothesise that group differences in move-
ment variability would persevere in a retest session 1
month after the initial test.
Methods
Subjects
Six stroke patients (Table 1) and six healthy control sub-
jects were recruited from within Greater Manchester, UK,
and gave written informed consent to participate in the
study. Each control subject was matched in age, gender,
and right/left hand dominance to his/her respective stroke
patient. All subjects underwent a medical screening and
corresponding descriptive data (Ashworth scale, Motricity
Journal of NeuroEngineering and Rehabilitation 2009, 6:2 />Page 3 of 12
(page number not for citation purposes)
Index, Light Touch Discrimination, Detection of Move-
ment, Star Cancellation Test, Line Bisection Test) were col-
lected. Control subjects showed no signs of central or
peripheral nervous dysfunction. Stroke patients had to
pass the star cancellation test and line bisection test to
screen for visual neglect and visuospatial problems. All
patients had to have sufficient residual hand opening and
grasping ability on the affected side to be able to complete
both functional tasks without assistance. Patients' scores
with regard to tests of motor impairment, sensation, and
spasticity are shown in Table 1.
Experiment
The experimental protocol was approved by the UK Cen-
tral Office of Research Ethics Committee (Ref. # 06/
Q1405/7) and the University of Salford Research Govern-
ance and Ethics Committee (Ref. # RGEC05/28 and
RGEC06/92). Subjects were asked to sit close up against a
table and the position of the torso and the start/end point
of the hands were marked on the cover of the table to
allow for reproduction of a similar posture on the second
test day. The location of each object, at a self-reported
comfortable distance to the individual, was likewise
marked on the table's cover. Care was taken that the object
was placed within a distance that did not require engage-
ment of the torso during task performance. Both tasks
('drinking from a glass' and 'moving a plate') were per-
formed at a self-selected comfortable speed and involved
a forward reach followed by hand opening and object
grasp, object manipulation, and finally object release and
arm retraction. Manipulation of the glass was composed
of lifting it towards the mouth, holding it briefly, and then
Application of time normalization to upper limb kinematicsFigure 1
Application of time normalization to upper limb kinematics. Presentation of kinematic data from two repeats of a
functional upper limb task (top) and illustration of the effect that uniform normalization of the time axis has on the data (bot-
tom).
0 2 4 6 8 10 12
−15
−10
−5
0
5
Time (sec)
X Acceleration (m/s
2
)
0 20 40 60 80 100
−10
−5
0
5
% Movement Time
X Acceleration (m/s
2
)
Trial A
Trial B
Grasp
Object Manipulation
Object Manipulation
Grasp
Trial B − −
Trial A
Journal of NeuroEngineering and Rehabilitation 2009, 6:2 />Page 4 of 12
(page number not for citation purposes)
replacing the glass onto the table. Manipulation of the
plate contained a small upwards lift of the plate in front
of the torso, followed by a sideways translation of the
plate towards the side where the plate was then lowered
onto the table. Stroke patients performed the glass task
with their affected arm, and controls had to use the same
arm as their corresponding match. Furthermore, the plate
was moved towards the affected side of the patient and
this was copied by each corresponding control subject.
Eight trials per task were recorded, and this was done on
two different days, approximately 1 month apart.
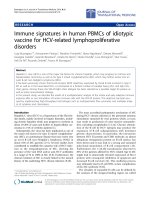
Instrumentation & data processing
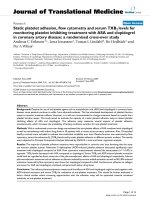
An inertial sensor (Xsens Technologies B.V., Enschede,
Netherlands) was placed on the forearm such that its x
axis was roughly aligned with the forearm's longitudinal
axis, pointing proximally, while the z axis was perpendic-
ular to the forearm's surface, pointing upwards (Figure 2).
Movement onset and termination of each trial were
defined by an acceleration threshold algorithm (Matlab
®
)
as the first and last frame where the x acceleration, roughly
aligned with the longitudinal axis of the forearm,
exceeded the mean resting value by ± 0.3 m/s
2
. For the def-
inition of movement onset and end the acceleration sig-
nals were lowpass filtered with a 4
th
order Butterworth
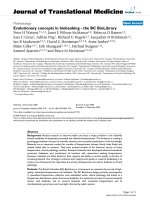
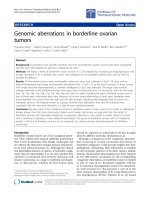
filter and a cut-off frequency of 4 Hz. Figure 3 shows
examples of acceleration trajectories and corresponding
movement onset and termination indices for both tasks
performed by a control subject and stroke patient. The
derived indices were then used to truncate the original,
unfiltered acceleration signals prior to their further
processing with the variability software. Moreover, the
movement time of each trial was defined as the time
elapsed between these two frames and is reported as a sec-
ondary outcome measure.
Definition of variability metrics
Inspired by recent work that addresses limitations with
traditional approaches [17,20], we similarly employed
Table 1: Descriptive parameters of stroke patients.
Patient 1 Patient 2 Patient 3 Patient 4 Patient 5 Patient 6
Gender Female Male Male Male Female Male
Age 338348607259
Dominant side Right Right Right Right Right Right
Affected Side Right Right Left Left Right Left
Time since stroke 3 years 4 years 3 years 6 months 3 years 2 years
Motricity Index* 66/100 76/100 76/100 63/100 76/100 76/100
Light Touch Discrimination*:
Wrist, Hand
6/6, 6/6 6/6, 6/6 0/6, 4/6 3/6, 5/6 6/6, 6/6 5/6, 6/6
Movement Detection*: Shoulder,
Elbow, Wrist, Thumb
6/6, 6/6, 6/6, 6/6 6/6, 6/6, 6/6, 6/6 6/6, 6/6, 3/6, 6/6 6/6, 6/6, 4/6, 4/6 6/6, 6/6, 6/6, 6/6 5/6, 6/6, 6/6, 6/6
Ashworth Scale* 1–211310
Each control was matched in age, gender, and limb dominance to one patient.
*Hemiplegic Arm
Experimental set upFigure 2
Experimental set up. The inertial sensor is shown on the
proximal forearm as the subject reaches forward to grasp
the glass.
Journal of NeuroEngineering and Rehabilitation 2009, 6:2 />Page 5 of 12
(page number not for citation purposes)
dynamic programming [21] for curve-registration. The
new approach presented here separately considers varia-
bility of any given signal in two parts, 1) variability in the
timing of the signal, e.g. reoccurrence of a characteristic
spike at a specific time instant in each trial, and 2) varia-
bility in the motion signal's magnitude, e.g. the maximum
value of a characteristic spike reproduced from trial-to-
trial. Our software algorithms, programmed in Matlab
®
,
therefore uses a two stage process to quantify both aspects
of movement variability separately.
The software first addresses the timing errors between tri-
als before calculating differences in signal magnitude.
Therefore, for each trial-to-trial comparison a reference
trial (trial 1) is defined to which the other trial (trial 2) is
"time-warped" (Figure 4). The variability in timing is then
quantified by the amount of warping that was necessary to
align the two trials. For each data point, p(t) = [x(t), y(t),
z(t)] (a vector acceleration in 3 dimensional space), in
trial 1, the software defines the 'error' between it and a
given data point, p'(t') = [x'(t'), y'(t'), z'(t')], in trial 2 as
the Euclidean distance between the two points:
Computing this error for every possible pairing of data
points gives an error surface (Figure 5) in which the axes
represent time in trials 1 and 2 (i.e. t and t') respectively;
light areas indicate a high error between points (i.e.
widely separated points) while dark areas indicate low
error between points (i.e. points which are similar).
Dynamic programming [21] is then used to calculate the
path of minimum error (shown in white in Figure 5)
across the diagonal of the error surface. This path defines
the optimal time warping, f(t'), of trial 2 onto trial 1 and
the RMS error between this path of least error and an ideal
45° line (f(t') = t+Δ, corresponding to a simple offset with
no warping) represents the amount of time-warping done
and is hereafter referred to as warping cost. The dynamic
programming approach enforces the constraint that the
warping does not change the temporal order of the data
points in trial 2.
The variability in signal magnitude is then reflected by the
RMS error between the reference trial and the warped trial.
dt t xtxt ytyt ztzt( ( ), ’( ’)) ( ( ) ’( ’)) ( ( ) ’( ’)) ( ( ) ’( ’))pp =− +− +−
2222
Application of acceleration threshold algorithmFigure 3
Application of acceleration threshold algorithm. Movement onset and termination indices are denoted by '*' and are
superimposed onto the corresponding x acceleration trajectory. Sample plots are shown for a control subject (left) and stroke
patient (right) for the glass task (top) and plate task (bottom).
0 100 200 300 400 500 600 700
−10
−5
0
5
Frame #
X Acceleration (m/s
2
)
Control
0 200 400 600 800 1000 1200
−10
−5
0
5
Frame #
X Acceleration (m/s
2
)
Stroke
0 100 200 300 400 500 600
−5
−4
−3
−2
−1
0
1
2
3
4
Frame #
X Acceleration (m/s
2
)
0 100 200 300 400 500 600 700
−5
−4
−3
−2
−1
0
1
2
3
4
Frame #
X Acceleration (m/s
2
)
Glass Task
Reach
Grasp
Manipulate
Release
Retract
Glass Task
Reach
Grasp
Manipulate
Release Retract
Plate Task
Reach
Grasp
Manipulate
Release
Retract
Plate Task
Reach
Grasp
Manipulate
Release
Retract
Journal of NeuroEngineering and Rehabilitation 2009, 6:2 />Page 6 of 12
(page number not for citation purposes)
For each trial-to-trial comparison, RMS errors are
obtained for time-warped x, y, and z accelerations and the
average across all three axes is calculated.
Finally, the mean value across all trial-to-trial compari-
sons for a particular task on a particular day is calculated
for each of the two variability metrics. The mean value of
each metric (warping cost, RMS error) corresponding to
each task (glass & plate task) is thereby determined for
each subject on each day.
Statistical Analysis
Paired t-tests [22] were used to compare stroke patients to
matched controls for each task with regard to 1) mean
warping cost (day 1 and 2, separately), 2) mean RMS error
(day 1 & 2, separately), and 3) mean time to complete task
(day 1 & 2, separately) and corresponding confidence
intervals were determined. Furthermore, differences
between stroke patients and corresponding matched con-
trols were graphically visualized.
Results
Application of dynamic time warping
Only four trials per task per day were analyzed for the
comparison of stroke patients to healthy controls. This
was due to the stroke patients' insecure grasp of the object
and onset of fatigue: trials during which the object was
dropped were excluded and some patients fatigued so that
no more than 4 good trials could be collected.
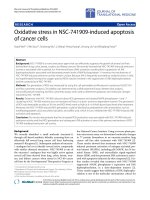
Dynamic time warping successfully registered upper limb
acceleration signals for both, stroke patients and controls.
Figure 6 shows two acceleration signals per graph; one ref-
erence trial and one other comparison trial that has been
time warped to align it with the reference trial. Graphs on
the left show reference and time-warped acceleration sig-
Time warping of acceleration signalsFigure 4
Time warping of acceleration signals. Linear acceleration signals of two trials that are to be investigated for trial-to-trial
variability (left) and signals after having time-warped one signal to the declared reference (right).
0 200 400 600 800 1000 1200
−2.5
−2
−1.5
−1
−0.5
0
0.5
1
1.5
2
Frame #
X Acceleration (m/s
2
)
Reference Trial
Trial to be warped
0 200 400 600 800 1000 1200
−2.5
−2
−1.5
−1
−0.5
0
0.5
1
1.5
2
Frame #
X Acceleration (m/s
2
)
Reference Trial
Warped Trial
Error surface and path of least errorFigure 5
Error surface and path of least error. Error surface and
path of least error produced when warping each frame of
one trial to each frame of the reference trial. The axes repre-
sent time in trials 1 and 2 (i.e. t and t') respectively; light
areas indicate a high error between points while dark areas
indicate low error between points. Each frame represents
0.01 seconds.
200 400 600 800 1000
100
200
300
400
500
600
700
800
900
Frame # (Reference Trial)
Frame # (Warped Trial)
Journal of NeuroEngineering and Rehabilitation 2009, 6:2 />Page 7 of 12
(page number not for citation purposes)
nals of a healthy control subject for the glass task (top)
and plate task (bottom). Graphs on the right are reference
and time-warped trials of a stroke patient, again, for the
glass task and plate task (top and bottom, respectively).
Acceleration signals obtained from this stroke patient
appeared less smooth as compared to the control subject,
and this was to be expected given previous work that
investigated movement smoothness in stroke patients [6].
Moreover, a larger RMS error between trials after time-
warping can be observed for the stroke patient: compared
to the control subject the stroke patient had an RMS error
2.9 times larger for the glass task and 3.5 times larger for
the plate task.
Warping cost and RMS error, glass task
Cost of warping was significantly different between stroke
patients and controls for the glass task on both days (p =
0.002 and p = 0.008 for day 1 & 2, Table 2). A larger cost
of warping was required to align trials of stroke patients,
indicating that patients exhibited higher variability in tim-
ing of their motion than controls. Figure 7 illustrates that
for both days all stroke patients exhibited higher variabil-
ity in timing of the motion (as reflected in higher warping
cost) than their corresponding control subject.
RMS Error for the glass task had a p-value of less than 0.1
for both days but did not reach significance for the six
stroke-control pairs (p = 0.063 and p = 0.086 for day 1 and
day 2, respectively, see Table 2). Figure 7 shows the indi-
vidual pairs (stroke and control): stroke patients showed
higher variability in the accelerometer's signal magnitude
(as reflected in a larger RMS error) in 5/6 cases on day 1
and day 2. The p-values for RMS error between groups
X accelerations of two trials after time warpingFigure 6
X accelerations of two trials after time warping. X acceleration signals of the glass task (top) and plate task (bottom) are
shown for a control subject (left) and for a stroke patient (right).
0 200 400 600
−15
−10
−5
0
5
Frame #
X Acceleration (m/s
2
)
Control
Reference Trial
Warped Trial
0 500 1000 1500
−15
−10
−5
0
5
Frame #
X Acceleration (m/s
2
)
Stroke
Reference Trial
Warped Trial
0 100 200 300
−6
−4
−2
0
2
4
Frame #
X Acceleration (m/s
2
)
Reference Trial
Warped Trial
0 200 400 600
−6
−4
−2
0
2
4
Frame #
X Acceleration (m/s
2
)
Reference Trial
Warped Trial
Journal of NeuroEngineering and Rehabilitation 2009, 6:2 />Page 8 of 12
(page number not for citation purposes)
became significant (p = 0.029 and p = 0.003) when the
last pair was excluded from statistical analysis.
Warping cost and RMS error, plate task
For the plate task, warping cost did not reach significance
when comparing stroke patients to controls (p = 0.050
and p = 0.180 for day 1 and 2, respectively, Table 3). Fig-
ure 8 illustrates that on both days 5/6 patients had larger
cost of warping than their corresponding control subject.
The RMS error was significant on day 2 (p = 0.031) and
had a p-value of less than 0.1 on day 1 (Table 3). Figure 8
Control-stroke-pairs, glass taskFigure 7
Control-stroke-pairs, glass task. Warping cost ('WC', left) and RMS error ('RMS', right) for day 1 and day 2 (top & bottom,
respectively). Controls are denoted by '*' and stroke patients by 'o'.
1 2 3 4 5 6
0
20
40
60
80
Control−Stroke Pairs
WC Day 1
1 2 3 4 5 6
0
20
40
60
80
Control−Stroke Pairs
WC Day 2
1 2 3 4 5 6
0.2
0.4
0.6
0.8
1
Control−Stroke Pairs
RMS (m/s
2
) Day 1
1 2 3 4 5 6
0.4
0.6
0.8
1
Control−Stroke Pairs
RMS (m/s
2
) Day 2
Table 2: Glass task variability metrics.
Controls Stroke Significance 95% CI
Day 1 Warping Cost 13.71(4.06) 44.63(10.06) p = 0.002 (-44.44, -17.42)
RMS (m/s
2
) 0.39(0.08) 0.50(0.08) p = 0.063 (-0.23, 0.009)
Day 2 Warping Cost 18.22(6.66) 41.71(10.58) p = 0.008 (-37.76, -9.22)
RMS (m/s
2
) 0.41(0.07) 0.51(0.11) p = 0.086 (-0.23, 0.021)
Controls vs. stroke patients: group mean(group std). CI denotes 'confidence interval'.
Journal of NeuroEngineering and Rehabilitation 2009, 6:2 />Page 9 of 12
(page number not for citation purposes)
shows that 4/6 patients had a larger RMS error on day 1
than their corresponding control subject, and 5/6 did so
on day 2.
Time to complete functional tasks
Stroke patients took significantly more time when com-
pleting either of the functional tasks, and this was
observed on both days (Table 4).
Discussion
To our knowledge this is the first study that has applied
dynamic time warping for curve registration to forearm
acceleration signals from stroke patients and matched
controls performing a unilateral and a bilateral functional
task. It is noteworthy that two objective metrics of move-
ment variability are obtained: 1) warping cost, represent-
ative of the variability in the timing of the acceleration
signal, and 2) RMS error, representative of the variability
in the signal's magnitude.
The warping cost for the glass task was significantly larger
in stroke patients than controls on both days; since group
differences persisted over the course of a month for this
variability metric (as indicated by p-values < 0.05 on both
days) it appears to be a promising clinical outcome meas-
ure if applied to unilateral functional tasks. It is notewor-
thy that we employed root mean square error calculation,
a measure insensitive to trial length, to quantify warping
cost. Moving generally at a slower speed therefore does
not increase this metric, instead trial-to-trial variability of
the timing of the acceleration signals' characteristics is
captured by it. The RMS error for the glass task had a p-
value < 0.1 when comparing stroke patients to controls
and this became significant when the last stroke-control
pair was removed from the analysis (p = 0.029 and p =
Control-stroke-pairs, plate taskFigure 8
Control-stroke-pairs, plate task. Warping cost ('WC', left) and RMS error ('RMS', right) for day 1 and day 2 (top & bot-
tom, respectively). Controls are denoted by '*' and stroke patients by 'o'.
1 2 3 4 5 6
0
20
40
60
80
100
Control−Stroke Pairs
WC Day 1
1 2 3 4 5 6
0
20
40
60
80
100
Control−Stroke Pairs
WC Day 2
1 2 3 4 5 6
0.2
0.4
0.6
0.8
1
Control−Stroke Pairs
RMS (m/s
2
) Day 1
1 2 3 4 5 6
0.2
0.4
0.6
0.8
1
Control−Stroke Pairs
RMS (m/s
2
) Day 2
Journal of NeuroEngineering and Rehabilitation 2009, 6:2 />Page 10 of 12
(page number not for citation purposes)
0.003 for day 1 and day 2, respectively). This parameter
may therefore be useful in larger studies. The plate task
provided less significant group differences when compar-
ing variability measures for stroke patients to those of
controls. This may be explained by the use of the healthy
arm when moving the plate to the side: the affected arm
may be guided and assisted by the healthy arm.
Curve registration was first applied to gait data by Sadeghi
and colleagues [20]. They recognised that characteristic
features, such as peak values, vary between individuals in
their precise location within the gait cycle. Averaging
time-normalised curves across individuals therefore
results in loss of information. Sadeghi and colleagues
used the technique of curve registration to more appropri-
ately align subjects' gait data prior to further analysis.
Because upper limb motions during functional tasks are
not cyclic yet have repetitive characteristics if constrained,
we decided to apply such an approach to upper limb
acceleration signals and report the warping cost as a valu-
able outcome measure. Our results support this approach
in that significant group differences with regard to time-
warping were obtained. The next step is to apply this new
methodology to a large number of stroke patients with
various degrees of upper limb impairment and at different
stages of rehabilitation to evaluate the merit of these met-
rics in routine clinical evaluations.
Stroke patients were more variable in their movement and
needed more time to complete each task. Recent research
investigated gait variability in conjunction with walking
speed in young and older adults [23] and the authors con-
cluded that increased gait variability in older adults is bet-
ter explained by loss of strength and flexibility rather than
slower walking speed. Similarly, future research needs to
address the driving factors for upper limb movement var-
iability in stroke and controls. Moreover, as with present
research investigating gait variability [24,25], studies are
needed to investigate the detailed interpretation of such
data.
It is important to note that this work investigated group
differences within a given day and showed if those differ-
ences persist when a retest is performed 1 month later. No
direct trial-to-trial comparison between days was done,
and it was therefore not necessary to exactly reproduce
postural initial conditions and the sensor's orientation
with respect to the forearm on the second test day.
In this initial study we acknowledge our small sample size
and hence the wide confidence intervals. Nevertheless,
graphical representation of stroke-control pairs for the
glass task (Figure 7) supports application of variability
metrics to unilateral functional tasks and encourages
larger studies. In the long term, we envisage the design of
a graphical user interface for the variability software that,
together with an inexpensive and portable accelerometer,
Table 3: Plate task variability metrics.
Controls Stroke Significance 95% CI
Day 1 Warping Cost 15.81(7.96) 58.96(36.45) p = 0.050 (-86.35, 0.04)
RMS (m/s
2
) 0.41(0.14) 0.60(0.15) p = 0.064 (-0.39, 0.02)
Day 2 Warping Cost 17.29(14.48) 37.99(22.83) p = 0.180 (-54.64, 13.43)
RMS (m/s
2
) 0.43(0.09) 0.51(0.13) p = 0.031 (-0.15, -0.01)
Controls vs. stroke patients: group mean(group std). CI denotes 'confidence interval'.
Table 4: Time (in seconds) to complete task.
Controls Stroke Patients Significance 95% CI
Glass Day 1 5.24(0.75) 12.30(2.45) p = 0.001 (-9.85, -4.27)
Day2 5.47(1.25) 11.47(2.16) p = 0.006 (-9.30, -2.69)
Plate Day1 3.86(1.11) 7.81(3.43) p = 0.049 (-7.86, -0.04)
Day2 3.59(0.73) 7.80(3.20) p = 0.040 (-8.13, -0.29)
Controls vs. stroke patients: group mean(group std). CI denotes 'confidence interval'.
Journal of NeuroEngineering and Rehabilitation 2009, 6:2 />Page 11 of 12
(page number not for citation purposes)
will allow researchers and clinicians to apply this software
in routine clinical care.
In the future tasks could be subdivided into component
features (e.g. reach forward, object grasp etc.) to provide
further insight into particular aspects of upper limb func-
tion, for example hand opening, and their contribution to
the variability scores. Moreover, given that task time is a
crucial outcome measure in many clinical tests (e.g.
ARAT), integration of variability measures with such tests
merits further study. Furthermore, for evaluation of
patients with no or poor hand opening, variability of
other functional tasks could also be investigated. For
example 'opening a door' and 'moving a box with both
hands' are less challenging tasks and yet of real-life rele-
vance and could accommodate patients with more severe
impairments of the hand. Finally, there is recent evidence
to show that, focusing on the characteristics of the move-
ment itself rather than the outcome of the movement (e.g.
end point accuracy in a pointing task), is of most benefit
in promoting the recovery of normal motor patterns fol-
lowing stroke [26]. Currently, there is a limited range of
tools for quantifying upper limb motion in the clinical
environment [12], particularly with respect to perform-
ance of functional tasks, practice of which are viewed as
key to the rehabilitation process. In our study we have
introduced a new tool that allows for a detailed analysis
of upper limb motion variability, measured with low cost
sensors during performance of functional tasks. Further,
the results presented here suggest that higher variability is
associated with stroke. It is possible to speculate that such
metrics could be used as part of a biofeedback tool to
encourage a return to more normal levels of variability in
performance of functional tasks. Further clinical trial work
is required to explore whether a move towards more nor-
mal levels of variability is associated with a reduction in
disability measures.
Conclusion
The results of this study suggest that accelerometry, in
conjunction with suitable variability metrics, has the
potential to support clinicians and therapists in their
assessment of upper limb impairment during functional
task performance. Accelerometers are user-friendly and
inexpensive and therefore of advantage in routine clinical
evaluations.
Competing interests
The authors declare that they have no competing interests.
Authors' contributions
SBT designed the experiment, collected & analyzed data
and drafted the manuscript. PAT, LPK and JS wrote/mod-
ified the variability software. DH and JYG made substan-
tial contributions to conception of software design. CS
and JR recruited stroke patients and collected descriptive
data of patients and controls. All authors read and
approved the final manuscript.
Acknowledgements
The authors wish to acknowledge funding for this work from the European
Commission (IST FP6 programme Healthy AIMS) and from the Nuffield
Foundation (Undergraduate Research Bursaries Programme).
References
1. Mant D, Wade D, Winner S: Stroke. In Health care needs assessment:
the epidemiologically based needs assessment reviews 2nd edition. Edited
by: Stevens A, Raftery J, Mant J, Simpson S. Oxford: Radcliffe Medical
Press; 2004:141-243.
2. Broeks JG, Lankhorst GJ, Rumping K, Prevo AJ: The long-term out-
come of arm function after stroke: results of a follow-up
study. Disabil Rehabil 1999, 21:357-364.
3. Parker VM, Wade DT, Langton Hewer R: Loss of arm function
after stroke: measurement, frequency, and recovery. Int
Rehabil Med 1986, 8:69-73.
4. Hendricks HT, van Limbeek J, Geurts AC, Zwarts MJ: Motor recov-
ery after stroke: a systematic review of the literature. Arch
Phys Med Rehabil 2002, 83:1629-1637.
5. Cirstea MC, Levin MF: Compensatory strategies for reaching in
stroke. Brain 2000, 123:940-953.
6. Rohrer B, Fasoli S, Krebs HI, Hughes R, Volpe B, Frontera WR, Stein
J, Hogan N: Movement smoothness changes during stroke
recovery. J Neurosci 2002, 22:8297-8304.
7. Flash T, Hogan N: The coordination of arm movements: an
experimentally confirmed mathematical model. J Neurosci
1985, 5:1688-1703.
8. Cozens JA, Bhakta BB: Measuring movement irregularity in the
upper motor neurone syndrome using normalised average
rectified jerk. J Electromyogr Kinesiol 2003, 13:73-81.
9. Wade DT: Measurement in neurological rehabilitation Oxford: Oxford
University Press; 1994.
10. Light CM, Chappell PH, Kyberd PJ, Ellis BS: A critical review of
functionality assessment in natural and prosthetic hands. Br
J Occup Ther 1999, 62:7-12.
11. Light CM, Chappell PH, Kyberd PJ: Establishing a standardized
clinical assessment tool of pathologic and prosthetic hand
function: normative data, reliability, and validity. Arch Phys
Med Rehabil 2002, 83:776-783.
12. Krakauer JW:
Arm function after stroke: from physiology to
recovery. Semin Neurol 2005, 25:384-395.
13. Krakauer JW: Motor learning: its relevance to stroke recovery
and neurorehabilitation. Curr Opin Neurol 2006, 19:84-90.
14. Maitra KK, Junkins M: Upper extremity movement pattern of a
common drinking task in well elderly women: a pilot study.
Occup Ther Int 2004, 11:67-81.
15. Zhou H, Stone T, Hu H, Harris N: Use of multiple wearable iner-
tial sensors in upper limb motion tracking. Med Eng Phys 2008,
30:123-133.
16. Cutti AG, Giovanardi A, Rocchi L, Davalli A, Sacchetti R: Ambula-
tory measurement of shoulder and elbow kinematics
through inertial and magnetic sensors. Med Biol Eng Comput
2008, 46:169-178.
17. Chau T, Young S, Redekop S: Managing variability in the sum-
mary and comparison of gait data. J Neuroeng Rehabil 2005,
29:2-22.
18. Forner-Cordero A, Koopman HJFM, Helm FCT van der: Describing
gait as a sequence of states. J Biomech 2007, 39:948-957.
19. Reinkensmeyer DJ, Iobbi MG, Kahn LE, Kamper DG, Takahashi CD:
Modeling reaching impairment after stroke using a popula-
tion vector model of movement control that incorporates
neural-firing-rate variability. Neural Computation 2003,
15:2619-2642.
20. Sadeghi H, Allard P, Shafie K, Mathieu PA, Sadeghi S, Prince F, Ramsay
J: Reduction of gait data variability using curve registration.
Gait Posture 2000, 12:257-264.
21. Cormen TH, Leiserson CE, Rivest RL, Stein C: Introduction to algo-
rithms 2nd edition. Boston: MIT Press; 2001.
22. Bland JM, Altman DG: Matching. BMJ 1994, 309:1128.
Publish with BioMed Central and every
scientist can read your work free of charge
"BioMed Central will be the most significant development for
disseminating the results of biomedical research in our lifetime."
Sir Paul Nurse, Cancer Research UK
Your research papers will be:
available free of charge to the entire biomedical community
peer reviewed and published immediately upon acceptance
cited in PubMed and archived on PubMed Central
yours — you keep the copyright
Submit your manuscript here:
/>BioMedcentral
Journal of NeuroEngineering and Rehabilitation 2009, 6:2 />Page 12 of 12
(page number not for citation purposes)
23. Kang HG, Dingwell JB: Separating the effects of age and walking
speed on gait variability. Gait Posture 2008, 27:572-577.
24. England SA, Granata KP: The influence of gait speed on local
dynamic stability of walking. Gait Posture 2006, 25:172-178.
25. Beauchet O, Allali G, Berrut G, Dubost V: Is low lower-limb kine-
matic variability always an index of stability? Gait Posture 2007,
26:327-328.
26. Cirstea MC, Levin MF: Improvement in arm movement pat-
terns and endpoint control depends on type of feedback dur-
ing practice in stroke survivors. Neurorehabil Neural Repair 2007,
21:1-14.