báo cáo hóa học: "Use of information entropy measures of sitting postural sway to quantify developmental delay in infants" pdf
Bạn đang xem bản rút gọn của tài liệu. Xem và tải ngay bản đầy đủ của tài liệu tại đây (440.88 KB, 13 trang )
BioMed Central
Page 1 of 13
(page number not for citation purposes)
Journal of NeuroEngineering and
Rehabilitation
Open Access
Research
Use of information entropy measures of sitting postural sway to
quantify developmental delay in infants
Joan E Deffeyes
1
, Regina T Harbourne
2
, Stacey L DeJong
2
,
Anastasia Kyvelidou
1
, Wayne A Stuberg
2
and Nicholas Stergiou*
1,3
Address:
1
Nebraska Biomechanics Core Facility, University of Nebraska at Omaha, Omaha, NE, 68182, USA,
2
Munroe-Meyer Institute, University
of Nebraska Medical Center, Omaha, NE 68198, USA and
3
Department of Environmental, Agricultural and Occupational Health Sciences, College
of Public Health, University of Nebraska Medical Center, Omaha, NE 68198, USA
Email: Joan E Deffeyes - ; Regina T Harbourne - ; Stacey L DeJong - ;
Anastasia Kyvelidou - ; Wayne A Stuberg - ;
Nicholas Stergiou* -
* Corresponding author
Abstract
Background: By quantifying the information entropy of postural sway data, the complexity of the
postural movement of different populations can be assessed, giving insight into pathologic motor
control functioning.
Methods: In this study, developmental delay of motor control function in infants was assessed by
analysis of sitting postural sway data acquired from force plate center of pressure measurements.
Two types of entropy measures were used: symbolic entropy, including a new asymmetric symbolic
entropy measure, and approximate entropy, a more widely used entropy measure. For each
method of analysis, parameters were adjusted to optimize the separation of the results from the
infants with delayed development from infants with typical development.
Results: The method that gave the widest separation between the populations was the asymmetric
symbolic entropy method, which we developed by modification of the symbolic entropy algorithm.
The approximate entropy algorithm also performed well, using parameters optimized for the infant
sitting data. The infants with delayed development were found to have less complex patterns of
postural sway in the medial-lateral direction, and were found to have different left-right symmetry
in their postural sway, as compared to typically developing infants.
Conclusion: The results of this study indicate that optimization of the entropy algorithm for infant
sitting postural sway data can greatly improve the ability to separate the infants with developmental
delay from typically developing infants.
Background
Cerebral palsy, and other motor pathologies, give rise to
altered patterns of movement. In order to quantify altered
movement patterns in infants, postural sway during infant
sitting can be analyzed for patterns using measures
derived from information theory, such as approximate
entropy and symbolic entropy. Measures such as these
quantify patterns in time series data, making them poten-
Published: 11 August 2009
Journal of NeuroEngineering and Rehabilitation 2009, 6:34 doi:10.1186/1743-0003-6-34
Received: 7 December 2008
Accepted: 11 August 2009
This article is available from: />© 2009 Deffeyes et al; licensee BioMed Central Ltd.
This is an Open Access article distributed under the terms of the Creative Commons Attribution License ( />),
which permits unrestricted use, distribution, and reproduction in any medium, provided the original work is properly cited.
Journal of NeuroEngineering and Rehabilitation 2009, 6:34 />Page 2 of 13
(page number not for citation purposes)
tially well suited for assessment of altered patterns of
movement in a variety of movement pathologies, and
may also provide insight into the nature of movement var-
iability in human motor control pathologies [1-4].
Variability in control of human movement has histori-
cally been thought of in terms of error in a control system
[5]. For example, if one is tossing darts, sometimes one
might toss a bull's eye (meaning the dart goes in the very
center of the circular pattern of the target), but the dart
doesn't always go in the bull's eye because of variability in
the motor control system. This leads some to the conclu-
sion that a motor program was not executed correctly
when the dart fails to go in the bull's eye, and from this
perspective, variability is always an error in the motor con-
trol system. A more recent theory of motor control, based
on dynamic systems theory, views the variability in motor
control as part of the natural dynamics of the system [6].
Dynamic systems theory represents behaviors as being
local minima on a potential surface, with the system pro-
ceeding towards a potential well like a marble rolling
towards the bottom of a dish. Motor learning involves
deepening the system's potential well associated with the
behavior, and thus reducing variability. From this per-
spective, the potential well can never be infinitely deep, so
there will always be some variability in the behavior.
While a person tossing darts may wish for zero variability
in their tosses, current theories on variability find that
there are benefits to having some variability in movement.
The theory of optimal movement variability focuses on
the benefits of having a balance between rigid control and
randomness in movement; i.e. complexity [7]. Having
complexity in movement allows for exploration of new
solutions to motor control in order to find optimal solu-
tions. As stated by Hadders-Algra and colleagues, "Com-
plexity points to the spatial variation of movements. It is
brought about by the independent exploration of degrees
of freedom in all body joints." [8,9]. Thus entropy, a
measure of complexity from information theory, might be
expected to differ in postural sway of infants with typical
development, as compared to infants with motor devel-
opment pathologies such as cerebral palsy.
The application of the concept of entropy to information
theory has resulted in mathematical algorithms that are
useful for describing randomness in experimental data
from physiological systems. Information is a concept used
in information theory, and is used in the sense that the
string "ABABABABAB" has only a small amount of infor-
mation in it (it is easy to guess what the next letter is – so
the next letter adds no new information, hence a low
information content) but "ABAABABABB" has more
information (you could not determine for sure the next
letter), even though both are strings of characters of the
same length. Claude Shannon [10,11], developed the
Shannon Entropy to describe the information content of
a signal, with the idea that transmission of the signal for
communication purposes needs to preserve the informa-
tion content. If the goal of one's research is to characterize
information in experimental physiologic time series,
rather than in communication applications as Shannon
did, there are some modifications that can be made to the
algorithm. Perhaps the most widely used entropy meas-
urement for experimental data from physiologic systems
is the approximate entropy developed by Pincus [12]. The
approximate entropy may serve as an indicator for the
complexity of the underlying physiologic processes that
give rise to the variability in the time series data [12]. In
instances where pathology alters the complexity of the
physiological process, the entropy value may serve as a
means to identify the pathological state. For example, car-
diac pathology may be identified by loss of complexity in
heart rate data [13], concussions have been shown to
cause loss of complexity in standing postural sway data
[1], and knee ligament injury alters complexity in gait
[14].
Other authors have developed different algorithms to
assess entropy in experimental time series data [15-17],
often with the goal of improving some aspect of the anal-
ysis. For example, one might desire to find a measure of
randomness that does not depend on the length of the
time series, i.e. the entropy should remain within a well
defined range, regardless of the length of the time series.
This would facilitate comparisons with data acquired in
different laboratories, for example. Sample entropy has
been used for this reason [15]. Both the approximate
entropy and the sample entropy look at changes compar-
ing patterns of length L with patterns of length L+1. Alter-
natively, the scaling of patterns at greatly different lengths,
i.e. a pattern repeats but one repeat is longer or shorter
than another, has been studied using multiscale entropy
[16]. A data vector from time series data is a continuous
subset of the list of numbers that comprise the time series
data. Comparison of data vectors at different points along
the time series is typically done by comparing the values,
with similarity of the vectors being defined as one vector
having values within a specified range of those in the com-
parison vector. However, comparison of the vectors can
be performed using fuzzy logic, resulting in the fuzzy
entropy [17], where the term "fuzzy" indicates that the
similarity between the vectors is not a simple binary "yes"
or "no", but rather the degree of similarity is calculated.
Different types of data may be best analyzed using differ-
ent measures of complexity, and it is not clear a priori
which type of analysis will be best for a particular type of
data. For infant sitting postural sway data, approximate
entropy has been used previously [18], but other methods
have not been explored. For this work we have chosen to
Journal of NeuroEngineering and Rehabilitation 2009, 6:34 />Page 3 of 13
(page number not for citation purposes)
use the approximate entropy [12], the symbolic entropy
[19], and asymmetric symbolic entropy, which is a modi-
fication of the symbolic entropy. While in our Methods
section we provide more details on the algorithm, in short
the symbolic entropy measures how much the infant's
postural sway crosses certain locations on the force plate,
called "threshold values". Typically only one threshold is
used, the mean of the data. We modified the symbolic
entropy algorithm to allow multiple threshold values to
be used. These thresholds need not be symmetric – i.e.
thresholds in one direction could be set differently from
thresholds in the opposite direction in order to investigate
asymmetry in the data. The use of two thresholds is moti-
vated by the idea that the postural sway needs to be con-
fined within the base of support to avoid a fall. Therefore
control of posture near the center of the base of support
might not be as critical as control of posture near the
boundary. In order to investigate postural control near the
boundaries of the base of support, two threshold values
were used. Additionally, the use of different thresholds in
the left and right directions allows the investigation of
asymmetry of the postural sway, which can not be
addressed with other measures of complexity.
Learning how to maintain upright sitting posture is an
important motor developmental milestone. Infants use
the upright sitting posture as a base from which to explore
their immediate environment by reaching for nearby
objects and to allow visual inspection of their immediate
environment [20,21]. Additionally, sitting is important
because it is one of first developmental milestones an
infant achieves, and thus serves as an early indicator of the
health of the motor control system [22]. The achievement
of the sitting milestone is delayed in some pathologic
populations, such as those with cerebral palsy. Identifica-
tion of infants with delayed motor development at the
youngest age possible is of interest because treatment
early in life when neural plasticity is greatest may confer
greater benefits. Some intervention methods for infants
with cerebral palsy may prove better than others [23].
Quantifying the differences between various interventions
using sitting postural sway will assist researchers evaluat-
ing the various interventions. Specifically, cerebral palsy is
a multifaceted pathology, and there is great variability in
the pathology among the affected population [24]. Thus
what works best for one infant may not be optimal for
another infant. Early evaluation of the effectiveness of one
intervention may allow early change of treatment, while
neural plasticity is still greatest. For example, if an infant
is found to not be responding to a particular intervention,
an alternative could be implemented as soon as the first
intervention can be determined to not be optimal. Thus,
use of sitting postural sway as an early window into the
developing motor control system could have potential
clinical benefits.
While being able to extract information about the infant's
motor control capabilities from sitting postural sway data
could be beneficial, the best analytical method to do so
has not yet been identified. Linear measures, such as
standard deviation or range of sway, may be used to
describe how much movement there is in the postural
sway. However, the complexity of the movements that an
infant makes may be a better predictor of pathology that
simply how much movement [9]. The entropy measures
discussed above are promising because they have been
developed to assess the complexity of a time series, rather
than just assessing the amount of movement. We antici-
pate that the complexity of the postural sway will give
insight into the motor control pathology in cerebral palsy,
as it has in other motor control studies, including concus-
sion [1], grip force in Parkinson's disease [2], stereotypical
rocking in severe retardation [3], and loss of visual/cuta-
neous feedback [4]. However, the best algorithm to use for
infant sitting needs to be determined. The reason for com-
paring different parameter values is to understand the
impact of parameter choice on the outcome of the analy-
sis, as different researchers will use different parameters in
their analysis. But more importantly, in order for a meas-
ure to be clinically useful, it needs to maximize the ability
to classify individuals correctly into one population or the
other. The approach used here was to examine t-scores,
the statistic used in the independent t-test to compare two
populations, with the goal of maximizing the ability of
the algorithm to separate the two populations.
Therefore, the goal of this investigation was to determine
the utility of several different entropy algorithms in differ-
entiating between sitting posture data of infants who have
typical motor skills from sitting posture data of infants
who have delayed development of motor skills. We
hypothesized that infants with developmental delay will
have altered complexity of postural control, because opti-
mal variability theory suggests that pathology can be asso-
ciated with either higher or lower complexity of
movement [7]. Further, we hypothesized that asymmetric
measures of postural control will vary in the infants with
developmental delay as compared to typically developing
infants in the anterior-posterior direction (forward-back-
wards direction), since falling forward results in a soft
landing on the legs, but falling backwards needs to be
more carefully controlled.
Methods
Subjects
Infants were recruited into the study when they were just
developing the ability to sit upright, and all infants partic-
ipated for several months. However, the data used for this
analysis is only from the last session for each infant, so it
represents the most mature sitting behavior that was col-
lected for each infant. Recruitment was done through
Journal of NeuroEngineering and Rehabilitation 2009, 6:34 />Page 4 of 13
(page number not for citation purposes)
newsletters, flyers, and pediatric physical therapists
employed at the University. Twenty-two developmentally
delayed infants, age 11.97 months to 27.8 months (mean
= 17.70, std = 3.93); and nineteen typically developing
infants, age 7.03 to 9.8 months (mean = 8.13, std = 0.71)
participated in the study. Infants in the developmentally
delayed group were diagnosed with cerebral palsy, or else
were developmentally delayed and at risk for cerebral
palsy. At risk infants met one or more of the following
conditions: premature delivery, brain bleeding (of any
level of severity), diagnosis of periventricular leukomala-
cia, or significantly delayed gross motor development as
measured on standardized testing. Because a definitive
diagnosis of cerebral palsy could not been made by our
collaborating physicians, we refer to these infants as
developmentally delayed, and all scored below 1.5 stand-
ard deviations below the mean for their corrected age on
the Peabody Gross Motor Scale [25]. Exclusion criteria
included having an untreated, diagnosed visual impair-
ment, a diagnosed hip dislocation or subluxation greater
than 50%, or an age outside the range 5 months to 24
months at the start of the study, which was 4 months prior
to the data collection session used for this analysis. Typi-
cally developing infants were screened for normal devel-
opment by a physical therapist prior to admission into the
study, being excluded if they failed to score above 0.5
standard deviations below the mean on the Peabody
Gross Motor Scale, had a diagnosed visual impairment,
had a diagnosed musculoskeletal problem, or were older
than five months at the start of the study. A consent form
was signed by a parent of all infant participants, and all
procedures were approved by the University of Nebraska
Medical Center Institutional Review Board.
Data collection
For data acquisition, infants sat on an AMTI force plate
(Watertown, MA), interfaced to a computer system run-
ning Vicon data acquisition software (Lake Forest, CA).
Center of Pressure (COP) data were acquired through the
Vicon software at 240 Hz, in order to be above a factor of
ten higher than the highest frequency that contained rele-
vant signal as established via spectral analysis from pilot
work. Segments of usable (described below) data were
analyzed using custom MatLab software (MathWorks,
Nantick, MA). No filtering was performed in order to not
alter the entropy results [26]. Trunk and pelvis markers
were also placed on the infant, but the marker data was
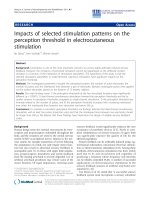
not analyzed for this study. An assistant sat to the left side
of the infant during data acquisition, and a parent or rela-
tive (typically the mother) sat in front of the infant, for
comfort and support, as well as to keep the infant's atten-
tion focused on toys held in front of the infant (Fig. 1).
Trials were recorded including force plate data and video
data from the back and side views. Afterwards segments
were selected by viewing the corresponding video. Seg-
ments of data with 2000 time steps (8.3 seconds at 240
Hz) were selected from these trials by examination of the
video. The COP data allows medial-lateral (side-to-side)
and anterior-posterior (front to back) to be analyzed sep-
arately. Acceptable segments were required to have no cry-
ing or long vocalization, no extraneous items (e.g. toys)
on the force platform, neither the assistant nor the mother
were touching the infant, the infant was not engaged in
rhythmic behavior (e.g. flapping arms), and the infant
had to be sitting and could not be in the process of falling.
Data analysis
Symbolic entropy
Calculation of symbolic entropy was performed on pos-
tural sway data in both the medial-lateral movement, and
in the anterior-posterior movement, using the methodol-
ogy presented by Aziz and Arif [19]. It is a four step proc-
ess:
1. Convert the time series into a binary symbol series
based on a threshold value. Time series data points below
the threshold are replaced by 0, those above the threshold
value are replaced by 1.
With a threshold of 0.5718 (mean of the data) is con-
verted to the following symbol series:
2. Words are formed from the symbols, each with a word
length L. For our example, using a word length of three:
Example time series :
{. . . . . .0 6073 0 8768 0 7129 0 4104 0 3791 0 1073 0 }4267 0 6073 0 8768 0 7129
Symbol series : { }1110000111
Infant sits on force platform for data collection, with researcher and parent near byFigure 1
Infant sits on force platform for data collection, with
researcher and parent near by.
Journal of NeuroEngineering and Rehabilitation 2009, 6:34 />Page 5 of 13
(page number not for citation purposes)
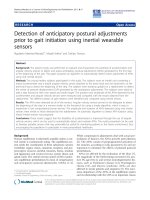
that is then represented as a word series (Fig 2c):
3. The word series can be transformed by conversion of
the binary into decimal: (000 = 0, 001 = 1, 010 = 2, 011 =
3, 100 = 4, 101 = 5, 110 = 6, 111 = 7) into a word symbol
series:
4. Shannon's entropy can be calculated from this word
symbol series, and then corrected and normalized as
described by Aziz and Arif [19]. However, it is this process
of conversion to a symbolic time series that is critical in
finding relevant patterns in the time series.
The threshold value is a key aspect of the process, as points
in the time series are either above or below the threshold
value. Selection of too low of a threshold produces more
ones than zeros, with a correspondingly high number of
words with mostly ones. Conversely selecting too high of
a threshold value results in more zeros in the symbol
series, with a correspondingly high number of words with
mostly zeros. If the symbol series is mostly ones (or
mostly zeros) then the corresponding entropy will be low,
and the complexity of the time series will not be appropri-
ately captured in the result. Thus selection of a threshold
value must be done carefully. One method is to select the
mean value for the time series, thereby ensuring that half
of the symbols will be zeros and half will be ones, as was
done by Aziz and Arif [19]. As an example, consider the
{}111 0 0 0 0111
etc
{( )( )( )( )( )( )( )( )}111 110 100 000 000 001 011 111
{}76400137
Entropy calculationsFigure 2
Entropy calculations. Entropy calculations: A. time series data. B. Approximate entropy counts similar vectors; here two
similar vectors are shown in bold. C. Symbolic entropy with one threshold creates a time series based on whether a point is
above or below the mean. Note that the value changes as the time series crosses the threshold. D. Two thresholds allow sen-
sitivity to movement that is not close to the center, and thus closer to the presumed edge of the base of support.
Journal of NeuroEngineering and Rehabilitation 2009, 6:34 />Page 6 of 13
(page number not for citation purposes)
analysis with a word length of three. The words that are
encoded with this approach will have a value 0 (000) if
the infant stays on the low side of the mean for the time
interval that corresponds to that word; or a value of 7
(111) if the infant stays on the high side of the mean for
the time interval that corresponds to that word. The only
way the word will have a value of other than 0 or 7 will be
if the infant moves past the average value during the time
interval that corresponds to that particular word. The
entropy value calculated with this approach will then be a
reflection of the movement back and forth past this mean
value. The important question is whether this reflects a
clinically meaningful measure or not.
Control of the system near the average value may not be
the most sensitive measure of physiologic function of the
postural control system. It may be that control towards
the extreme values of postural sway, where there is a
greater likelihood of falling over, would be more diagnos-
tic of pathology in neuromuscular control. With just a sin-
gle threshold value in the symbolic entropy, this can not
really be explored fully. Thus a second method of calculat-
ing the symbolic entropy was devised with two threshold
values. Choosing values of 0.3 and 0.8 for the threshold
values, the time series
is converted to the symbol series (Fig. 2d):
where 0 indicates a data point below the lower threshold,
2 indicates a data point above the upper threshold, and 1
indicates a data point in between the thresholds. Again,
using a word length of three for this example, the follow-
ing words are obtained:
with a word length of three and three symbols possible,
there are 3^3 = 27 possible words, coded from 0 to 26 as
follows:
So that the word series formed is:
As with the single threshold symbolic entropy, Shannon's
entropy is calculated from the word series, and then the
normalized corrected Shannon's entropy is calculated.
The thresholds in all cases were based on the mean value
of each time series, and new threshold values were calcu-
lated for each time series. In some cases of multiple
thresholds, the thresholds were determined from the
standard deviation of the time series. The strategy in these
calculations is to examine a movement at each time step
as it relates to the overall movement in that time series. In
other cases, the thresholds were set as a certain number of
millimeters above or below the mean. The strategy in
these calculations is to examine at the actual distance
moved in millimeters at each time step. In most cases the
thresholds were set symmetrically, with the same distance
above and below the mean being used. However, a few
non-symmetric thresholds were also investigated. For
example, 0 might be assigned to data points below minus
three standard deviations, 1 assigned to data points
between minus three standard deviations and plus one
standard deviations, and 2 assigned to all data points
above one standard deviation. In this example, excursions
have to be three standard deviations away from the mean
in the left direction, but only one standard deviation in
right direction, to trigger the assignment of a different
symbol. Once the symbols have been assigned, the Shan-
non entropy is calculated, and then normalized, as was
done for the symbolic entropy, using the method of Aziz
and Arif [19]. The entire procedure is performed twice,
once for data from the anterior-posterior direction, and
once for the data from the medial-lateral direction.
Approximate entropy
The approximate entropy (ApEn) was calculated using
MatLab code developed by Kaplan and Staffin [27],
implementing the methodology of Pincus [12]. Approxi-
mate entropy is a measure of how disorderly a time series
is [12] and can be used to assess disorderliness in move-
ment when applied to COP time series data. The general
strategy in the calculation of approximate entropy is to
examine all the points in the data set for short pattern
repeats (Fig. 2a). The length of the repeat pattern is
defined by a parameter m. This is done by using a vector
of length m starting at point p
i
, and then counting how
many other vectors at other points p
j
(j ≠ i) in the time
series have a similar pattern, repeating the procedure for
all vectors of length m in the time series, and summing the
logarithm of the results. The r parameter defines how sim-
ilar a second vector has to be in order to be counted.
Another parameter, lag, indicates how many time steps
{ 0 6073 0 8768 0 7129 0 4104 0 3791 0 1073 0 4267 0 6073 0 8768 0 71129}
{}1211101121
{( ), ( ), ( ), ( ), ( ), ( ), ( ), ( )}121 211 111 110 101 011 112 121
000 0 100 9 200 18
001 1 101 10 201 19
002 2 102 11 202 20
010 3 110
== =
== =
== =
====
== =
== =
==
12 210 21
011 4 111 13 211 22
012 5 112 14 212 23
020 6 120 15 220 ==
== =
== =
24
021 7 121 16 221 25
022 8 122 17 222 26
{,,,,,,,}16 22 13 12 10 4 14 16
Journal of NeuroEngineering and Rehabilitation 2009, 6:34 />Page 7 of 13
(page number not for citation purposes)
there are between points in one of the length m vectors.
For example, if lag = 1, then adjacent points are used. To
calculate approximate entropy, the log of this similarity
count is normalized by the number of points in the time
series. Thus three parameters are used in this algorithm,
m, r, and lag. Typical values for biomechanics data analy-
sis are lag = 1, r = 0.2 to 0.25 times the standard deviation
of the time series, and m = 2 [2,28,29].
Statistical analysis
One goal of the statistical analysis was to find the best
entropy measure to separate the two populations, since
the entropy measure identified in this manner would pre-
sumably have the best chance of having clinically useful
sensitivity to changes in postural control with physical
therapy interventions, a long range goal of this research.
In order to assess the effectiveness in separating the two
populations (delayed versus typical development), we
used the t-score, which is a measure of the separation
between the two populations relative to the variances of
the populations. The t-scores, also called t-statistics or t-
values that are commonly used in independent t-tests
[30], were calculated by dividing the difference in means
between the two populations (mean of delayed develop-
ment minus mean of typically developing) by the root
mean square of the standard deviations, for each set of
parameters used for each type of entropy, for COP data
from both anterior-posterior and medial-lateral direc-
tions. A negative sign on the t-score indicates that the
mean of the data from the typically developing is larger
than the mean of the data from delayed development. The
t-score indicates how much the two populations overlap
for the given measure, with larger magnitude indicating
less overlap.
The analysis includes multiple comparisons, but they are
not all independent. In other words, the entropy calcu-
lated with one set of parameters is correlated with the
entropy calculated with a slightly different set of parame-
ters, and values of t scores in the tables 1, 2, 3 and 4 are
similar to values nearby. We have 2 types of entropy
(approximate entropy and symbolic entropy) and 3
parameters for each (approximate entropy has m, r, and
lag; symbolic entropy has number of threshold values,
position of threshold, and symmetry of thresholds). Thus,
there are 2 times 3 equal with 6 parameters that we have
adjusted independently. This number times 2 (for pos-
tural sway in the two directions: the anterior-posterior and
medial-lateral) gives a total of 12. The Bonferroni correc-
tion requires the p-value to be adjusted for the number of
independent comparisons. Thus, we set the p
crit
= .05/12 =
.00417, corresponding to a t-score of magnitude 3.04 for
a t-tailed test with 39 degrees of freedom (dof = n
1
+ n
2
–
2; where n
1
and n
2
are the number of subjects sampled
from the two populations).
Results
The t-score results (Table 1) indicated that the symbolic
entropy does find significant differences between the
medial-lateral postural sway of typically developing
infants compared to infants with delayed development.
The t-score results in the anterior-posterior direction were
less able to detect separation between the two populations
(Table 2). The largest t-scores are for two threshold analy-
sis with non-symmetric thresholds, as presented in last
row of two-threshold analyses in Table 1. The larger mag-
nitude t-scores (Table 1) are connected with two thresh-
old values being assigned relatively far away from the
mean, with the thresholds assigned on the order of three
standard deviations above and below the mean value of
the COP. This is consistent with the notion that control
near the extreme positions (i.e. far to the right or far to the
left) is important, since poor control near the extreme val-
ues of the COP may result in a fall. The best threshold of
those tested was the mean-3 std, mean+1 std. This means
that excursions farther away from the mean to the left side
(mean -3 std) and excursions not as far away to the right
side (mean + 1 std) were the important differences
between the populations. A word length of about 4 to 7
was found to be the most successful. The largest magni-
tude t-score of -3.48 corresponds to p-value equal with
0.00125 for a two-tailed test and for degrees of freedom
equal with 39. While the separation found between the
two populations by this measure of entropy is considered
statistically significant, the clinical significance of the
measure identified here would have to be determined
with additional experimentation.
The approximate entropy algorithm was also capable of
detecting separation between the infants with typical
development and the infants with delayed development.
As with the symbolic entropy, the largest separations were
seen between typical development and delayed develop-
ment in the medial-lateral direction. Also, as with sym-
bolic entropy, the larger t-scores for approximate entropy
were negative, indicating that entropy calculated from
postural sway data of infants with typical development is
higher that entropy calculated from postural sway data of
infants with delayed development. Overall, the best
approximate entropy result (t-score = -3.48) was with lag
= 4, m = 2, and r = 3*std. However several other combina-
tions presented also larger values than the critical t value
of 3.04, indicating significant differences between the two
populations.
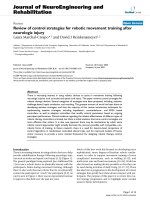
In order to visually examine the effect of these parameters
on the distribution of the entropy values, plots of the
entropy values for the medial-lateral postural sway were
calculated with two different methods (Fig 3). The top
plot in Fig 3 shows the approximate entropy values that
were obtained using the following parameters: m = 2, r =
Journal of NeuroEngineering and Rehabilitation 2009, 6:34 />Page 8 of 13
(page number not for citation purposes)
Table 1: Symbolic entropy t-scores for comparison of medial-lateral postural sway
Word length used in symbolic entropy calculation
One threshold
12345678910
M -0.93 -0.68 0.77 -1.85 -1.44 -1.40 -1.13 -1.05 -1.12 -1.18
Two thresholds
m - .01 std, m + .01 std -1.20 -1.61 -1.62 -1.47 -1.39 -1.25 -1.24 -1.22 -1.31 -1.33
m - .1 std, m + .1 std -1.26 -0.32 -0.41 -0.71 -0.72 -0.88 -1.07 -1.23 -1.30 -1.31
m - .2std, m + .2std -0.48 -0.86 -0.67 -1.19 -1.35 -1.53 -1.46 -1.42 -1.32 -1.21
m - .5 std, m + .5 std 0.37 -1.23 -1.15 -0.51 -0.61 -0.77 -0.84 -1.03 -1.13 -1.21
m - 1 std, m + 1 std 0.44 0.29 -0.53 -1.70 -1.98 -2.10 -1.86 -1.64 -1.38 -1.22
m - 2 std, m + 2 std -0.61 -1.07 -1.15 -0.71 -0.49 -0.43 -0.39 -0.36 -0.33 -0.31
m - 2.5 std, m + 2.5 std -1.13 -1.04 -1.20 -1.13 -0.93 -0.82 -0.77 -0.76 -0.75 -0.77
m - 2.8 std, m + 2.8 std -0.98 -1.30 -1.52 -1.70 -1.95 -1.99 -2.01 -2.02 -2.00 -1.97
m - 2.9 std, m + 2.9 std -0.97 -1.38 -1.66 -1.74 -1.81 -1.82 -1.84 -1.92 -2.00 -2.05
m - 3 std, m + 3 std -2.68 -2.76 -2.57 -2.36 -2.52 -2.59 -2.64 -2.68 -2.71 -2.79
m - 3.1 std, m + 3.1 std -2.31 -2.67 -2.85 -2.85 -2.73 -2.62 -2.55 -2.56 -2.59 -2.62
m - 3.2 std, m + 3.2 std -1.56 -1.92 -2.16 -2.24 -2.30 -2.32 -2.31 -2.31 -2.34 -2.35
m - 3.5 std, m + 3.5 std -2.10 -2.24 -2.25 -2.24 -2.25 -2.25 -2.25 -2.26 -2.27 -2.29
m - 1 mm, m + 1 mm -0.34 -1.79 -1.85 -1.69 -1.11 -1.08 -1.18 -1.34 -1.41 -1.45
m - 10 mm, m + 10 mm -0.30 -0.49 -0.25 -0.17 -0.30 -0.46 -0.57 -0.64 -0.67 -0.67
m - 15 mm, m + 15 mm 0.61 0.59 0.42 0.19 0.06 -0.05 -0.04 -0.03 0.00 0.04
m - 20 mm, m + 20 mm 0.64 0.65 0.58 0.59 0.60 0.57 0.54 0.54 0.55 0.55
m - 25 mm, m + 25 mm -0.39 -0.53 -0.39 -0.38 -0.30 -0.26 -0.27 -0.28 -0.29 -0.32
m - 22 mm, m+ 22 mm -0.40 -0.53 -0.52 -0.54 -0.51 -0.45 -0.47 -0.47 -0.47 -0.50
m - 30 mm, m + 30 mm -0.07 -0.14 0.14 0.43 0.48 0.50 0.51 0.50 0.48 0.46
m - 35 mm, m + 35 mm 0.30 0.46 0.65 0.77 0.82 0.84 0.85 0.85 0.84 0.83
m - 40 mm, m + 40 mm 0.22 0.45 0.65 0.77 0.82 0.82 0.82 0.81 0.80 0.79
m - 2 std, m + 3 std (A) -1.30 -1.40 -1.20 -0.86 -0.73 -0.63 -0.60 -0.62 -0.65 -0.68
m - 1std, m + 3 std (A) -1.39 -1.54 -1.45 -1.04 -1.07 -1.06 -0.95 -0.81 -0.67 -0.63
m - 3 std, m + 2 std (A) -1.86 -2.19 -2.28 -1.85 -1.57 -1.46 -1.34 -1.22 -1.13 -1.08
m - 3 std, m + 1 std (A) -2.52 -2.64 -2.61 -3.33* -3.42* -3.48* -3.05* -2.68 -2.28 -1.99
Three thresholds
m - .01 std, m, m + .01 std -1.16 -1.77 -2.23 -2.76 -2.25 -1.20 -0.72 -1.05 -1.14 -1.85
m - .1 std, m, m + .1 std -1.49 0.91 -1.11 -1.16 -2.50 -2.15 -1.47 -2.08 -2.77 -1.60
m - .2std, m, m + .2std -2.67 -1.38 -1.43 -0.54 0.57 0.64 -0.58 -0.58 -0.19 0.43
m - .5 std, m, m + .5 std -0.27 0.19 0.15 -1.13 -1.33 -1.51 -1.91 -2.51 -1.69 -0.70
m - 1 std, m, m + 1 std -0.18 -0.31 -0.60 -1.30 -0.68 -0.93 -0.63 -1.11 -2.70 -2.17
m - 2 std, m, m + 2 std -2.89 -2.58 -2.35 -2.66 -3.07 -2.29 -1.57 -0.61 -0.37 0.10
m - 2.5 std, m, m + 2.5 std -2.24 -1.45 -0.95 -1.41 -1.24 -1.40 -0.99 -1.33 -2.59 -2.21
m - 2.8 std, m, m + 2.8 std -1.32 -1.05 -0.92 -1.16 -1.71 -1.46 -1.64 -1.57 -1.71 -1.53
m - 2.9 std, m, m + 2.9 std -1.62 -1.44 -1.54 -1.54 -1.62 -1.51 -1.53 -2.37 -1.37 -1.04
m - 3 std, m, m + 3 std -1.25 -0.96 -1.04 -1.50 -1.16 -1.67 -2.09 -3.06 -1.90 -1.42
m - 3.1 std, m, m + 3.1 std -1.32 -0.94 -1.21 -1.24 -1.09 -1.01 -1.04 -1.15 -1.08 -1.22
m - 3.2 std, m, m + 3.2 std -1.02 -1.26 -1.55 -2.10 -1.52 -1.46 -1.07 -1.46 -1.41 -1.12
m - 3.5 std, m, m + 3.5 std -2.04 -1.74 -1.68 -1.63 -1.15 -0.69 -1.28 -1.34 -1.05 -0.89
m - 1 mm, m, m + 1 mm 0.80 0.88 1.68 1.73 1.15 0.67 0.96 0.37 0.24 -0.13
m - 10 mm, m, m + 10 mm -1.24 -2.08 -2.20 -1.86 0.91 -0.22 0.24 0.92 1.43 1.48
m - 15 mm, m, m + 15 mm 0.41 0.57 1.52 -0.09 -0.21 -1.07 -0.55 -0.54 -0.92 -2.06
m - 20 mm, m, m + 20 mm 0.49 1.46 1.76 1.45 1.28 0.41 1.21 0.90 0.95 0.96
m - 25 mm, m, m + 25 mm 1.80 0.55 1.04 1.76 0.70 0.80 0.85 1.24 0.55 0.82
m - 22 mm, m, m+ 22 mm -0.03 -1.25 -0.57 -0.45 -0.76 -1.78 -1.50 -1.21 1.63 0.61
m - 30 mm, m, m + 30 mm 1.26 0.59 1.09 0.97 1.00 1.11 0.83 -0.41 -0.27 -1.44
m - 35 mm, m, m + 35 mm 0.06 0.48 1.04 1.73 1.04 0.52 0.62 1.14 1.02 0.55
m - 40 mm, m, m + 40 mm -0.23 -0.20 -0.21 -0.12 0.81 0.17 0.75 0.68 0.14 0.64
m - 2 std, m, m + 3 std (A) 1.26 0.80 0.62 1.15 1.04 0.79 1.00 0.92 0.90 1.01
m - 1std, m, m + 3 std (A) 0.85 0.37 0.75 0.61 0.26 0.84 1.30 1.84 1.33 0.91
m - 3 std, m, m + 2 std (A) -0.37 -0.12 0.65 0.65 0.61 0.64 0.64 0.66 0.92 0.42
m - 3 std, m, m + 1 std (A) 1.08 0.94 1.09 1.02 0.99 1.06 1.45 0.02 -0.25 0.13
t-scores for comparison of medial-lateral postural sway of infants with typical development and with delayed development, based on symbolic
entropy calculated with various thresholds and word lengths, -3.48 is the largest magnitude t-score.
Note: t-scores with magnitude equal or larger than 3.04 are indicated with * and are in bold. The "m" indicates mean value for the time series, "std"
indicates the standard deviation for the time series, and "mm" indicates millimetres of movement in the COP. (A) indicates asymmetric thresholds
were used
Journal of NeuroEngineering and Rehabilitation 2009, 6:34 />Page 9 of 13
(page number not for citation purposes)
Table 2: Symbolic entropy t-scores for comparison of anterior-posterior postural sway
Word length used in symbolic entropy calculation
One threshold
123456 789 10
M 0.67 1.63 1.48 0.83 0.68 0.52 0.69 0.80 0.91 0.95
Two thresholds
m - 1 std, m + 1 std 0.34 1.01 1.27 0.86 0.25 -0.13 -0.20 -0.25 -0.25 -0.23
m - .5 std, m + .5 std -0.25 1.17 0.51 0.11 -0.21 -0.42 -0.13 0.15 0.31 0.40
m - .2std, m + .2std 1.53 1.24 1.12 1.01 1.20 1.14 1.04 0.98 0.97 1.02
m - .1 std, m + .1 std 1.67 0.52 0.80 0.86 1.08 1.31 1.62 1.79 1.87 1.92
m - .01 std, m + .01 std 1.32 0.41 0.75 0.53 0.72 0.85 0.96 1.12 1.25 1.32
m - 2 std, m + 2 std 0.94 1.24 1.54 1.36 0.99 0.47 0.27 0.17 0.11 0.07
m - 2.5 std, m + 2.5 std 0.38 0.80 1.17 1.51 1.52 1.39 1.35 1.32 1.37 1.43
m - 3 std, m + 3 std 0.21 0.54 0.93 1.16 1.16 1.13 1.09 1.07 1.05 1.01
m - 3.5 std, m + 3.5 std -0.16 -0.07 0.01 0.12 0.20 0.26 0.31 0.29 0.29 0.30
m - 2.8 std, m + 2.8 std 0.98 0.89 0.90 0.94 1.04 1.08 1.08 1.09 1.11 1.16
m - 3.2 std, m + 3.2 std 0.25 0.36 0.55 0.69 0.77 0.76 0.77 0.78 0.78 0.77
m - 3.1 std, m + 3.1 std 0.02 0.21 0.60 0.84 0.81 0.78 0.76 0.70 0.69 0.67
m - 2.9 std, m + 2.9 std 0.22 0.38 0.65 0.86 1.01 1.03 1.03 1.01 0.98 0.97
m - 1 mm, m + 1 mm 1.63 1.29 1.15 1.40 1.32 1.21 1.06 0.98 1.01 1.09
m - 10 mm, m + 10 mm -0.60 -0.28 -0.47 -0.56 -0.58 -0.67 -0.70 -0.73 -0.73 -0.74
m - 15 mm, m + 15 mm -0.74 -0.36 -0.19 -0.20 -0.45 -0.74 -0.87 -0.97 -1.08 -1.18
m - 20 mm, m + 20 mm -1.33 -1.19 -1.27 -1.39 -1.48 -1.57 -1.66 -1.69 -1.66 -1.66
m - 25 mm, m + 25 mm -0.94 -0.74 -0.89 -0.89 -0.94 -0.99 -1.02 -1.01 -1.03 -1.03
m - 22 mm, m+ 22 mm -0.81 -0.69 -0.68 -0.69 -0.77 -0.80 -0.85 -0.91 -0.95 -0.98
m - 30 mm, m + 30 mm -1.40 -1.12 -1.14 -1.20 -1.22 -1.25 -1.27 -1.30 -1.30 -1.31
m - 35 mm, m + 35 mm -2.03 -2.08 -2.11 -2.13 -2.13 -2.13 -2.12 -2.12 -2.12 -2.12
m - 40 mm, m + 40 mm -2.13 -2.15 -2.13 -2.11 -2.09 -2.07 -2.07 -2.06 -2.06 -2.05
m - 2 std, m + 3 std 0.93 1.29 1.58 1.53 1.16 0.79 0.65 0.62 0.61 0.58
m - 1std, m + 3 std -0.02 -0.07 0.25 0.51 0.31 -0.06 -0.11 -0.18 -0.26 -0.37
m - 3 std, m + 2 std 0.16 0.40 0.73 0.80 0.82 0.56 0.36 0.20 0.05 -0.02
m - 3 std, m + 1 std 0.54 1.08 1.50 1.53 1.04 0.66 0.42 0.29 0.27 0.34
Three thresholds
m - 1 std, m, m + 1 std -0.95 -1.58 -2.34 -0.94 -0.59 -0.50 0.51 0.60 -0.59 -0.60
m - .5 std, m, m + .5 std -0.53 -0.98 -1.46 -0.68 -1.09 -1.04 -2.76 -2.25 -1.29 -1.93
m - .2std, m, m + .2std 0.43 -1.09 -1.40 -1.70 -2.21 -2.88 -1.63 -0.99 -0.37 -0.96
m - .1 std, m, m + .1 std -1.18 -0.23 0.45 0.61 -0.33 -0.45 0.22 0.74 0.74 -0.65
m - .01 std, m, m + .01 std -1.01 -1.40 -2.76 -2.81 -2.02 -2.73 -3.27* -2.12 -1.38 -0.36
m - 2 std, m, m + 2 std -1.61 -1.67 -0.78 -0.40 -0.40 -1.65 -1.12 -1.83 -2.06 -3.29*
m - 2.5 std, m, m + 2.5 std -2.28 -2.37 -2.66 -2.15 -1.70 -1.13 -0.90 -0.43 -1.64 -1.70
m - 3 std, m, m + 3 std -0.99 -1.49 -1.31 -1.13 -0.94 -1.22 -2.02 -1.68 -1.89 -1.82
m - 3.5 std, m, m + 3.5 std -0.95 -1.18 -1.05 -1.41 -1.78 -2.46 -1.68 -1.47 -1.02 -1.50
m - 2.8 std, m, m + 2.8 std -1.69 -2.01 -1.22 -0.79 -1.16 -1.20 -1.01 -0.89 -0.93 -1.09
m - 3.2 std, m, m + 3.2 std -0.97 -1.17 -1.64 -1.43 -1.57 -1.54 -1.65 -1.51 -1.61 -2.30
m - 3.1 std, m, m + 3.1 std -1.49 -1.89 -1.44 -1.45 -1.11 -1.42 -1.43 -1.18 -1.03 -1.20
m - 2.9 std, m, m + 2.9 std -1.26 -1.29 -1.16 -1.10 -1.12 -1.21 -1.15 -1.23 -1.47 -1.76
m - 1 mm, m, m + 1 mm 1.03 0.30 0.06 0.24 1.73 -0.38 -0.53 -1.19 -0.75 -0.61
m - 10 mm, m, m + 10 mm 1.20 0.98 0.30 1.56 1.39 0.98 0.74 0.15 1.08 0.57
m - 15 mm, m, m + 15 mm -2.07 -1.73 1.43 0.14 0.59 1.34 1.21 1.20 1.02 0.92
m - 20 mm, m, m + 20 mm 0.87 -0.23 0.01 -1.07 -0.58 -0.42 -0.75 -2.00 -1.75 -1.61
m - 25 mm, m, m + 25 mm 1.49 1.60 1.41 0.49 1.15 0.97 1.11 1.10 0.88 -0.38
m - 22 mm, m, m+ 22 mm 1.06 1.53 0.30 0.58 0.89 1.51 0.88 0.67 1.09 1.44
m - 30 mm, m, m + 30 mm -0.45 -0.46 -0.50 -0.66 -0.62 -0.40 1.19 0.40 1.04 1.03
m - 35 mm, m, m + 35 mm 0.93 0.79 0.82 0.95 1.05 -0.52 -0.62 -1.55 -0.29 -0.33
m - 40 mm, m, m + 40 mm 1.18 1.80 1.14 0.69 0.59 1.14 1.03 0.70 0.97 0.86
m - 2 std, m, m + 3 std (A) 1.30 -0.31 -0.52 -0.59 0.43 0.42 0.41 0.45 0.45 0.47
m - 1std, m, m + 3 std (A) 0.69 1.22 1.08 0.90 1.07 1.00 0.98 1.06 1.39 -0.12
m - 3 std, m, m + 2 std (A) 0.79 0.70 0.32 0.86 1.37 1.82 1.37 0.95 0.71 1.24
m - 3 std, m, m + 1 std (A) 0.74 0.74 0.69 0.72 0.72 0.73 0.93 0.43 0.81 0.77
t-scores for comparison of anterior-posterior postural sway of infants with typical development and with delayed development, based on symbolic
entropy calculated with various thresholds and word lengths, -3.29 is the largest magnitude t-score.
Note: t-scores with magnitude equal or larger than 3.04 are indicated with * and are in bold. The "m" indicates mean value for the time series, "std"
indicates the standard deviation for the time series, and "mm" indicates millimetres of movement in the COP. (A) indicates asymmetric
thresholds were used
Journal of NeuroEngineering and Rehabilitation 2009, 6:34 />Page 10 of 13
(page number not for citation purposes)
0.2 std, and lag = 4. The bottom plot shows asymmetric
symbolic entropy values that were obtained using two
thresholds, mean – 3 std and mean + 1 std, and a word
length of seven. This plot visually illustrates the benefit of
using a method with a larger magnitude t-score for analy-
sis of sitting postural sway in the medial-lateral direction
to compare these two populations, as the populations can
be seen to overlap quite a bit with the standard approxi-
mate entropy analysis (top) where as the separation is bet-
ter in the asymmetric symbolic entropy analysis (bottom).
Discussion
One aspect of this work was the exploration of the effects
of various parameters in the entropy algorithms. While
selection of the parameters used in the calculation of
entropy was found to affect the results, the parameter val-
ues that give rise to statistically significant comparisons
show consistent trends, with the typically developing
infants having higher entropy values in sitting postural
sway, and sway in the medial-lateral having the bigger dif-
ferences between the populations.
Furthermore, two hypotheses were proposed in the intro-
duction. One was that the complexity of postural sway of
infants with delayed development would be altered as
compared to that for infants with typical development.
Importantly, a finding of this study was that the medial-
lateral postural sway in sitting is a useful type of data to
compare infants with delayed development with those
who are typically developing, and that infants with typical
development are seen to have more information entropy
in their movement in this dimension than infants with
delayed development, as measured by approximate
entropy and symbolic entropy. This is consistent with the
notion that development of a postural control strategy
involves an exploration of the many possible solutions to
Bernstein's degrees of freedom problem in order to arrive
at a control strategy with optimal variability [7]. In this
study we found that infants with typical development
appear to be exploring more varied motor strategies, giv-
ing rise to a higher level of complexity in their postural
sway. Therefore, healthy postural control is seen to be
more complex as predicted by the optimal movement var-
iability [7].
The second hypothesis, that lack of symmetry in anterior-
posterior posterior control would be different between
infants with delayed development and those with typical
development, was not supported. A surprising result of
this study was that the asymmetric symbolic entropy in
the medial-lateral direction (left-right movement) found
larger separation between postural sway in infants with
developmental delay and those with typical development.
We had expected this result in the anterior-posterior axis,
since the result of a large excursion in the posterior direc-
tion is falling over, whereas a large excursion in the ante-
rior direction merely results in the infant resting the torso
on top of the legs. In fact, this was the motivation for try-
ing the non-symmetric thresholds. However, the impact
of the non-symmetric threshold was actually seen in the
medial-lateral direction. As described in the experimental
section, a researcher is always positioned to the left of the
infant. Perhaps having a large object in the visual field
unilaterally alters the infants' postural sway, as vision has
been shown to impact standing postural sway in infants,
although the effect was only seen in infants after walking
skills had been acquired [31]. If integration of visual infor-
mation is different in the two populations of infants, dif-
ferences in postural sway could result. Alternatively, the
non-symmetric postural sway may be due to some type of
psychological response that the infants have to the pres-
ence of the adult on the left side, and this response is dif-
ferent in the two populations of infants. Infants develop a
protective extension reaction [32], which is a reaction of
the arms to falling from a seated position. The protective
extension reaction develops first in the anterior direction,
typically at around 6 months. Then it develops sideways,
typically at around eight months. Finally, from about the
Table 3: Approximate entropy t-scores for comparison of medial-lateral postural sway
r value used in ApEn calculation
m lag 0.05*std 0.1*std 0.2*std 0.4*std 0.8*std 1.5*std 2.5*std 3*std 3.5*std 4*std 5*std
2 1 -0.94 -0.55 -0.46 -0.47 -0.56 -0.67 -0.20 -0.26 -1.14 -2.12 -0.76
4 1 0.58 -1.08 -1.22 -1.20 -1.37 -1.67 -1.62 -1.40 -2.26 -3.17* -2.04
8 1 1.05 -0.14 -0.63 -1.69 -1.92 -2.40 -2.52 -2.54 -2.88 -3.27* -2.69
24 -1.26-1.41-1.94-2.46-2.72-2.68-3.09 -3.32* -3.27* -3.17* -2.04
4 4 1.23 -0.17 -1.55 -2.41 -2.84 -2.81 -3.07 -3.24* -3.20* -3.10* -1.67
8 4 1.34 0.33 0.16 -2.39 -2.64 -2.64 -2.49 -2.93 -3.16* -3.13* -1.32
2 8 -1.32 -1.50 -2.18 -2.72 -2.82 -2.71 -3.02 -3.16* -3.08 -2.90 -1.54
4 8 1.64 0.46 -1.51 -2.68 -2.60 -2.47 -2.45 -2.86 -3.03 -2.91 -1.15
8 8 1.35 0.50 1.29 -1.96 -2.91 -2.06 -1.96 -2.20 -2.49 -2.83 -1.73
t-scores for comparison of medial-lateral postural sway of infants with typical development and with delayed development, based on approximate
entropy calculated with various lag and r values, -3.32 is the largest magnitude t-score.
Note: t-scores with magnitude equal or larger than 3.04 are indicated with * and are in bold.
Journal of NeuroEngineering and Rehabilitation 2009, 6:34 />Page 11 of 13
(page number not for citation purposes)
tenth month, they are able to use their arms to prevent
backwards falls. An infant who has developed this reac-
tion for sideways falling may well respond differently to
the presence of a researcher on one side than an infant
who has not yet developed this reaction. Based on this
typical development schedule of the protective extension
reaction [32], we would expect that the typically develop-
ing infants would have developed this response, where as
the infants with delayed development may not. However
we did not test the infants for the protective extension
response, so this is a speculative explanation. An alterna-
tive explanation which should be considered is that there
may be some unconscious bias in how the researcher sit-
ting next to the infants responds to near falls in the two
populations, perhaps being more protective of falling
movement away from themselves in infants that they per-
ceive as having less control. The reason for the success of
non-symmetric thresholding in the medial-lateral axis is
not clear and warrants further investigation.
The results of this study indicate that optimization of the
entropy algorithm for infant sitting postural sway data can
greatly improve the ability to separate the infants with
developmental delay from typically developing infants.
However, there is still significant overlap of even the best
entropy measures, which could result in false positives or
false negatives if used in a clinical setting. Further
improvements may be possible, such as optimization of
the number of thresholds used in the calculation of sym-
bolic entropy, optimization of the actual threshold values,
and further exploration of non-symmetric thresholds.
Additionally, there are other entropy algorithms that have
not yet been applied to infant sitting postural sway data,
which may offer an improvement. Multiscale entropy
analysis [16] has been used on gait data [33] and on heart
rate data [34]. Von Newman entropy, originally derived
for quantum mechanics applications, has been applied to
EEG data [35]. Kolmogorov entropy has been used on
EEG data for epileptic seizure prediction [36] and on cell
patch-clamp recordings [37]. Success in finding an algo-
rithm that can objectively quantify pathologic motor pat-
terns will help to identify infants who would benefit from
therapeutic intervention, as well as provide an important
research tool for assessment of various interventions for
developmentally delayed infants.
Based on our exploration of different parameter combina-
tions, we can make the following suggestions to research-
ers interested in using entropy measures in their work.
Table 4: Approximate entropy t-scores for comparison of anterior-posterior postural sway
r value used in ApEn calculation
m lag 0.05*std 0.1*std 0.2*std 0.4*std 0.8*std 1.5*std 2.5*std 3*std 3.5*std 4*std 5*std
2 1 0.83 0.82 0.84 0.99 0.99 1.03 0.92 1.46 1.14 0.54 0.69
4 1 0.50 0.17 0.25 0.60 0.61 0.73 0.36 0.87 0.59 0.28 0.12
8 1 -1.04 0.68 0.41 0.28 0.24 0.40 -0.19 0.53 0.30 0.22 0.17
2 4 0.61 0.60 0.46 0.16 0.02 0.40 -0.30 0.41 0.23 0.24 0.04
4 4 1.15 1.05 0.84 0.48 0.17 0.17 -0.38 0.39 0.24 0.31 0.20
8 4 -0.80 0.55 1.03 1.01 0.39 0.49 -0.48 0.44 0.12 0.36 0.46
2 8 1.27 1.01 0.90 0.36 0.10 0.21 -0.33 0.39 0.25 0.35 0.17
4 8 0.15 1.26 1.09 0.90 0.36 0.54 -0.42 0.32 0.18 0.42 0.39
8 8 -1.04 -0.49 0.90 1.47 0.85 0.34 -0.05 0.21 0.20 0.34 0.43
t-scores for comparison of anterior-posterior postural sway of infants with typical development and with delayed development, based on
approximate entropy calculated with various m, lag and r values, are all lower than 3.04.
Note: No t-scores with magnitude equal or larger than 3.04 are in this table.
Distribution of entropy valuesFigure 3
Distribution of entropy values. Distribution of entropy
values for medial-lateral postural sway for infants who are
typically developing versus those who have delayed develop-
ment. Top plot (t-score = -1.94) is approximate entropy with
r = 0.2 std, lag = 4, m = 2. Bottom plot (t-score = -3.48) is
symbolic entropy with word length = 6, thresholds of -3 std
and +1 std. Several of the subjects have the same symbolic
entropy values as other subjects; the same number time
series were analyzed for both top and bottom plots. The
populations (DD and TD) are much better separated by use
of symbolic entropy than approximate entropy.
Journal of NeuroEngineering and Rehabilitation 2009, 6:34 />Page 12 of 13
(page number not for citation purposes)
Asymmetry can be an interesting aspect of postural sway
data and of other time series data. However, asymmetry is
not often probed, or if it is, then two separate force plates
are required [38]. Use of the asymmetric symbolic entropy
provides a means to investigate asymmetry on postural
sway with data from a single force plate. Approximate
entropy is a useful choice for an entropy measure, but the
values for the parameters of m, lag, and r need to be opti-
mized for the data set under investigation, rather than
accepting standard values for these parameters.
Conclusion
Information entropy measures can be used to characterize
randomness in time series data. We have used approxi-
mate entropy and symbolic entropy in infant sitting pos-
tural sway for infants with typical development, and
infants with delayed development, where the develop-
mental delay was likely due to cerebral palsy. While selec-
tion of the parameters used in the calculation of entropy
was found to affect the results, differences between the
two populations found were to be consistent for statisti-
cally significant results. The significant results were that
infants with typical development were found to have less
repetition of fixed patterns in the medial-lateral direction
of postural sway than infants with developmental delay.
This result is consistent with the notion that infants with
typical development are exploring a wider range of move-
ment patterns as they learn to control upright sitting pos-
ture. This result also suggests that therapeutic
interventions that encourage the exploration of varied
movement patterns would be beneficial.
Consent
Written consent for publication was obtained from the
infant's parent (Figure 1).
Competing interests
The authors declare that they have no competing interests.
Authors' contributions
JED was involved with data collection, data analysis, and
drafting of the manuscript. SLD was involved in data col-
lection. RTH and AK were involved in data collection and
subject recruiting. WAS and NS supervised the design and
coordination of the study, and NS additionally supervised
manuscript preparation. All authors read and approved
the final manuscript.
Acknowledgements
This work was supported by NIH (K25HD047194), NIDRR
(H133G040118), the Nebraska Research Initiative, the University of
Nebraska Presidential Graduate Fellowship, grant T73MC00023 from the
Maternal and Child Health Bureau, Health Resources and Services Admin-
istration, Department of Health and Human Services and in part by grant
90DD0601 from the Administration on Developmental Disabilities (ADD),
Administration for Children and Families, Department of Health and
Human Services.
References
1. Cavanaugh JT, Guskiewicz KM, Giuliani C, Marshall S, Mercer VS,
Stergiou N: Recovery of Postural Control after Cerebral Con-
cussion: New Insights Using Approximate Entropy. J Athl Train
2006, 41(3):305-313.
2. Vaillancourt DE, Slifkin AB, Newell KM: Regularity of Force
Tremor in Parkinson's Disease. Clin Neurophysiol 2001,
112(9):1594-603.
3. Hong SL, Bodfish JW, Newell KM: Power-Law Scaling for Macro-
scopic Entropy and Microscopic Complexity: Evidence from
Human Movement and Posture. Chaos 2006, 16(1):013135.
4. Hong SL, Manor B, Li L: Stance and Sensory Feedback Influence
on Postural Dynamics. Neurosci Lett 2007, 423(2):104-8.
5. Schmidt RA: A Schema Theory of Discrete Motor Skill Learn-
ing. Psychol Rev 1975, 82:225-260.
6. Kelso JAS: Dynamic Patterns: The Self Organization of Brain and Behavior
Cambridge, MIT Press; 1995.
7. Stergiou N, Harbourne RT, Cavanaugh JT: Optimal Movement
Variability: A New Theoretical Perspective for Neurologic
Physical Therapy. J Neurol Phys Ther 2006, 30(3):120-129.
8. Hadders-Algra M: Putative neural substrate of normal and
abnormal general movements. Neurosci Biobehav Rev 2007,
31(8):1181-90.
9. Hadders-Algra M: General Movements: A Window for Early
Identification of Children at High Risk for Developmental
Disorders. J Pediatr 2004, 145(2 Suppl):S12-S18.
10. Shannon CE: A Mathematical Theory of Communication. Bell
System Technical Journal 1948, 27:379-423.
11. Shannon CE: A Mathematical Theory of Communication. Bell
System Technical Journal 1948, 27:623-656.
12. Pincus SM: Approximate Entropy as a Measure of System
Complexity. Proc Natl Acad Sci USA 1991, 88:2297-2301.
13. Pincus SM, Goldberger AL: Physiological Time-Series Analysis:
What Does Regularity Quantify? Am J Physiol Heart Circ Physiol
1994, 266(4):H1643-H1656.
14. Georgoulis AD, Moraiti C, Ristanis S, Stergiou N: A Novel
Approach to Measure Variability in the Anterior Cruciate
Ligament Deficient Knee During Walking: The Use of the
Approximate Entropy in Orthopaedics. J Clin Monit Comput
2006, 20(1):11-18.
15. Richman JS, Moorman JR: Physiological Time-Series Analysis
using Approximate Entropy and Sample Entropy. Am J Physiol
Heart Circ Physiol 2000, 278(6):H2039-H2049.
16. Costa M, Goldberger AL, Peng C-K: Multiscale Entropy Analysis
of Complex Physiologic Time Series. Phys Rev Lett 2002, 89(6):.
17. Chen W, Wang Z, Xie H, Yu W: Characterization of Surface
EMG Signal Based on Fuzzy Entropy. IEEE Trans Neural Syst
Rehabil Eng 2007, 15(2):266-72.
18. Harbourne RT, Stergiou N: Nonlinear Analysis of the Develop-
ment of Sitting Postural Control. Dev Psychobiol 2003,
42:368-77.
19. Aziz W, Arif M: Complexity Analysis of Stride Interval Time
Series by Threshold Dependent Symbolic Entropy. Eur J Appl
Physiol 2006, 98:30-40.
20. Harbourne RT, Giuliani C, Neela JM: A Kinematic and Electromy-
ographic Analysis of the Development of Sitting Posture in
Infants. Dev Psychobiol 1993, 26(1):51-64.
21. de Graaf-Peters VB, Bakker H, van Eykern LA, Otten B, Hadders-
Algra M: Postural Adjustments and Reaching in 4- and 6-
Month-Old Infants: An EMG and Kinematical Study. Exp Brain
Res 2007, 181(4):647-56.
22. Carlberg EB, Hadders-Algra M: Postural Dysfunction in Children
with Cerebral Palsy: Some Implications for Therapeutic
Guidance. Neural Plast 2005, 12(2–3):221-228.
23. Blauw-Hospers CH, de Graaf-Peters VB, Dirks T, Bos AF, Hadders-
Algra M: Does Early Intervention in Infants at High Risk for a
Developmental Motor Disorder Improve Motor and Cogni-
tive Development? Neurosci Biobehav Rev 2007, 31(8):1201-1212.
24. Shapiro BK: Cerebral Palsy: A Reconceptualization of the
Spectrum. J Pediatr 2004, 145(2 Suppl):S3-7.
25. Folio MR, Fewell RR: Peabody Developmental Motor Scales 2nd edition.
Austin TX, Pro-ed Inc; 2000.
Publish with BioMed Central and every
scientist can read your work free of charge
"BioMed Central will be the most significant development for
disseminating the results of biomedical research in our lifetime."
Sir Paul Nurse, Cancer Research UK
Your research papers will be:
available free of charge to the entire biomedical community
peer reviewed and published immediately upon acceptance
cited in PubMed and archived on PubMed Central
yours — you keep the copyright
Submit your manuscript here:
/>BioMedcentral
Journal of NeuroEngineering and Rehabilitation 2009, 6:34 />Page 13 of 13
(page number not for citation purposes)
26. Rapp PE, Albano AM, Schmah TI, Farwell LA: Filtered Noise Can
Mimic Low-Dimensional Chaotic Attractors. Phys Rev E 1993,
47(4):2289-2297.
27. Kaplan D, Staffin P: Software for Heart Rate Variability. 1996
[ />].
28. Stergiou N, Buzzi UH, Kurz MJ, Heidel J: Nonlinear Tools in
Human Movement. In Innovative Analysis of Human Movement: Ana-
lytical Tools for Human Movement Research Edited by: Stergiou N.
Champaign IL, Human Kinetics; 2004:63-90.
29. Vaillancourt DE, Newell KM: The Dynamics of Resting and Pos-
tural Tremor in Parkinson's Disease. Clin Neurophysiol 2000,
111(11):2046-2056.
30. Zar JH: Biostatistical Analysis 4th edition. Upper Saddle River, NJ: Pren-
tice-Hall; 1999.
31. Sundermier L, Woollacott MH: The influence of vision on the
automatic postural muscle responses of newly standing and
newly walking infants. Exp Brain Res 1998, 120(4):537-540.
32. Pearson PH, Williams CE: Physical Therapy Services in the Developmental
Disabilities Springfield IL, Thomas Books; 1972.
33. Costa M, Peng C-K, Goldberger AL, Hausdorff JM: Multiscale
Entropy Analysis of Human Gait Dynamics. Physica A 2003,
330:53-60.
34. Costa M, Cygankiewicz I, Zareba W, Bayes de Luna A, Goldberger
AL, Lobodzinski S: Multiscale Complexity Analysis of Heart
Rate Dynamics in Heart Failure: Preliminary Findings from
the MUSIC Study. Comput Cardiol 2006, 33:101-103.
35. Kamousi B, Amini AN, He B: Classification of Motor Imagery by
Means of Cortical Current Density Estimation and Von Neu-
man Entropy. J Neural Eng 2007, 4:7-25.
36. van Drongelen W, Nayak S, Frim DM, Kohrman MH, Towle VL, Lee
HC, McGee AB, Chico MS, Hecox KE: Seizure Anticipation in
Pediatric Epilepsy: Use of Kolmogorov Entropy. Pediatr Neurol
2003, 29(3):207-213.
37. Kleppe IC, Robinson HPC: Correlation Entropy of Synaptic
Input-Output Dynamics. Physical Review E Statistical, Nonlinear, and
Soft Matter Physics 2006, 74(4 pt 1):041909.
38. Myklebust JB, Lovett EG, Myklebust BM, Reynolds N, Milkowski L,
Prieto TE: Two-dimensional coherence for measurement of
asymmetry in postural steadiness. Gait Posture 2009, 29(1):1-5.