Developments in Heat Transfer Part 4 doc
Bạn đang xem bản rút gọn của tài liệu. Xem và tải ngay bản đầy đủ của tài liệu tại đây (2.46 MB, 40 trang )
Developments in Heat Transfer
110
modified, while that of edge vials is strongly reduced. This is due to the contribution of the
tray band, which acts as thermal shield for the radiative heat coming from chamber walls.
Therefore, it must be remarked that, during the phase of process development, the user
has to take into account that the pressure dependence of
K
v
does not depend only on the
type of vials, but also on the configuration used for loading the product into the drying
chamber.
In general, the gravimetric procedure gives the best accuracy and robustness, even if it is
more time demanding with respect to other global methods available. However, the use of the
pressure rise test technique is strongly suggested in case of industrial apparatus, where the
gravimetric procedure is not practicable as the intervention of the user (to place temperature
sensors over the lot of vials) is limited. Therefore, it has been shown that the pressure rise
test technique (and in particular the latest developments like the DPE
+
algorithm) can be
effectively used for measuring the value of
K
v
, whichever is the scale of the equipment,
without requiring an excessive effort from the users. In addition, an estimation of the mean
value of
K
v
is more than enough for an effective description of the heat transfer of the lot, as
the effect of batch non-uniformity in a manufacturing process is less marked. A further
advantage of the pressure rise test technique is that, with respect to other global methods
like TDLAS, it requires no modifications of the equipment and its hardware.
A final comment concerns the problem of scale-up, or process transfer, of a recipe from one
unit to another one. It has been proved that the heat transfer coefficient of a specific
container can varies significantly (mainly for edge vials) with the type of equipment used,
even if the same loading configuration is used. Therefore, if this difference is relevant, the
recipe, which is usually developed in laboratory and has to be transferred on manufacturing
equipment, should be adapted to take into account the different heat transfer of the
containers.
6. Acknowledgment
Development of PRT methods for industrial apparatus has been continuously supported by
Telstar S.A. (Terrassa, Spain), whose contribution of data obtained in large scale apparatus
and financial support for this chapter is gratefully acknowledged. The authors would like to
acknowledge Giovanni Accardo, Salvatore Genco e Daniele Sorce for their valuable support
in the experimental investigation.
7. Nomenclature
a
c
energy accommodation coefficient
A
v
cross sectional area of the vial, m
2
A
sub
total sublimation area, m
2
C
1
parameter expressing the dependence of
'
v
K from radiation and the contact
between vial bottom and tray surface, J s
-1
m
-2
K
-1
C
2
parameter expressing the pressure dependence of
'
v
K , J s
-1
m
-2
K
-1
Pa
-1
C
3
parameter expressing the pressure dependence of
'
v
K , Pa
-1
e
s
emissivity for radiation heat exchange from the shelf to the bottom of the vial
e
v
emissivity for radiation heat exchange from the shelf to the top of the vial
ΔH
s
heat of sublimation, J kg
-1
J
q
heat flux to the product, J s
-1
m
-2
J
w
solvent flux, kg s
-1
m
-2
Heat Transfer in Freeze-Drying Apparatus
111
k
s
heat transfer coefficient between the technical fluid and the shelf, J s
-1
m
-2
K
-1
K
c
heat transfer coefficient due to direct conduction from the shelf to the glass at the
points of contact , J s
-1
m
-2
K
-1
K
g
heat transfer coefficient due to conduction in the gas between the shelf and the vial
bottom , J s
-1
m
-2
K
-1
K
r
heat transfer coefficient between the shelf and the vial due to radiation, J s
-1
m
-2
K
-1
K
v
overall heat transfer coefficient between the heating fluid and the product at the
bottom of the vial, J s
-1
m
-2
K
-1
'
v
K
overall heat transfer coefficient between the heating shelf and the vial bottom (or
between shelf and tray, and tray and vials), J s
-1
m
-2
K
-1
∗
v
K overall heat transfer coefficient between the heating shelf and the product at the
bottom of the vial, J s
-1
m
-2
K
-1
ℓ constant effective distance between the bottom of the vial and the shelf, m
m mass, kg
M
w
molar mass of water, kg kmol
-1
p
w,c
partial pressure of water in the drying chamber, Pa
P
c
chamber pressure, Pa
R ideal gas constant, J kmol
-1
K
-1
s
g
thickness of the glass at the bottom of the vial, m
s
tray
thickness of the tray bottom, m
t time, s
T temperature, K
T
B
temperature of the product at the vial bottom, K
T
c
temperature of the chamber gas, K
T
fluid
temperature of the heating fluid, K
T
shelf
temperature of the heating shelf, K
V
c
volume of the drying chamber, m
3
Greeks
α
parameter used to calculate K
g
κ
Stefan-Boltzman constant, J s
-1
m
-2
K
-4
Λ
0
free molecular heat conductivity at 0°C, J s
-1
m
-1
K
-1
λ
0
heat conductivity of the water vapour at ambient pressure, J s
-1
m
-1
K
-1
λ
g
heat conductivity of the glass, J s
-1
m
-1
K
-1
λ
tray
heat conductivity of the tray, J s
-1
m
-1
K
-1
σ
1
C
standard deviation of the parameter C
1
, J s
-1
m
-2
K
-1
8. References
Brülls, M., & Rasmuson, A. (2002). Heat transfer in vial lyophilization. International Journal of
Pharmaceutics
, Vol. 246, pp. 1-16, ISSN 0378-5173.
Bruttini, R., Rovero, G., & Baldi, G. (1991). Experimentation and modelling of pharmaceutical
lyophilization using a pilot plant.
The Chemical Engineering Journal, Vol. 45, pp. B67-
77, ISSN 1385-8947.
Chen, R., Slater, N. K. H., Gatlin, L. A., Kramer, T., & Shalaev, E. Y. (2008). Comparative
rates of freeze-drying for lactose and sucrose solutions as measured by
Developments in Heat Transfer
112
photographic recording, product temperature and heat flux transducer.
Pharmaceutical Development and Technology, Vol. 13, pp. 367-374, ISSN 1083-7450.
Chouvenc, P., Vessot, S., Andrieu, J., & Vacus P. (2004). Optimization of the freeze-drying
cycle: a new model for pressure rise analysis.
Drying Technology, Vol. 22, pp. 1577-
1601, ISSN 1532-2300.
Corbellini, S., Parvis, M., & Vallan, A (2010). In-process temperature mapping system for
industrial freeze dryers.
IEEE Transactions on Instrumentation and Measurement, Vol.
59, pp. 1134-1140, ISSN 0018-9456.
Dushman, S., & Lafferty, J. M. (1962).
Scientific foundations of vacuum technique, Wiley, ISBN
978-047-1228-03-5, New York, USA.
Fissore, D., Pisano, R., & Barresi, A. A. (2011a). On the methods based on the Pressure Rise
Test for monitoring a freeze-drying process.
Drying Technology, Vol. 29, pp. 73-90,
ISSN 1532-2300.
Fissore, D., Pisano, R., & Barresi, A. A. (2011b). Advanced approach to build the design
space for the primary drying of a pharmaceutical freeze-drying process. Submitted
to
Journal of Pharmaceutical Sciences, ISSN 0022-3549.
Franks, F. (2007).
Freeze-drying of pharmaceuticals and biopharmaceuticals, Royal Society of
Chemistry, ISBN 978-085-4042-68-5, Cambridge, UK.
Gan, K. H., Bruttini, R., Crosser, O. K., & Liapis, A. A. (2005a). Freeze-drying of
pharmaceuticals in vials on trays: effects of drying chamber wall temperature and
tray side on lyophilization performance.
International Journal of Heat and Mass
Transfer
, Vol. 48, pp. 1675-1687, ISSN 0017-9310.
Gan, K. H., Crosser, O. K., Liapis, A. I., & Bruttini, R. (2005b). Lyophilisation in vials on
trays: effects of tray side.
Drying Technology, Vol. 23, pp. 341-363, ISSN 1532-2300.
Gieseler, H., Kessler, W. J., Finson, M., Davis, S. J., Mulhall, P. A., Bons, V., Debo, D. J., &
Pikal, M. J. (2007). Evaluation of Tunable Diode Laser Absorption Spectroscopy for
in-process water vapor mass flux measurement during freeze drying.
Journal of
Pharmaceutical Sciences
, Vol. 96, pp. 1776-1793, ISSN 0022-3549.
Giordano, A., Barresi, A. A., & Fissore, D. (2011). On the use of mathematical models to
build the design space for the primary drying phase of a pharmaceutical
lyophilization process.
Journal of Pharmaceutical Sciences, Vol. 100, pp. 311-324, ISSN
0022-3549.
Hottot, A., Vessot, S., & Andrieu, J. (2005). Determination of mass and heat transfer
parameters during freeze-drying cycles of pharmaceutical products.
PDA Journal of
Pharmaceutical Science and Technology
, Vol. 59, pp. 138-53, ISSN 1079-7440.
Jennings, T. A. (1999)
Lyophilization: introduction and basic principles, CRC Press, ISBN 978-
157-4910-81-0, Boca Raton, USA.
Kessler, W. J., Davis, S. J., Mulhall, P. A., & Finson, M. L. (2006). System for monitoring a
drying process. United States Patent No. 0208191 A1.
Kuu, W. Y., Nail, S. L., & Sacha, G. (2009). Rapid determination of vial heat transfer
parameters using tunable diode laser absorption spectroscopy (TDLAS) in response
to step-changes in pressure set-point during freeze-drying.
Journal of Pharmaceutical
Sciences
, Vol. 98, pp. 1136-1154, ISSN 0022-3549.
Mellor, J. D. (1978).
Fundamentals of freeze-drying, Academic Press, ISBN 978-012-4900-50-9,
London, UK.
Heat Transfer in Freeze-Drying Apparatus
113
Milton, N., Pikal, M. J., Roy, M. L., & Nail, S. L. (1997). Evaluation of manometric
temperature measurement as a method of monitoring product temperature during
lyophilisation.
PDA Journal of Pharmaceutical Science and Technology, Vol. 5, pp. 7-16,
ISSN 1079-7440.
Oetjen, G. W., & Haseley, P. (2004).
Freeze-Drying, Wiely-VHC, ISBN 978-352-7306-20-6,
Weinheim, Germany.
Pikal, M. J. (1985). Use of laboratory data in freeze-drying process design: heat and mass
transfer coefficients and the computer simulation of freeze-drying.
Journal of
Parenteral Science and Technology
, Vol. 39, pp. 115-139, ISSN 0279-7976.
Pikal, M. J. (2000). Heat and mass transfer in low pressure gases: applications to freeze-
drying. In:
Transport processes in pharmaceutical systems, Amidon, G. L., Lee, P. I., &
Topp, E. M., pp. 611-686, Marcel Dekker, ISBN 0-8247-66105, New York, USA.
Pikal, M. J., & Shah, S. (1990). The collapse temperature in freeze drying: dependence on
measurement methodology and rate of water removal from the glassy phase,
International Journal of Pharmaceutics, Vol. 62, pp. 165–186, ISSN 0378-5173.
Pikal, M. J., Roy, M. L., & Shah, S. (1984). Mass and heat transfer in vial freeze-drying of
pharmaceuticals: role of the vial.
Journal of Pharmaceutical Sciences, Vol. 73, pp. 1224-
1237, ISSN 0022-3549.
Pisano, R., Fissore, D., & Barresi, A. A. (2011). Freeze-drying cycle optimization using Model
Predictive Control techniques.
Industrial & Engineering Chemistry Research, Vol. 50,
pp. 7363-7379, ISSN 0888-5885.
Pisano, R., Fissore, D., Velardi, S. A., & Barresi, A. A. (2010). In-line optimization and control
of an industrial freeze-drying process for pharmaceuticals.
Journal of Pharmaceutical
Sciences
, Vol. 99, pp. 4691-4709, ISSN 0022-3549.
Pisano, R., Rasetto, V., Petitti, M., Barresi, A. A., & Vallan, A. (2008). Modelling and
experimental investigation of radiation effects in a freeze-drying process,
Proceedings of EMMC– 5
th
Chemical Engineering Conference for Collaborative Research in
Eastern Mediterranean Countries
, pp. 394-398, Cetraro (CS), Italy, May 24-29, 2008.
Rambhatla, S., Obert, J. P., Luthra, S., Bhugra, C., & Pikal, M. J. (2005). Cake shrinkage
during freeze drying: a combined experimental and theoretical study,
Pharmaceutical Development & Technology, Vol. 1, pp. 33–40, ISSN 0265-2048.
Rambhatla, S., & Pikal, M. J. (2003). Heat and mass transfer scale-up issues during freeze-
drying, I: atypical radiation and edge vial effect.
AAPS PharmSciTech, Vol. 4, Article
No. 14, ISSN: 1530-9932.
Sadikoglu, H., Ozdemir, M., & Seker, M. (2006). Freeze-drying of pharmaceutical products:
research and development needs.
Drying Technology, Vol. 24, pp. 849-861, ISSN
0737-3937.
Schneid, S. & Gieseler, H. (2008). Evaluation of a new wireless temperature remote
interrogation system (TEMPRIS) to measure product temperature during freeze-
drying.
AAPS PharmSciTech, Vol. 9, pp. 729-739, ISSN 1530-9932.
Sheehan, P., & Liapis, A. I. (1998). Modeling of the primary and secondary drying stages of
the freeze-drying of pharmaceutical product in vials: numerical results obtained
from the solution of a dynamic and spatially multi-dimensional lyophilisation
model for different operational policies.
Biotechnology & Bioengineering, Vol. 60, pp.
712-728, ISSN 1097-0290.
Developments in Heat Transfer
114
Tang, X. C., Nail, S. L., & Pikal, M. J. (2006). Evaluation of manometric temperature
measurement (MTM), a process analytical technology tool in freeze-drying, part III:
heat and mass transfer measurement.
AAPS PharmSciTech, Vol. 7, Article No. 97,
ISSN 1530-9932.
Velardi, S. A., & Barresi, A. A. (2008). Development of simplified models for the freeze-
drying process and investigation of the optimal operating conditions.
Chemical
Engineering Research and Design
, Vol. 86, pp. 9-22, ISSN 0263-8762.
Velardi, S. A., Rasetto, V., & Barresi A. A. (2008). Dynamic Parameters Estimation Method:
advanced Manometric Temperature Measurement approach for freeze-drying
monitoring of pharmaceutical solutions.
Industrial Engineering Chemistry Research,
Vol. 47, pp. 8445-8457, ISSN 0888-5885.
Wang, W. (2000). Lyophilization and development of solid protein pharmaceuticals,
International Journal of Pharmaceutics, Vol. 203, pp. 1–60, ISSN 0378-5173.
7
Radiant Floor Heating System
Byung-Cheon Ahn
Department of Building Equipment System Engineering, Kyungwon University
Korea
1. Introduction
The radiant floor heating system controls indoor air temperature by heat transfer from
heated surface to indoor air, after the heat has been applied into a floor structure mass by
using hot water heating coil buried under the floor. In this case, hot water is provided by a
boiler, then, conveyed to indoor floor heating coil through pipe network.
The radiant floor heating system can operate transmitting power quietly and efficiently with
no noise at low costs of the initial investment and with low maintenance. However, since
hot water heating coil is buried under the floor, the system has a defect that it has large
thermal inertia by heavy heat capacitance of the floor structure mass. In addition, response
characteristics with long time delay will be caused due to certain amount of time needed to
heat up the structure mass(Ahn, 2010). Thus, saving energy and maintaining comfortable
indoor thermal environment would be possible only if a proper control method is applied
into the system, considering its thermal inertia.
This chapter introduces system features and mathematical background of radiant floor
heating system. Especially, it covers theoretical background of analysis on heat transfer
characteristics in pipes and indoor heat flow characteristics to help understand dynamic
characteristics of energy in the system. In addition, explanation is given on types and
characteristics of automatic thermostatic valves in the system that supplies hot water with
on-off or proportional control, and more information is demonstrated on heat flow
characteristics and heating performance of the radiant floor heating system in applying
various kinds of control systems to comfort indoor heat and save energy.
2. Heat transfer in pipes
In case of radiant floor heating system, hot water from the boiler will be streamed into
households through pipes, and these pipes can be distinguished into two types; outdoor
exposed pipe covered with heat insulator, and pipe buried under the floor structure mass.
Thus, separate mathematical analyzing method is suggested to explain two types of pipes.
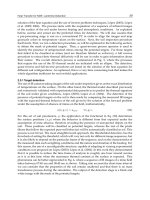
Firstly, fig. 1 depicts pipe covered with heat insulator. In this case, the pipe has exposed
outdoor structure and constant outdoor temperature. Assuming that there is no
superheating or subcooling of the fluid that changes phase, and its pressure does not
change, the LMTD(Log Mean Temperature Difference) applies and in combination with a
heat balance(Stoecker, 1980) gives
(1)
Developments in Heat Transfer
116
where,
q Heat transfer
U Heat transfer coefficient
ρ Water density
C
p
Specific heat
V Flow velocity
T
i
, T
o
Inlet and outlet temperature
T
ao
Ambient temperature
W Flow rate(πR
1
2
V)
A Outside surface area of pipe(2πR
1
L)
Fig. 1. Insulated pipe
Therefore, T
o
, outlet temperature of the pipe, can be indicated from the formula (2)
(2)
T
L
, average temperature of hot water considering the length of pipe, can be found as
(3)
Where E=UA/ρWC
p
, and equivalent heat transfer coefficient, U, between fluid flow and
outdoor is
(4)
Where,
K
st
, Thermal conductivity of pipe
K
in
, Thermal conductivity of insulator
R
1
and R
2
Inside and outside diameter of pipe
R
3
Outside diameter of insulator
The heat transfer coefficient of hot water inside the pipe, (h
i
), is
Radiant Floor Heating System
117
(5)
(6)
Where Re is Reynolds number(VD
i
/υ) and Pr is Prantl number (υ/α).
Also, heat transfer coefficient of exterior of the pipe, (h
o
), is
(7)
Where k
f
is thermal conductivity of air.
Nusselt number (Nu
D
) can be solved differently regarding horizontal pipe and vertical pipe
(Holman, 1981).
In case of horizontal pipe,
(8)
(9)
And in case of vertical pipe,
(10)
(11)
Where Pr
f
is Prantl number for air and Gr
D
is Grashof number.
Considering outdoor temperature (T
ao
), and temperature difference (ΔT) between outdoor
and pipe’s external surface, Grashof number can be expressed as below.
(12)
ΔT value is needed in order to figure out heat transfer coefficient, h
o
, while U value must be
solved to find ΔT. Thus, accurate value, ΔT, can be measured through repeated calculation,
assuming ΔT as a proper number.
Concerning that structure of hot water heating coil pipe is buried under the floor in radiant
floor heating system in general, heat transfer phenomena from hot water pipe to floor and
ceiling surface must be reviewed. Fig. 2 is a diagram of pipe buried under the household
floor. Considering thermal behavior from hot water through pipe gives the following.
Very small volume (A·dx) of the amount of heat in the hot water (Δq) can be formulated:
(13)
where,
ρ Water density
A Cross sectional area of the pipe
C
p
Specific heat of hot water
Developments in Heat Transfer
118
T
x
Temperature of hot water
Hot water in a very small volume has a heat transfer loss after a very short time as follows.
(14)
Fig. 2. Pipe buried in semi-infinite medium having isothermal surface
This value is a sum of the heat amounts emitting to the room floor (dΔq
b) and to the ceiling
surface of the room below (dΔqc).
This occurs because an amount of heat from the heated water is transferred to the floor and
ceiling surface below
.
(15)
Where
where,
U
1
Heat transfer coefficient from pipe surface to the floor surface
U
2
Heat transfer coefficient from pipe surface to the ceiling surface of the bottom layer
h
i
Heat transfer coefficient of pipe inner surface
T
1
Floor surface temperature
T
2
Ceiling surface temperature of the bottom layer
K
p
Thermal conductivity of pipe
K
b
Equivalent thermal conductivity from pipe surface to the floor surface
Radiant Floor Heating System
119
K
b
' Equivalent thermal conductivity from pipe surface to the ceiling surface of the
bottom layer
B Distance from the middle of pipe to the floor surface
B' Distance from the middle of pipe to the ceiling surface of the bottom layer
A
p
Girth of pipe
R
1
Inside radius of pipe
R
2
Outside radius of pipe
After substituting equation (15) for equation (14), categorized according to hot water
temperature, assuming that T
1
and T
2
are steady for a very short time (dt), and integrating
for pipe length, the outlet temperature of hot water for length L can be expressed as the
following equation (16) for hot water inlet temperature
(16)
where,
T
o
Hot water temperature of pipe outlet
T
i
Hot water temperature of pipe inlet
L The length of pipe
v Mean flow velocity(dx/dt)
If we replace T
o
with T
x
and L with x, then integrate this for an entire length, the mean
temperature of hot water could be achieved as in the following equation (17)
(17)
Where
Fig. 3 depicts pipe network buried in a house of apartment building. Hot water is supplied
from supply header through 5 distinguished pipes separately. Average temperature of each
room can be found using formula (17)
3. Indoor heat transfer
Figure 4 shows heat amounts and temperatures of each part of the room; floor, ceiling, wall
and window. There are 3 routes for heat transfer; conduction in the floor, ceiling and wall,
convection with indoor air and radiant heat transfer between the heated floor and ceiling
surface, and a non-heated wall in the house.
The amount of thermal conduction (q1) from the heated water in the pipe to the floor
surface, and the convective amount (q2) from the floor to the indoor air can be shown as
equation (18), (19).
(18)
(19)
Where T
a
is the temperature of indoor air and D
e
is the equivalent diameter of floor slab.
Developments in Heat Transfer
120
Fig. 3. Pipe network buried in a house of apartment building
Fig. 4. Schematic diagram for heat flow for the heat transfer analysis in the room
Radiant Floor Heating System
121
The amount of the thermal convection to wall, window, and door surrounding indoor
air(ASHRAE, 2004)
(20)
Where H is indoor wall height.
The amount of thermal conduction (q11) from hot water pipe buried under the floor of
upper level can be shown as equation (21).
′
′
(21)
In addition, the amount of radiant heat transfer (q
rk
) in each surface is calculated with the
Gebhart’s enclosure analysis method(Segel, 1981)
as in the following equation (22).
(22)
where,
q
rk
Radiant heat transfer for k
th
surface
A
k
k
th
surface area
ε
k
k
th
surface emissivity
σ boltzmann constant
T
k
k
th
surface temperature
ρ
1-n
Reflectivity of surface
F
j-k
Coefficient of form between the inside and outside surface
Fig. 5. Schematic of room for radiation heat transfer analysis
Developments in Heat Transfer
122
Temperatures of indoor air and each part of the room can be determined by an analysis of
these 3 heat transfers: conduction, convection and radiation. In this study, each temperature
is measured using the electrical resistance-capacitance circuit method(Sepsy, 1972) as shown
in Fig. 6. It is based on assumptions that heat capacity for each wall is concentrated to one
point in the wall, and that the temperature from the point to the wall surface is steady.
Equivalent heat resistances of either side from each central node in the wall are the same by
selecting the point. Heat loss to outdoor air is considered by setting the new central
node(Chang, 1996), which is the point at which both equivalent heat resistances of the
existing node and the surface are the same energy equation of each point is as follows
(23)
where,
C
p
Capacitance of each part
T
p
Temperature of each part
q
in
, q
out
Heat transfer by convection or conduction
Fig. 6. An equivalent R-C circuit for unsteady energy analysis
4. Automatic thermostatic valves
In case of radiant floor heating system, automatic temperature control valve is used in order
to consume energy effectively and maintain pleasant indoor temperature. This valve has
similar function as those of gate or glove valve, but it can be separated into electric powered
type and non-electric powered type in terms of the source of power that moves valve disk.
Electric powered type uses external force such as electricity, while non-electric powered
type uses only internal driving element such as shape memory alloy and spring. In general,
electric powered type operates by motors is composed of room temperature controller and
automatic thermostatic valve, and non-electric powered type only consists of automatic
thermostatic valve.
Radiant Floor Heating System
123
Furthermore, Automatic thermostatic valve itself can be differed into on-off type and
proportional control type in terms of control method. Fig. 7 shows control method of
automatic thermostatic valve expressed with flux supply method from temperature change.
Fig. 7. Characteristics of Flow rates vs temperature in control methods of automatic
thermostatic valves
Fig. 8 contains types of heating automatic thermostatic valve, and table 1 is about the
characteristics of each type of valves.
Fig. 8. Various classifications for automatic thermostatic valves
First, in case of electric powered automatic thermostatic valve, control part senses indoor air
temperature of each room and transmits signal to driving part (thermostatic valve) to
control the amount of heating hot water flowing through the pipe. Temperature sensor
called thermister is mostly used to sense temperature from indoor temperature controller,
and it is thermally sensitive semiconductor resistance thermometer. Thermister is widely
Developments in Heat Transfer
124
used as temperature sensor for household electric appliances and industrial machineries,
since its temperature usage range is -50~500, which can be applied to every possible range
that ordinary temperature control is needed, and it is not only cheap and tiny but highly
sensitive. Driving part of electric powered type automatic thermostatic valve can be
separated into 3 different methods using ball valve, cone valve, and solenoid. Solenoid valve
has 2 seconds of on-off response time, while ball valve has 10 seconds and cone valve has
several ten seconds to minutes
Non-electric powered type automatic thermostatic valve using shape memory alloy actively
controls on-off state of valve by sensing shape memory alloy element; closes valve
proportional to temperature due to the increase of returning water temperature, and opens
valve by returning spring due to decrease of returning water temperature.
As a merit, power supply is not necessary and response time is faster than thermal
expansion. Also, structure only consisting of thermal static valve is very simple and
endurance is superior, because Ti-Ni shape alloy spring is used as an operational element.
However, it has a demerit that it has to passively decide flux amount that fits to hot water
temperature amount considering consumer’s thermal surroundings after construction. Also,
it is significant to choose appropriate controlling components for types and characteristics of
installing heating system.
Indirect power type Direct type
Motor control
type
Solenoid
control
type
Thermal
expansional
control type
Shape memory
alloy type
Capillary tube
Type
Control
method
- Temperature
sensing type
- On-off type
- Temperature
sensing type
- On-off type
- Temperature
sensing type
- On-off type
- water
temperature
sensing type
- Proportional
control type
- Water
temperature
sensing type
- Proportional
control type
Operating
source
Electric motor Electromagnet Liquid thermal
expansion
Shape memory
alloy spring
Liquid thermal
expansion
bellows
Response
time
Within several
ten seconds
Within several
seconds
Within several
minutes
Within several
seconds
Within several
ten minutes
Merit
- Fast response
- Easy
installation
- Fastest
response
- Simple
Structure
- Low cost
- Electric power
isnecessary
- Good endurance
- Proportional
type
- Electric power
is unnecessary
- Proportional
Type
Demerit
-Electric power
is necessary
- High cost
- High
pressure loss
Relatively slow
response
Manual valve
Setting
-Liquid quality
variation
-Difficult
installation
Table 1. Characteristics of classified automatic thermostatic valves
5. Heating control system performance analysis
If indoor temperature were controlled by applying automatic thermostatic valve for radiant
floor heating system, response characteristics of long time delay on control response would
Radiant Floor Heating System
125
occur due to large heat capacitance of floor structure mass. In order to examine response
characteristics of radiant floor heating system, simulation was performed and was
compared and verified with experiment results by using mathematical analysis model of a
radiant floor heating system explained in previous 2
nd
, 3
rd
paragraphs.
Fig. 9 shows the results of the experiment and simulation (Ahn, 2010).
We measured temperature changes for 5 hours natural cooling after supplying hot-water for
3 hours. For the floor temperature, two temperatures (one at the nearest part to the pipe and
the other between the pipes), were measured and compared with temperatures from the
simulation data. The chiller to maintain temperature of artificial chamber in the test house
was set up to maintain an outdoor air temperature of 8°C. The reason for cooling is to secure
the constant temperature around the room for the indoor heating test.
Data obtained from the entering supply and outdoor temperatures into the simulation for
operation, were contrasted to the experimental data.
Time (Hour)
012345678
Temperature (
o
C)
0
10
20
30
40
50
60
70
Supply water(experiment)
Return water(experiment)
Return water(simulation)
Floor surface1(experiment)
Floor surface(simulation)
Floor surface2(experiment)
Indoor air(experiment)
Indoor air(simulation)
Inner wall surface(experiment)
Inner wall surface(simulation)
Outdoor air(experiment)
Supply water
Return water
Outdoor air
Indoor air
Floor surface
Inner wall surface
Fig. 9. Comparison of the simulation and experimental data (supply water temperature:
50°C, flow rate: 0.05L/s, outdoor temperature: 8°C)
Results showed that the simulation data agreed well with experimental data. Response
characteristics will be examined through using simulation model of radiant floor heating
system and applying various kinds of automatic thermostatic valves.
First of all, In terms of proportional control and On-Off control, which are types of
automatic thermostatic valves, each is classified according to sensing methods; water
Developments in Heat Transfer
126
temperature sensing and air temperature sensing. They are performed by testing simulation
and defining their features.
Each control of each flow rate and temperature has its own peculiarities as outdoor air
changes from the daily lowest temperature -5°C to the highest temperature 5°C over
24hours. Table 2 summarizes control characteristics for each of the four studied cases. For
the 4 controls: Case 1 does not adjust the flow rate, Case 2 controls the flow rate in
proportion to the difference between room temperature and setting point. Case 3 adjusts the
flow rate in proportion to the difference between returned-water temperature and setting
point, and Case 4 controls the On-off for the supply water by the differential gap according
to the difference between the room temperature and setting point.
Classification Description
Case1 No control method
Case2 Proportional valve control with air temperature feedback
Case3 Proportional valve control with water temperature feedback
Case4 On-off valve control with air temperature feedback
Table 2. Classification of control methods
Fig. 10 summarizes the results of changes in temperatures of return water, the floor and
indoor air over 24hours. The outdoor air is vibratory from -5°C to 5°C, the return water
increases to 43.3°C from the set point, and the floor and the indoor air rapidly increases to
20°C for 3hours, and then steadily to 32°C and then decreases to 27.5°C. At this time, the
mean temperatures of return water and indoor air are 42.3°C and 24.9°C, respectively.
Fig. 11 shows the temperature responses and a flow rate for 24hours as a result of the
proportional control for the indoor air temperature (Case 2) designated from 22.3°C to
23.3°C to maintain 22.8°C, the mean indoor temperature. The maximum flow rate helps
adjust flow and maintain an indoor air temperature of 23°C before reaching the lower limit
of 22.3°C. Controlling flow can offset the change of outdoor air temperature so that indoor
air temperature can be maintained.
With the exception of the first stage, the temperature of the return water shows a gentle
slope, increasing, and that of floor surface is 27.9°C continuously. In this case, each mean
temperature of return water and indoor air is 31.8°C, and 22.8°C. This air-temperature
proportional control maintains indoor temperature through light control regardless of
changes in outdoor air temperature.
Fig. 12 shows temperature responses and a flow rate for 24hours as a result of the
proportional control for return water temperature (Case 3) designated from 30.5°C to 34.5°C
to maintain 22.8°C, the mean indoor temperature. The indoor air maintains a temperature of
33.1°C after initially increasing to 24.1°C. The flow rate steadily decreases but its drop
dwindles except for the first stage. In this case, the mean temperatures of return water and
indoor air are 33°C, and 22.8°C, respectively.
Water proportional control does not cope with changes in indoor air temperature, but
maintains return water temperature, and if the indoor air temperature were at the best
condition, it would be difficult to find an upper and lower limit that can maintain it.
Radiant Floor Heating System
127
Time (Hour)
0 3 6 9 12 15 18 21 24
Temperature (
o
C)
-10
0
10
20
30
40
50
60
70
Flowrate(L/s)
0.00
0.01
0.02
0.03
0.04
0.05
0.06
Flowrate
Supply water
Return water
Floor surface
Indoor air
Outdoor air
Fig. 10. Various temperature responses for outdoor temperature change with no control
(Case 1)
Time (Hour)
0 3 6 9 12 15 18 21 24
Temperature (
o
C)
-10
0
10
20
30
40
50
60
70
Flowrate(L/s)
0.00
0.01
0.02
0.03
0.04
0.05
0.06
Flowrate
Supply water
Return water
Floor surface
Indoor air
Outdoor air
Fig. 11. Various temperature responses with proportional valve control with air temperature
feedback (Case 2)
Developments in Heat Transfer
128
Time (Hour)
0 3 6 9 12 15 18 21 24
Temperature (
o
C)
-10
0
10
20
30
40
50
60
70
Flowrate(L/s)
0.00
0.01
0.02
0.03
0.04
0.05
0.06
Flowrate
Supply water
Return water
Floor surface
Indoor air
Outdoor air
Fig. 12. Various temperature responses with proportional valve control with return water
temperature feedback (Case 3)
Time (Hour)
0 3 6 9 1215182124
Temperature (
o
C)
-10
0
10
20
30
40
50
60
70
Flowrate(L/s)
0.00
0.01
0.02
0.03
0.04
0.05
0.06
Flowrate
Supply water
Return water
Floor surface
Indoor air
Outdoor air
Fig. 13. Various temperature responses with on-off valve control with air temperature
feedback (Case 4)
Radiant Floor Heating System
129
Fig. 13 shows changes to temperature and flow rate for 24hours in flow-rate supply on–off
at a range of indoor air temperatures (Case 4), 22.3°C to 23.5°C.
The operation time is long due to the set point of indoor temperature of 20°C, and then
shortens due to intervals of 1°C of On-Off. The process is more time consuming when the
outdoor temperature is lower and the relatively non-operational time shortens. The indoor
air temperature vibrates from 22.5°C to 23.5°C according to the control, and the return water
temperature almost reduces to the floor temperature when the flow supply is stopped. At
this time, the mean temperatures of return water and indoor air are 34.4°C and 22.8°C,
respectively.
For the On-Off control, time differences are created between the hot water supply and non-
supply as the outdoor air temperature changes, and the indoor air temperature affects the
control. But the control does not maintain the indoor air and creates a fluctuation in
temperature. It is therefore important to set the proper point and use a differential gap.
Fig. 14 shows the mean temperature of the room air and total amount of heat supply
according to controls. No-Control (Case 1) is 2°C and 14,000Kcal higher than other controls
(Case 2~4). All controls, Cases 2~4, have a similar mean temperature but the water
temperature-sensing control (Case 3) uses about 8% more heat than the air temperature
sensing control (Case 2, Case 4).
Fig. 14. Mean temperature of indoor air and total energy consumptions with different
control methods (supply water temperature of 50°C)
Control variables of radiant floor heating system can usually be considered as supply hot
water temperature and set value of indoor temperature. These control variables must be set
to a proper value to improve indoor thermal environment and save energy, and variable
values reflecting amount of outdoor temperature can be considered.
15
20
25
30
35
Case 1 Case 2 Case 3 Case 4
Temperature(℃)
0.0E+00
1.0E+04
2.0E+04
3.0E+04
4.0E+04
5.0E+04
6.0E+04
Energy consumption(Kcal/Day)
The mean temperature of room air Total Energy Consumption
Developments in Heat Transfer
130
Fig. 15. Indoor air temperature responses for various supply water temperatures
Fig. 16. Indoor air temperature responses for various supply water and outdoor air
temperatures
Time (Hour)
03691215182124
Temperature (
o
C)
19
20
21
22
23
24
Outdoor air temp. = -10
o
C / Supply water temp. = 45
o
C
Outdoor air temp. = -10
o
C / Supply water temp. = 52.5
o
C
Outdoor air temp. = -10
o
C / Supply water temp. = 60
o
C
Time (Hour)
03691215182124
Temperature (
o
C)
19
20
21
22
23
24
Outdoor air temp. = 10
o
C / Supply water temp. = 45
o
C
Outdoor air temp. = 0
o
C / Supply water temp. = 52.5
o
C
Outdoor air temp. = -10
o
C / Supply water temp. = 60
o
C
Radiant Floor Heating System
131
First of all, Fig. 15 shows characteristics of indoor air temperature alternation when supply
hot water temperature is 45, 52.5, 60 in case of setting outdoor temperature condition
as -10. The control method here is the result of applying on-off control method (the on-off
for the supply water by the differential gap according to the difference between the room
temperature and setting point), using indoor air temperature sensor.
The diagram indicates that the time to reach the setting point 22 is radically increasing
when using relatively low temperature supply water in case of decreasing outdoor
temperature. Analyzing from the data that more than 6 hours is needed for supply hot
water temperature at 45 to reach 22, considerable amount of time is consumed in order
to improve indoor thermal environment to a comfortable range in case when outdoor
temperature is low and low temperature supply water is provided. Thus, relatively warmer
hot water than cooler hot water is appropriate for heating in case of low outdoor
temperature (Ahn, 2005).
Fig. 16 shows dynamic characteristics of indoor air temperature change when supply water
temperature is 60, 52.5, and 45 at outdoor temperature condition of -10, 0, and
10. Overshoot of each 3 separate cases depicted similar amount on indoor air temperature
change, and the rise times to reach the set indoor air temperature 22 were close to 3 hours
without difference. By correctly determining supply hot water temperature in regard to
amount of outdoor temperature, transient response characteristics for indoor environment
can be improved.
Fig. 17 depicts characteristics of energy consumption and indoor air temperature average
considering temperature alternation of outdoor and supply hot water.
Energy consumption and indoor air temperature average entirely rises as temperature of
supply hot water or outdoor increases on the graph. The energy consumption gap was
moderate in terms of supply hot water temperature change, while it was relatively large
for outdoor temperature change. Therefore, changing supply hot water temperature in
terms of outdoor temperature variation will minimize overheating and benefit energy
savings.
Furthermore, if high temperature hot water were provided to make indoor air temperature
reach its set temperature, supplying time of hot water would be lessened due to rapid
increase of indoor air temperature despite of large consumption of heat amount depending
on temperature difference. On the other hand, when low temperature hot water is provided,
heat amount consumption will decrease, but supplying time will be delayed due to slow
increase rate of indoor air temperature so that amount difference of energy consumption
will be small.
Fig. 18 depicts result measured from the experiment about flow rate change characteristics
and temperature change of radiant floor heating system. This is to demonstrate general
thermal change features of radiant floor heating system from each boiler-installed house-
hold that is run by individual heating method.
Fig. 18 indicates temperatures of supply water, returning water, floor surface, indoor air,
outdoor air, and flow rate. Temperature of supply water from supply header was at
maximum 50 due to heat loss from pipe, while it is being operated as on-off type control
by boiler system.
Therefore, heat loss must be considered when determining set value of the supply water
temperature. In addition, while indoor air temperature is being controlled up to 23±0.5 by
Developments in Heat Transfer
132
Supply water temperature()
Fig. 17. Energy consumption and mean indoor air temperature responses for various supply
water and outdoor air temperatures
Fig. 18. Experimental results for the response characteristics of temperature and flow rate
45 55 65
Energy consumption(kcal)
0
2000
4000
6000
8000
10000
Temperature(
o
C)
21.5
22.0
22.5
23.0
23.5
Energy consumption for outdoor air temp. (-5
o
C)
Energy consumption for outdoor air temp. (0
o
C)
Energy consumption for outdoor air temp. (5
o
C)
Mean indoor temperature for outdoor air temp. (-5
o
C)
Mean indoor temperature for outdoor air temp. (0
o
C)
Mean indoor temperature for outdoor air temp. (5
o
C)
Time (Hour)
0 3 6 9 12 15 18 21 24
Temperature (
o
C)
-10
0
10
20
30
40
50
Flowrate(LPM)
0
4
8
12
Flowrate
Supply water
Return water
Floor surface
Indoor air
Outdoor air
Radiant Floor Heating System
133
on-off type, initial operation time period to reach set indoor temperature is relatively slower
than that of after second period, and temperature alternation of indoor air and floor surface
seems severely slow even after hot water is being supplied. Thus, thermal environment
would be improved if indoor air temperature increasing period were reduced by initially
supplying comparably hotter water temperature, and cooling it down afterwards.
6. Conclusions
Radiant floor heating system is mainly applied to residential buildings. Recent trend shows
increasing rate of countries applying the system to their residential buildings after
considering various profits of the system.
However, the radiant floor heating system may contain long time delay as inappropriate
response characteristics on indoor temperature control due to significant influence of
thermal inertia when performing indoor air temperature control.
In order to improve thermal environment and save energy by effectively controlling the
indoor air temperature, temperature value of supply hot water from boiler and indoor air
set temperature can be altered by forecasting the value of outdoor temperature and
characteristics variation.
Therefore, application of more effective system design and advanced control technique for
radiant floor heating system like HVAC system(Ahn, 2001) is required through consistent
technology research and development.
7. References
Ahn, B.C. and Mitchell, J.W. (2001). Optimal Control Development for Chilled Water Plants
using a Quadratic Representation, Energy and Buildings 33, pp.371-378, Elsevier,
ISSN 0378-7788
Ahn. B.C. and Lee, T.W. (2005). Strategy of Energy Saving and Thermal Environmental
Improvement for Intermittent Heating System in Apartment Buildings, Journal of
the SAREK, Vol.17, pp.88-93, ISSN 1229-6422
Ahn, B.C. and Song, J.Y. (2010). Control Characteristics and Heating Performance Analysis
of Automatic Thermostatic Valves for Radiant Slab Heating System in Residential
Apartment, Energy 35, pp.1615-1624, Elsevier, ISSN 0360-5442
ASHRAE Handbook, HVAC Systems and Equipment. (2004). Panael Heating and Cooling,
Chapter 6, 6.1-6.22. ISBN 1-931862-48-6, Atlanta, USA
Chang, H.W. and Ahn, B.C. (1996). The Energy Analysis and Control Characteristics of a Ho
Water Heating System for Apartment Houses, Journal of the SAREK, Vol.8, pp.76-87,
ISSN 1229-6422
Holman, H.J. (1981). Heat Transfer, 5
th
Ed., McGraw-Hill. , ISBN 0-07-029618-9, MI, USA
Segel Robert and Howell, J.R. (1981). Thermal Radiation Heat Transfer, McGraw-Hill. , ISBN
0-07-057316-6, New York, USA
Sepsy, C.F. (1972). A Thermal Analysis of the Building and the Heating and Cooling
Systems Selected for the Field Validation Test, ASHRAE Sym. Bulletine No. 72, pp.5-
9.