Environmental Monitoring Part 1 pptx
Bạn đang xem bản rút gọn của tài liệu. Xem và tải ngay bản đầy đủ của tài liệu tại đây (1.44 MB, 35 trang )
ENVIRONMENTAL
MONITORING
Edited by Ema O. Ekundayo
Environmental Monitoring
Edited by Ema O. Ekundayo
Published by InTech
Janeza Trdine 9, 51000 Rijeka, Croatia
Copyright © 2011 InTech
All chapters are Open Access distributed under the Creative Commons Attribution 3.0
license, which permits to copy, distribute, transmit, and adapt the work in any medium,
so long as the original work is properly cited. After this work has been published by
InTech, authors have the right to republish it, in whole or part, in any publication of
which they are the author, and to make other personal use of the work. Any republication,
referencing or personal use of the work must explicitly identify the original source.
As for readers, this license allows users to download, copy and build upon published
chapters even for commercial purposes, as long as the author and publisher are properly
credited, which ensures maximum dissemination and a wider impact of our publications.
Notice
Statements and opinions expressed in the chapters are these of the individual contributors
and not necessarily those of the editors or publisher. No responsibility is accepted for the
accuracy of information contained in the published chapters. The publisher assumes no
responsibility for any damage or injury to persons or property arising out of the use of any
materials, instructions, methods or ideas contained in the book.
Publishing Process Manager Ivana Zec
Technical Editor Teodora Smiljanic
Cover Designer Jan Hyrat
Image Copyright jaimaa, 2011. Used under license from Shutterstock.com
First published October, 2011
Printed in Croatia
A free online edition of this book is available at www.intechopen.com
Additional hard copies can be obtained from
Environmental Monitoring, Edited by Ema O. Ekundayo
p. cm.
ISBN 978-953-307-724-6
free online editions of InTech
Books and Journals can be found at
www.intechopen.com
Contents
Preface IX
Part 1 Biological Monitoring/Ecotoxicology 1
Chapter 1 Analysis of Environmental
Samples with Yeast-Based Bioluminescent Bioreporters 3
Melanie Eldridge, John Sanseverino,
Gisela de Arãgao Umbuzeiro and Gary S. Sayler
Chapter 2 Physical Mechanisms of
“Poisoning” the Living Organism by Heavy Metals 23
G.P. Petrova
Chapter 3 Histological Biomarker as
Diagnostic Tool for Evaluating the
Environmental Quality of Guajará Bay – PA - Brazil 35
Caroline da Silva Montes,
José Souto Rosa Filho and Rossineide Martins Rocha
Part 2 Advances in Environmental
Monitoring Research and Technologies 49
Chapter 4 Air Pollution Analysis with
a Possibilistic and Fuzzy Clustering Algorithm
Applied in a Real Database of Salamanca (México) 51
B. Ojeda-Magaña, R. Ruelas,
L. Gómez-Barba, M. A. Corona-Nakamura,
J. M. Barrón-Adame, M. G. Cortina-Januchs,
J. Quintanilla-Domínguez and A. Vega-Corona
Chapter 5 Real-Time In Situ Measurements of Industrial
Hazardous Gas Concentrations and Their Emission Gross 65
F.Z. Dong, W.Q. Liu, Y.N. Chu, J.Q. Li, Z.R. Zhang,
Y. Wang, T. Pang, B. Wu, G.J. Tu, H. Xia, Y. Yang,
C.Y. Shen, Y.J. Wang, Z.B. Ni and J.G. Liu
Chapter 6 Geochemical Application for Environmental
Monitoring and Metal Mining Management 91
Chakkaphan Sutthirat
VI Contents
Chapter 7 Determination of Fluoride and Chloride
Contents in Drinking Water by Ion Selective Electrode 109
Amra Bratovcic and Amra Odobasic
Chapter 8 Environmental Background Radiation
Monitoring Utilizing Passive Solid Sate Dosimeters 121
Hidehito Nanto, Yoshinori Takei and Yuka Miyamoto
Chapter 9 PILS: Low-Cost Water-Level Monitoring 137
Samuel Russ, Bret Webb, Jon Holifield and Justin Walker
Chapter 10 An Innovative Approach to
Biological Monitoring Using Wildlife 157
Mariko Mochizuki, Chihiro Kaitsuka,
Makoto Mori, Ryo Hondo and Fukiko Ueda
Chapter 11 Public Involvement as an Element in
Designing Environmental Monitoring Programs 169
William T. Hartwell and David S. Shafer
Chapter 12 Monitoring Lake
Ecosystems Using Integrated Remote
Sensing / Gis Techniques: An Assessment
in the Region of West Macedonia, Greece 185
Stefouli Marianthi, Charou Eleni and Katsimpra Eleni
Chapter 13 Landscape Environmental
Monitoring: Sample Based Versus Complete
Mapping Approaches in Aerial Photographs 205
Habib Ramezani, Johan Svensson and Per-Anders Esseen
Chapter 14 Real-Time Monitoring of Volatile
Organic Compounds in Hazardous Sites 219
Gianfranco Manes, Giovanni Collodi, Rosanna Fusco,
Leonardo Gelpi, Antonio Manes and Davide Di Palma
Chapter 15 Land Degradation of the Mau
Forest Complex in Eastern Africa:
A Review for Management and Restoration Planning 245
Luke Omondi Olang and Peter Musula Kundu
Chapter 16 Concepts for Environmental
Radioactive Air Sampling and Monitoring 263
J. Matthew Barnett
Chapter 17 Multisyringe Flow
Injection Analysis for Environmental
Monitoring: Applications and Recent Trends 283
Marcela A. Segundo, M. Inês G. S. Almeida and Hugo M. Oliveira
Contents VII
Chapter 18 Photopolymerizable Materials in Biosensorics 299
Nickolaj Starodub
Chapter 19 Visual Detection of Change
Points and Trends Using Animated Bubble Charts 327
Sackmone Sirisack and Anders Grimvall
Chapter 20 Environmental Monitoring of
Opportunistic Protozoa in Rivers and Lakes:
Relevance to Public Health in the Neotropics 341
Sônia de Fátima Oliveira Santos, Hugo Delleon da Silva,
Carlos Eduardo Anunciação and Marco Tulio Antonio García-Zapata
Part 3 Environmental Monitoring with
Wireless Sensor Network Technology 359
Chapter 21 Biosensor Arrays for Environmental Monitoring 361
Wei Song, Si Wei, Hong-Xia Yu, Maika Vuki and Danke Xu
Chapter 22 Environmental Monitoring Supported
by the Regional Network Infrastructures 389
Elisa Benetti, Chiara Taddia and Gianluca Mazzini
Chapter 23 ICT for Water Efficiency 411
Philippe Gourbesville
Chapter 24 Monitoring Information Systems to
Support Adaptive Water Management 427
Raffaele Giordano, Giuseppe Passarella and Emanuele Barca
Chapter 25 Autonomous Decentralized Control Scheme
for Long-Term Operation of Large Scale and
Dense Wireless Sensor Networks with Multiple Sinks 445
Akihide Utani
Chapter 26 Collaborative Environmental
Monitoring with Hierarchical Wireless Sensor Networks 461
Qing Ling, GangWu and Zhi Tian
Chapter 27 Environmental Monitoring WSN 477
Ittipong Khemapech
Chapter 28 Standardised Geo-Sensor Webs for
Integrated Urban Air Quality Monitoring 513
Bernd Resch, Rex Britter, Christine Outram,
Xiaoji Chen and Carlo Ratti
Preface
Environmental Monitoring is a book designed by InTech - Open Access Publisher in
collaboration with scientists and researchers all over the world with a proven record of
scientific accomplishment and knowledge in the field of environmental monitoring in
particular, and environmental sciences in general. The book is designed to present
recent research developments and advances in environmental monitoring to a global
audience of scientists, researchers, environmental educators, administrators,
technicians, managers, students and the general public.
A series of chapters addressing varied topics like the monitoring of heavy metal
contaminants in atmospheric, terrestrial and aquatic environments; biological
monitoring using wildlife/ecotoxicological monitoring; and the use of wireless sensor
networks in environmental monitoring are included in this book. The book's concepts,
ideas, sampling/analytical techniques described, results and research findings reflect
what leading environmental scientistes and researchers around the world have done,
and are currently doing in the field of environmental monitoring.
Special words of appreciation are due to Ms Ivana Zec, the Publishing Process
Manager who oversaw and coordinated the publishing of all materials and assisted me
and the authors in completing our work easily and in a timely manner. My profound
thanks also to the technical editor who prepared these manuscripts for publication in
InTech - Open Access Publisher.
Dr. E.O. Ekundayo
Alberta Institute of Agrologists,
Canada
Part 1
Biological Monitoring/Ecotoxicology
1
Analysis of Environmental Samples with
Yeast-Based Bioluminescent Bioreporters
Melanie Eldridge
1
, John Sanseverino
1
,
Gisela de Arãgao Umbuzeiro
2
and Gary S. Sayler
1
1
University of Tennessee
2
University of Campinas
1
United States of America
2
Brazil
1. Introduction
Extensive research over the past decade has found the widespread presence of organic
wastewater contaminants (OWC) in surface waters around the globe including the United
States, (Alvarez et al., 2009; Focazio et al., 2008; Kolpin et al., 2002; Owens et al., 2007; Zheng
et al., 2008), Asia (Ma et al., 2007), Europe (Cargouet et al., 2007; Cespedes et al., 2005; Gros
et al., 2009; Reemtsma et al., 2006) and South America (Bergamasco et al., submitted; Jardim
et al., 2011; Kuster et al., 2009). These OWC include pesticides, plasticizers, pharmaceuticals,
and natural and synthetic hormones as well as pollutants from chemical spills into the
environment. These compounds may be introduced into surface waters by runoff from land
application of biosolids, through leaking sewer lines and septic systems, or by incomplete
removal from wastewater treatment systems. Further, a wide variety of these chemicals
have been implicated in endocrine disruption in invertebrates and vertebrates (Cooper &
Kavlock, 1997; Fang et al., 2000; Folmar et al., 2002; Fossi & Marsili, 2003; Guillette et al.,
1999; Hayes et al. 2010; Kavlock et al., 1996; Kidd et al. 2007; Ropstad et al., 2006; Sonne et
al., 2006; Tyler et al., 1998).
An endocrine disruptor is an exogenous substance that causes adverse health effects in an
organism or its offspring by way of alteration in the function of the endocrine system. As
such endocrine disruption is a mechanism leading to a variety of adverse health effects,
most of which are considered as reproductive or developmental toxicities (OECD, 2002). The
complex nature of reproductive and developmental effects suggests that in vivo tests are
necessary to detect endocrine disruption. Several in vivo mammalian assays (e.g. O'Connor
et al., 2002) and in vitro assays (e.g. Fang et al., 2000; Zacharewski, 1997) exist for measuring
estrogenic effects in various biological systems. However, these are not suitable for rapid,
high-throughput screening of chemicals or necessarily screening of environmental samples.
Yeast-based in vitro estrogen and androgen screens have been firmly established as a means
for rapidly identifying chemicals with potential endocrine disrupting activity. This chapter
will review the development and use of yeast-based bacterial bioluminescent bioreporters
for the detection of endocrine disruption compounds.
Environmental Monitoring
4
1.1 Bioreporters
Reporter gene fusions have been widely used for the detection and quantification of
chemical, biological, and physical agents (Daunert et al., 2000). The principle is to fuse a
specific genetic promoter or response element with a reporter gene. Induction by a specific
target chemical initiates transcription/translation of the bioreporter molecule, which
generates a measurable signal. There are three widely-used classes of bioreporters:
colorimetric (e.g. lacZ, cat), fluorescent (e.g. gfp), and bioluminescent (e.g. luc, lux). One
example of a colorimetric-based bioreporter is the lacZ gene which encodes the β-
galactosidase enzyme. β-Galactosidase mediates the breakdown of lactose to glucose +
galactose. As a bioreporter, β-galactosidase is widely used in molecular biology in the blue-
white screening assay. The chromophore X-gal (bromo-chloro-indolyl-galactopyranoside) is
cleaved into galactose and an indole moiety that turns the medium blue. For chemical
detection, lacZ is fused to a chemical-responsive promoter and when the cells are exposed to
chromophores, such as chlorophenol red-β-D-galactopyranoside (CPRG), the assay medium
changes from yellow to red. This type of colorimetric bioreporter is inexpensive and can be
used in a qualitative or quantitative type of assay. Color density can be measured on a
standard spectrophotometer.
Fluorescent assays take advantage of the green fluorescent protein (GFP). GFP was
originally isolated from the jellyfish Aequorea victoria (Johnson et al., 1962; Shimomura et al.,
1962). GFP is widely used as a bioreporter in eukaryotic systems for its simplicity to clone
and no requirement for an organic substrate other than excitation with either UV or blue
light. Quantification of the signal is by a fluorescent spectrophotometer or plate reader.
There are different versions of gfp including blue-, red-, and yellow-shifted variants each
requiring different excitation wavelengths and each of which fluoresce at different
wavelengths (Hein & Tsien, 1996; Kendall & Badminton, 1998). In some cases this may be
advantageous, especially when multiple bioreporters will be used simultaneously. These
genes have been used extensively since they were first employed as gene expression
biomarkers (Chalfie et al., 1994).
Firefly luciferase is another well-used bioreporter in eukaryotic systems. The luciferase,
encoded by the luc gene (lucFF), was originally isolated from Photinus pyralis (firefly) and
generates luciferase by a two-step conversion of D-luciferin to oxyluciferin (de Wet et al.,
1985). This reaction generates light at 560 nm. However, the gene does not encode for the D-
luciferin substrate and therefore substrate addition in any assay is required, which adds
processing time and expense to the assay. Luc-based assays may also be constrained by the
requirement for a cell lysis step followed by addition of the D-luciferin, adding both time
and expense to the assay.
Bacterial bioluminescence has been widely used as a bioreporter in prokaryotic systems. The
lux operon (luxCDABE) was originally isolated from Vibrio fischeri (Engebrecht et al., 1983),
Vibrio harveyi (Cohn et al., 1983), and Photorhabdus luminescens (Szittner & Meighen, 1990).
The lux operon encodes for the luciferase enzyme (luxAB) and the long-chain aldehyde
substrate (
luxCDE) for that reaction. An assay employing bacterial bioluminescence does not
require an external organic substrate; the only requirement is for oxygen (O
2
). A long chain
aldehyde and a reduced flavin mononucleotide (FMNH
2
) are converted by luciferase
(LuxAB) to a long chain carboxylic acid and FMN, producing light at 490 nm wavelength
(Meighen & Dunlap, 1993). The luxAB (without luxCDE) can also be used as a bioreporter
and while these strains also produce light at 490 nm, they are less suited for high
Analysis of Environmental Samples with Yeast-Based Bioluminescent Bioreporters
5
throughput analysis due to additional handling steps (costly substrate addition) and
additional cost.
The luc genes have been reported to be more sensitive than lux-based systems, however in a
recent comparison of luc- and lux-based hormone-sensing bioreporters, Svobodova and
Cajthaml (2010) determined that some lux-based bioreporters (BLYES/BLYAS bioassays,
discussed below) are of comparable sensitivity and in some cases much more sensitive than
luc-based bioreporters.
Several reviews are available on the properties and use of luc, luxAB, luxCDABE, gfp, and
gfp-derived reporter genes in environmental systems (Hakkila et al., 2002; Keane et al.,
2002; Ripp et al., 2010). Each of these reporter technologies has advantages and
disadvantages depending on the application. For high throughput analysis of samples,
bioreporters with the luxCDABE genes expressed are particularly well-suited for
screening large numbers of samples. For both luxAB- and lucFF-based bioreporters, costly
substrates must be continually added to the cells for visualization of the reaction. This
increases not only handling difficulty but also costs to perform the assay. For GFP-based
bioreporters, no exogenous substrates are necessary but fluorescent molecules must be
excited by a light source to fluoresce. Each of these types of bioreporters produces signals
for different lengths of time and has different light emission maxima and optimum
temperatures. For example, while the Photorhabdus luminescens luciferase (Lux) is stable up
to 42
o
C, firefly luciferase (Luc) has a temperature optimum at 25
o
C and is thermally
inactivated above 30
o
C (Keane et al., 2002). Bioreporter fusions incorporating the full lux
cassette are advantageous in that they do not require exogenous substrates, cell lysis is
not required, the signal is quantitative and reproducible (King et al., 1990). Further,
continuous on-line monitoring is possible (e.g. DiGrazia et al., 1991; Heitzer et al., 1994;
Heitzer et al., 1992; King et al., 1990).
1.2 Bacterial lux expression in Saccharomyces cerevisiae
Prior to 2003, the lux genetic system was previously limited only to expression in
prokaryotic systems. However, Gupta et al. (2003) were successful in expressing the P.
luminescens lux cassette in the yeast S. cerevisiae. Specifically, the luxA, -B, -C, -D, and -E
genes from P. luminescens and the frp gene from Vibrio harveyi were re-engineered for
expression in Saccharomyces cerevisiae. The lux operon was engineered using two pBEVY
yeast expression vectors (Miller et al., 1998), which allowed bidirectional, constitutive
expression of the individual luxA, -B, -C, -D, and -E genes. The luxA and luxB genes were
independently expressed from divergent yeast constitutive promoters GPD and ADH1 on
pBEVY-U (Figure 1). The luxCD and luxE-frp genes were independently expressed from a
second plasmid (pBEVY-L), also using the GPD and ADH1 promoters. An internal ribosome
entry site (IRES) was inserted between the luxC and luxD genes and the luxE and frp genes.
The IRES allows translation of multiple genes from a single promoter in eukaryotes (Hellen
& Sarnow, 2001).
Constitutive expression of the luxCDABEfrp genes in S. cerevisiae W303a generated
approximately 9,000,000 photons per second per unit optical density (Gupta et al., 2003).
This is comparable to similar expression in prokaryotic systems. This was a significant
milestone in expression of bacterial operons in lower eukaryotic systems and created
possibilities for screening organic wastewater contaminants with mammalian health
significance.
Environmental Monitoring
6
Fig. 1. Schematic representation of S. cerevisiae BLYEV (currently known as BLYR). This
strain produces light continuously by constitutive expression of the luxCDABE genes from
Photorhabdus luminescens and the frp gene from Vibrio harveyi.
2. Chemical detection using S. cerevisiae-based bioluminescent bioreporters
Yeast-based bioassays containing human receptors for estrogens and androgens fall into the
recombinant receptor/reporter gene assay category. Estrogen or androgen response elements
linked to a bioreporter molecule offer a low-cost method for screening samples rapidly for
determining the presence of possible endocrine disruptors. Two widely used
receptor/reporter assays for detecting estrogenic and androgenic compounds are the Yeast
Estrogen Screen (YES) (Routledge & Sumpter, 1996) and the Yeast Androgen Screen (YAS)
(Purvis et al., 1991). The S. cerevisiae YES and YAS bioreporters are colorimetric lacZ-based
estrogen and androgen-sensing strains, respectively. The S. cerevisiae host strain for YES and
YAS, contains the human estrogen receptor (hER-α) and human androgen receptor,
respectively (Purvis et al., 1991; Routledge & Sumpter, 1996). Further, each host strain contains
a series of either human estrogen response elements (EREs) or human androgen response
elements (AREs) fused to the lacZ gene. The lacZ gene product, β-galactosidase, transforms the
chromogenic substrate CPRG to a red product, measured by absorbance at 540 nm. These were
the first widely used assays for yeast-based detection of estrogenic compounds.
The YES and YAS assays have been used extensively to measure endocrine responses to
specific chemicals including polychlorinated biphenyls (PCBs) and hydroxylated derivatives
(Layton et al., 2000; Schultz, 2002; Schultz et al., 1998), polynuclear aromatic hydrocarbons
(PAH) (Schultz & Sinks, 2002), pesticides (Sohoni et al., 2001) and other compounds (Schultz
et al., 2002). These assays have been adapted to environmental matrices including
environmental waterways (Thomas et al., 2002), aquifers (Conroy et al., 2005), wastewater
treatment systems (Layton et al., 2000) and dairy manure (Raman et al., 2004). Additional
yeast-based bioreporters have been developed using either a colorimetric detection (Bovee
et al., 2004; Gaido et al., 1997; Le Guevel & Pakdel, 2001; Rehmann et al., 1999), green
Analysis of Environmental Samples with Yeast-Based Bioluminescent Bioreporters
7
fluorescent protein (Bovee et al., 2007; Bovee et al., 2004) or the firefly luciferase bioreporter
(Bovee et al., 2004; Leskinen et al., 2005; Michelini et al., 2005).
While the YES and YAS assays were highly specific for their target compounds, the
colorimetric assays have disadvantages including addition of the chromophore for color
development and a 3-5 day reaction time. This latter requirement hindered their ability for
high-throughput analysis. Further, after 3 -5 days of incubation, it was unknown if any
oxidation reactions were occurring that may activate the target compound. Some newer
colorimetric assays have dramatically shortened the time required for color development (4-
6 h) through the use of alternative substrates but have the disadvantage of requiring cell
lysis steps (Jaio et al., 2008).
To overcome these limitations, bioluminescent version of the YES and YAS reporters were
developed by modifying the plasmid constructs of Gupta et al. (2003). Triple repeats of the
human ERE were inserted in between the GPD and ADH1 constitutive promoters regulating
the luxA and luxB genes, respectively (Figure 2) generating strain BLYES (Sanseverino et al.,
2005). A similar strategy was used for strain BLYAS (Eldridge et al., 2007), which functions
in the same way except that it contains the human androgen receptor gene on its genome
and luxAB are under control of four androgen response elements (AREs), while the
constitutive strain (BLYR) has both the luxAB and luxCDEfrp genes constitutively produced
therefore it makes light constantly. The BLYR strain is used to determine whether samples
or chemicals are toxic to the yeast, preventing false negatives. If a chemical is highly toxic,
killing or inhibiting the cells, no light will be produced and it would be easy to mistake
toxicity for no estrogenic response. However, if bioluminescence of the BLYR strain is
reduced, since it produces light constitutively, it is obvious that toxicity exists in the sample.
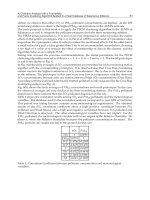
Fig. 2. Schematic representation of S. cerevisiae BLYES. Estrogenic compounds cross the cell
membrane and bind to the human estrogen receptor (hER). This complex interacts with
estrogen response elements (RE) initiating transcription of luxA and luxB. S. cerevisiae BLYES
contains the human estrogen receptor in its genome, while S. cerevisiae BLYAS has the
human androgen receptor in the genome.
Environmental Monitoring
8
Comparison of the BLYES and BLYAS strains to their colorimetric counterparts and proof-
of-concept as to their utility has been established (Eldridge et al., 2007; Sanseverino et al.,
2005). The BLYES and BLYAS assays are consistent with previously published yeast-based
reporter assays (Sanseverino et al., 2009). The 40 - 50% variability of the EC
50
values shown
in Figure 3 reaffirms the suggestion that no single assay should be used to determine an
absolute EC
50
value but rather as a first step in estimating the hormonal activity of a
chemical (Beresford et al., 2000).
Assay Chemical Standard
EC
50
(M)
Upper Limit of
Detection
(M)
Lower Limit of
Detection
(M)
BLYES 17β-Estradiol 6.3 ± 2.4 x 10
-10
5.0 x 10
-9
2.5 x 10
-11
BLYAS 5α-Dihydrotestosterone 1.1 ± 4.6 x 10
-8
5.0 x 10
-8
1.0 x 10
-10
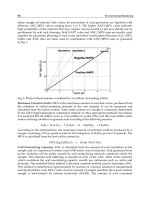
Fig. 3. A. S. cerevisiae BLYES standard curve (n = 13) using 17β-estradiol. B. S. cerevisiae
BLYAS standard curve (n = 13) using dihydrotestosterone as a standard. Open circle:
calculated EC
50
values with error bars. A 50% effective concentration (EC
50
) value was
determined from the midpoint of the linear portion of the sigmoidal dose response curve.
The mean and standard deviation values were calculated from replicate EC
50
values for each
standard to determine the variability between assays. C. Summary of EC
50
values for BLYES
and BLYAS strain with upper and lower limits of detection.
S. cerevisiae BLYES, S. cerevisiae BLYAS, S. cerevisiae BLYR, were used to assess their
reproducibility and utility in screening 69, 68, and 71 chemicals for estrogenic, androgenic,
and toxic effects, respectively (Sanseverino et al., 2009). This screening was part of an
assessment of the United States Environmental Protection Agency’s Tiered screening of
chemicals for endocrine-disrupting ability. The 3-tier system includes (i) priority setting, (ii)
Tier 1 screening, and (iii) Tier 2 screening. Priority setting focuses on identifying chemicals
that require further testing; i.e., excluding chemicals with little or no known hormonal
activity and that are generally regarded as safe. The intent of Tier I screening is to rapidly
identify chemicals that interact with the estrogen, androgen, and thyroid systems while Tier
2 screenings provide a more in-depth study of how each chemical interacts with each
endocrine system. In this study, EC
50
values were 6.3 ± 2.4 x 10
-10
M (n = 18) and 1.1 ± 0.5 x
10
-8
M (n = 13) for BLYES and BLYAS, using 17β-estradiol and 5α-dihydrotestosterone
A
B
C
Analysis of Environmental Samples with Yeast-Based Bioluminescent Bioreporters
9
(DHT) over concentration ranges of 2.5 x 10
-12
thru 1.0 x 10
-6
M, respectively. Based on
analysis of replicate standard curves, comparison to background controls, and screening a
variety of chemicals, a set of quantitative rules was formulated to interpret data and
determine if a chemical is potentially hormonally active, toxic, both, or neither (Sanseverino
et al., 2009). The results demonstrated that these assays were applicable for Tier I chemical
screening in EPA’s Endocrine Disruptor Screening and Testing Program as well as for
monitoring endocrine disrupting activity of unknown chemicals in water.
Additional S. cerevisiae bioluminescent bioreporters for estrogens and androgens have been
developed using the firefly luciferase as the reporter molecule. The bioreporters of Leskinen
et al., (2005) each contain the firefly luciferase gene (lucFF) under control of hormone-
responsive promoters. The four strains, designated BMAEREluc/ERα, BMAEREluc/ERβ,
BMAEREluc/AR, and BMA64/luc were used to detect estrogens (two versions), androgens,
and toxicity, respectively. This bioassay is unique in that it uses two estrogen-sensing
bioreporters; one contains the alpha form of the estrogen receptor and one contains the beta
form (ERα, ERβ). These bioreporters were used by Svobodova et al. (2009) to test
commercially available PCB mixtures and triclosan for estrogenic and androgenic activity
but did not detect any activity with these samples (estrogenic or androgenic). This lack of
estrogenic response in the bioluminescent assays may be due to the different mode of action
of chemicals like triclosan (Stoker et al., 2010). In a study that examined the effects of
triclosan exposure on female Wistar rats, triclosan advanced the onset of puberty symptoms.
Also, a combination of ethinyl estradiol (EE2) and triclosan increased uterine weight
significantly more than EE2 alone while triclosan alone had no effect. Therefore the mode of
action of triclosan appears to have a synergistic effect on EE2 activity in Wistar rats. This
effect appears to be independent of estrogen receptor binding given that bioluminescent
yeast bioassays (Svobodova et al. 2009, Eldridge et al. unpublished data), which measure
binding to the hER and then EREs, did not respond to triclosan.
In addition to hormone-mimicking chemicals, several other types of contaminants are also
detectable with S. cerevisiae-based bioluminescent bioreporters. For example, the aryl
hydrocarbon-sensing strain of Leskinen et al. (2008) contains genomically integrated human
aryl hydrocarbon receptor and human aryl hydrocarbon nuclear translocator genes. In
addition, it carries a plasmid-encoded copy of the firefly luciferase gene (lucFF) that is
regulated by a series of aryl hydrocarbon receptor complex (AHRC) response elements (also
called dioxin response elements or xenobiotic response elements, AhREs/DREs/XREs). Aryl
hydrocarbon receptor proteins interact with both their AH ligand and the nuclear
translocator protein then bind to the AhRE region of the luc-containing plasmid, activating
transcription of luciferase, similarly to the receptor-response element system present in the
BLYES bioassay. Since this bioassay is luc-based, D-luciferin must be added.
Another S. cerevisiae-based bioreporter has been created to measure arsenate and also UV
damage (Bakhrat et al., 2011). This strain is based on the BLYES strain of Sanseverino et al.
(2005), containing a constitutive luxCDEfrp plasmid and a
luxAB plasmid that has been re-
engineered to be under control of the UFO1 promoter, which specifically responds to DNA
damage by UV light and also arsenate. The strain is able to detect very low concentrations of
arsenate (1x10
-12
to 1x10
-6
M), which makes them useful for environmental monitoring. It
was also used to evaluate the level of UV protection in commercial sunscreens. When films
of Saran wrap were placed between the cells with SPF100 or SPF15 sunscreen on them, the
sunscreen provided 100% and 90% protection, respectively, in comparison to a control in
Environmental Monitoring
10
which samples were shielded with only Saran wrap. Studies of this type demonstrate this
bioassay’s usefulness on complex samples.
3. Analysis of aqueous environmental samples
For use on environmental samples, the BLYES/BLYAS/BLYR bioreporter suite is particularly
well-suited. They require no substrate addition or illumination source, are inexpensive to use,
and are optimized for 96-well plate formats. For water samples where OWC are typically
found in the ppb range, a concentration step is necessary. Figure 4 outlines the procedures for
analysis of aqueous samples. For wastewater effluents and source drinking water samples,
solid phase extraction is performed to isolate and concentrate any chemical contaminants.
Fig. 4. Schematic of sample preparation and analysis. Typically, 1 L samples are collected
aseptically and passed through a solid phase extraction unit. After elution by an appropriate
solvent, concentrating the sample 1,000-fold, the sample is analyzed by the bioassays and/or
with chemical analysis such as GC/MS or LC/MS. Typically, eight samples are analyzed on
a 96-well plate, including standards and control wells (both solvent control and no
treatment controls). By combining multiple plates in one assay run, numerous samples are
processed at one time. Bioluminescence is monitored and recorded over time using a
photon-counting system.
Analysis of Environmental Samples with Yeast-Based Bioluminescent Bioreporters
11
Numerous methods for solid phase extraction exist but commonly a modification of United
States EPA 1694 (2007) is used. Briefly, Oasis filters (Waters, Inc.) or cartridges are conditioned
with methanol and water, then the sample (typically ~1 L) is passed though the membrane
slowly under a small amount of pressure. Chemicals are eluted in a solvent, either singly or in
combinations, such as methanol or a methanol:acetone mixture. The solvents are evaporated to
dryness and may be used immediately or stored at -20
o
C for future use. For the
BLYES/BLYAS/BLYR assays, samples are resuspended in methanol (or DMSO) such that
they are 1000x concentrated compared to the original sample, e.g. 1 L of sample is
concentrated, dried, and resuspended in 1 mL of solvent, yielding an effective concentration
factor of 1000x. This may then be split for chemical analysis and bioassays.
In the bioassays, samples are serially diluted in methanol to achieve a range of
concentrations (1000x-2.5x). In addition, standard chemicals (17β-estradiol (E2) for
BLYES/BLYR and 5α-dihydrotestosterone (DHT) for BLYAS) are suspended in methanol at
0.01 M and then serially diluted 18 times to generate a concentration range of 4x10
-7
M to
1x10
-12
M for E2 and 4x10
-6
M to 1x10
-11
M for DHT. Samples and standards (50 µL) are then
spotted into the wells of 96-well plates (Figure 4). Triplicate plates are made (one for each of
three strains) and then methanol is evaporated at room temperature.
For preparation of the bioassay, each yeast strain is grown overnight at 28
o
C with shaking
(150 rpm) in Yeast Minimal Media (YMM) without leucine or uracil (Routledge & Sumpter,
1996) to an OD
600
of 1.0. Yeast strains (200 µL) are spotted into the wells of 96-well plates
containing dry samples and standards, beginning the exposure. This generates a
concentration range of 250x-0.625x for environmental samples, 1x10
-7
M to 2.5x10
-13
M for
E2, and 1x10
-6
M to 2.5x10
-12
M for DHT. Negative controls included wells with (i) medium +
cells and (ii) medium + cells + evaporated methanol, to monitor whether estrogenic or
androgenic substances are present in the solvent. Plates are then placed into a plate reader
(such as Perkin-Elmer Victor2 Multilabel Counter) with an integration time of 1 s/well.
Bioluminescence is measured every 30-60 min for four hours. Relative light unit data (as
counts per second) is plotted versus the log of concentration in SigmaPlot (or similar
statistical software) (Figure 5).
For each chemical, the log of bioluminescence (counts per second) versus the log of chemical
concentration (M) is plotted, generating a sigmoidal curve for hormonally active
compounds. A 50% effective concentration (EC
50
) value is determined from the midpoint of
the linear portion of the sigmoidal curve. The mean and standard deviation values are
calculated from replicate EC
50
values for standards to determine the variability between
assays. Detection limits are determined by calculating the concentration of chemical at
background bioluminescence plus three standards deviations. Toxicity is calculated as the
concentration of sample that reduces the signal from the constitutively bioluminescent strain
(BLYR) by 20% (IC
20
). For environmental samples, the concentration factor that yields 50%
maximal response is considered the EC
50
and when this value is divided by the EC
50
for that
assay’s standard, estrogenic or androgenic equivalents are calculated (in terms of E2 or
DHT, respectively); this determines the amount of potentially estrogenic substances that are
present in a sample relative to the standard.
For samples in which DMSO is the preferred solvent, a 4% solution of DMSO is used for the
serial dilutions of environmental samples and standards (by incubating the sample in a
small volume of 100% DMSO for 15 minutes then adding ultra-pure water to achieve a final
DMSO concentration of 4%). Next, 100 µL of sample or standard are spotted into 96-well
plates along with 100 µL of yeast cells (without drying the samples/standards), yielding a
Environmental Monitoring
12
final DMSO concentration of 2% in all wells. Negative controls should consist of wells with
(i) medium + cells and (ii) medium + cells + DMSO to monitor whether DMSO is toxic to
yeast cells and whether the solvent contains potentially estrogenic substances.
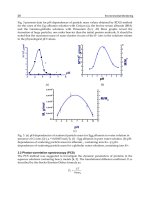
Fig. 5. Yeast assay data using environmental samples. The graphs show the responses of the
yeast strains S. cerevisiae BLYR and BLYES in response to the 17β-estradiol standard and
serial dilutions of a solid phase extracted sample. The sample consisted of surface water
from the Cotia River in Brazil, which has a high concentration of estrogenic substances
present (1.2 ng E2 equivalents/L) and exhibits marked toxicity. Analysis of surface and
groundwater are of particular interest to regulatory agencies (and the public) because they
are source waters for drinking water treatment plants.
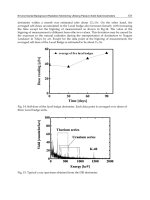
Using this bioassay, surface water samples were surveyed from the U.S. and Brazil
(Eldridge-Umbuzeiro, unpublished data, Figures 5 and 6), with both studies determining
that the estrogen-sensing strain detects more estrogen-like activity than predicted through
chemical analysis alone. This is expected however, given that chemical analysis targets
certain contaminants and cannot be expected to screen samples for all known estrogens. In
addition, it is relatively unknown if/how chemicals act synergistically to promote estrogen-
or androgen-like activity. The assay can provide a clear evaluation on the levels of potential
estrogenicity in monitoring studies of surface water samples as can be seen from Figure 6
(unpublished data). The levels varied from 0.01 to 19.3 ng/L of E2 equivalents per liter of
water. In this particular case, the river water that was monitored was from Brazil, with the
highest levels of pollution expected to occur in the dry season (corresponding to June-
October).
In Jardim et al. (2011), surface water samples from Brazil were also examined. The samples
were collected from sites classified by the São Paulo State Environmental Agency (CETESB)
as excellent, good, medium, fair, and poor. Both bioassays and chemical analysis were
performed on samples following solid phase extraction. The authors targeted estrone (E1),
17β-estradiol (E2), ethinyl estradiol (EE2), estriol (E3), bisphenol A (BPA), 4-n-octophenol
(OP), and 4-n-nonylphenol (NP) in their chemical analysis and used the estrogen-sensing
BLYES as the bioassay. From this data, the authors determined that the bioassay data is not
fully explained by the amount and strength of the detected estrogens. For example, the
highest estrogenic response determined by the yeast bioassay (BLYES) was also determined
to have the highest concentrations of estrogen by chemical analysis. Also, in drinking water
Analysis of Environmental Samples with Yeast-Based Bioluminescent Bioreporters
13
samples in which targeted estrogens were not detected by chemical analysis, the yeast
bioassay also did not detect any estrogenic activity. However, in some samples from
different surface water intake points, often yeast bioassays detected estrogenic activity at
levels that chemical analysis data did not predict. For example, BPA detected at 3.53 ng/L
(according to chemical analysis) is not a sufficient concentration to elicit an estrogenic
response. However, the same sample elicited a response equivalent to 0.7 ng/L of E2
equivalents (according to the yeast bioassay). This suggests that S. cerevisiae BLYES was
responding to a) something that was not recognized by chemical analysis, b) by-products of
the targeted chemicals, or c) that a mixture effect is causing a synergistic estrogen response.
The reader is cautioned that these assays should be a first determination of estrogenic
activity. S. cerevisiae does not have an endocrine system and cannot explicitly identify
endocrine disruptors. Advanced testing with alternate assays (i.e. mammalian-based assays)
should be used for confirmation of endocrine-disrupting activity.
Fig. 6. Surface water samples from Brazil assessed with the BLYES bioassay. Surface water
samples were solid phase extracted and then processed with the S. cerevisiae BLYR and
BLYES.
Alvarez et al. (2009) used BLYES for the analysis of Potomac River water samples in a study
on the reproductive health of bass. The authors criticized the collection of single grab
samples, in favor of using passive samplers to concentrate contaminants. They examined
extracts from passive samplers that had been deployed for 31 days in the Potomac River and
its tributaries, which receive significant amounts of flow from WWTP effluents. Samples
Environmental Monitoring
14
were collected once yearly, for two years (2005-2006), both upstream and downstream of
known WWTP discharge sites. They also performed both chemical analysis (targeting E1,
E2, EE2, and E3) and bioassays (using BLYES and BLYR). They were able to detect
potentially estrogenic compounds at levels statistically different than the field blanks. Levels
of E2 equivalents were detected in the nanomolar range. The authors were able to measure
estrogenic responses with BLYES but they were not able to detect a seasonal difference in
estrogenicity (some chemicals were detected seasonally via chemical analysis but others
were not) though it is unclear whether there was no seasonal effect or whether the estrogens
were detected at such a low concentration that a conclusion cannot be drawn.
In both studies (Alvarez et al., 2009; Jardim et al., 2011), the expected response with
bioassays was lower than the actual response determined with the bioassay. Expected
responses are calculated by multiplying a chemical’s concentration (determined through
chemical analysis) by its potency relative to a reference estrogen, such as E2. It is expected
that if all contaminating estrogenic molecules are detected by chemical analysis then the
expected responses should match actual bioassay responses. However, it is difficult to
anticipate (and therefore target) all possible endocrine-active contaminants that are present
in environmental samples. In addition, prediction of the effects of mixtures of chemicals,
especially at low concentrations, has proven to be problematic. Moreover, bioassays are
likely to detect metabolites of estrogenic chemicals, as long these molecules continue to
interact with the human hormone receptor/response element-sensing systems. Given these
reasons, it is natural to expect that chemical analysis is unlikely to ever fully predict actual
bioassay responses.
The androgen-sensing strain of Leskinen et al. (2005) has been used to monitor wastewater
before and after treatment in wastewater treatment plants in several cities in Italy (Michelini
et al. 2005). It was determined that both samples (pre- and post-treatment) contained
chemicals with androgenic activity, however treatment decreased this activity. They
determined that approximately 30% of androgenic activity was typically removed but
occasionally activity was reduced by 90%. They attributed the decreased activity to the
presence of carbon-based filters, which should bind chemicals, thereby removing them from
wastewater. This study illustrates the effectiveness of yeast-based bioreporters for the rapid
analysis of samples before and after water treatment. It also demonstrates that wastewater
treatment does not necessarily remove chemicals associated with potential endocrine
disrupting activity.
In addition, the strains of Leskinen et al. (2005) (BMAEREluc/ERα, BMAEREluc/ERβ,
BMAEREluc/AR, and BMA64/luc) were used to test several lotion samples, as a simulation
of using the strains on complex sample matrices. Five of the seven lotion samples
demonstrated estrogenic activity, even at dilutions as low as 1:175. The authors attributed
this activity to parabens present in the lotions, given that samples with no parabens were
not estrogenic but samples with mixtures of parabens were. The authors state that parabens
are present in many cosmetic products and are generally considered safe (Soni et al., 2002),
despite having been demonstrated to produce an estrogenic response (Routledge et al., 1998)
and being present in breast cancer tumors (Darbre et al., 2004). No androgenic activity was
found for any of the samples.
More recently, Svobodova et al. (2009) examined the endocrine disrupting potential of a
commercial PCB mixture (Delor 103) and a series of potential PCB degradation metabolites
(chlorobenzoic acids and cholorophenols). The authors did not detect any estrogenic activity
with any of the chemicals or mixtures tested using bioluminescent yeast, except that 5 mg/L
Analysis of Environmental Samples with Yeast-Based Bioluminescent Bioreporters
15
chlorophenol caused a response. This is in contrast to the results obtained with the Yeast
Estrogen Screen (YES) colorimetric bioreporter, which detected estrogenic activity with all
the tested chemicals except chlorophenols. One reason for this difference may be the
different length of exposure time between the two bioassays. The YES was incubated with
chemicals for three days whereas the Leskinen strains were only incubated with the
chemicals for 2.5 h prior to sample processing. It is possible that over three days’ time, the
PCBs may have oxidized (yeast are incubated in aerobic conditions) to forms that are more
likely estrogenic. Indeed, hydroxylated PCBs have been demonstrated to harbor estrogenic
activity (Korach et al., 1988; Schultz, 2002; Schultz et al., 1998). Interestingly, using the
bioluminescent androgen-sensing bioreporter (BMAEREluc/AR), androgenic activity was
detected with the commercial PCB mixture, but not with chlorobenzoic acids,
chlorophenols, or triclosan. Triclosan has been demonstrated to have no activity with the
BLYES and BLYAS bioassays as well (data not shown).
4. Future applications
Saccharomyces cerevisiae-based bioluminescent bioreporters offer excellent opportunities
beyond bacterial bioreporters for rapid analysis of chemicals with human and
environmental significance. Expression of the bacterial lux cassette in a lower eukaryote
offers many opportunities not only for high-throughput screening systems but also
bioprocess monitoring, diagnostic applications, fungal gene expression analysis, and in vivo
sensing of fungal infections (Gupta et al., 2003). Expression in S. cerevisiae has led to
advances in transferring this system to mammalian cell lines (Close et al., 2010; Patterson et
al., 2005).
The advantages for detection of endocrine-disrupting chemicals in water by S. cerevisiae lux-
based bioreporters are numerous including accuracy, ease of use, not expensive, and
amenable to automation in performing and collection of data. In addition to screening
aqueous samples, BLYES, BLYAS, and BLYR, and other variants described in the literature
are useful for Tier I screening as proposed by the EPA, analysis of wastewater influent and
effluent, chemical leaching from manufactured products, for example. In fact, the State
Environmental Agency of São Paulo (CETESB) in Brazil is considering using the S. cerevisiae
BLYES bioassay for routine monitoring of surface and ground water samples for the
presence of potentially estrogenic substances. Two of the authors (M.E. and G.S.) have
begun routine monitoring of wastewater treatment plant effluents from a treatment facility
in TN as well as screening 250 water samples across the state of Tennessee in a broad
survey.
Ideally, detection of potential endocrine disruptors (or any other chemical of interest) by
bioluminescent bioreporter strains would be coupled to remote detection systems for
continuous real-time monitoring. Bioluminescent bioreporter integrated circuits fuse
reporter cells to an integrated circuit containing a photodetector (e.g. Sayler et al., 2001;
Nivens et al., 2004; Sayler et al., 2004). These devices could be distributed in networks and
coupled with wireless communications would send signals indicating the presence/absence
of chemical contaminants. Roda et al. (2011) have developed a device that couples estrogen-
or androgen-sensing S. cerevisiae expressing firefly bioluminescence to fiber optics with
detection by a CCD sensor, yielding a fully functional biosensor. While this device resulted
in strains whose detection limit was approximately 10-fold higher than bioassays performed
in the lab and was larger than previously reported remote detection systems, it does