Environmental Monitoring Part 4 docx
Bạn đang xem bản rút gọn của tài liệu. Xem và tải ngay bản đầy đủ của tài liệu tại đây (1.76 MB, 35 trang )
Environmental Monitoring
96
safety margin of material. Safe values for prevention of acid generation are reported with
different ANC/MPA values ranging from 1 to 3. The higher ANC/MPA value indicates
high probability of the material that may remain circum-neutral in pH and should not be
problematic by acid rock drainage. Both NAPP value and ANC/MPA ratio are usually used
together for placement planning of rock waste and other overburdens (Skousen et al., 1987).
Sulfur and ANC data are often used in combination with ANC/MPA ratio as presented
in Fig. 3.
Fig. 3. Plots of all parameters considered in Acid-Base Accounting (ABA)
Maximum Potential Acidic: MPA is the maximum amount of acid that can be produced from
the oxidation of sulfur-containing minerals in the rock material. It can be measured and
calculated from the sulfur content. Total sulfur content of a sample is commonly determined
by the LECO high temperature combustion method or other appropriate methods. For instant,
it is assumed that all sulfurs occur as iron-sulfide (or pyrite; FeS
2
) and this iron-sulfide reacts
under oxidizing condition to generate acid according to the following reaction:
FeS
2
+ 15/4 O
2
+ 7/2 H
2
O Fe(OH)
3
+ 2 H
2
SO
4
According to the stoichiometry, the maximum amount of acid that could be produced by a
sample containing 1%S as pyrite would be 30.6 kilograms of H
2
SO
4
per ton of material. The
MPA is calculated from the total sulfur content as:
MPA (kg H
2
SO
4
/t) = (Total %S) X 30.6
Acid Neutralizing Capacity: ANC is calculated from the amount of acid neutralizer in the
sample and it is expressed in metric tons/1000 metric tons of material. Acid generated from
pyrite oxidation will be partly reacted by acid neutralizing minerals contained within the
sample. This inherent acid buffering is resulted in term of the ANC. Most of the minerals
which contribute the acid neutralizing capacity usually are carbonates such as calcite and
dolomite. The modified Sobek method is the most common method used to determine ANC.
This method is determined experimentally by reaction of a known amount of standardized
acid (hydrochloric acid, HCL) with a known amount of sample and then the mixed solution
sample is back-titrated by sodium hydroxide (NaOH). The amount of acid consumed
Geochemical Application for Environmental Monitoring and Metal Mining Management
97
represents the inherent acid neutralizing capacity of the sample. Calculation will be carried
out and expressed in terms of kg H
2
SO
4
/t.
3.2 Net acid generation
Net Acid Generation (NAG) test was developed as an assessment tool for acid producing
potential of sample for longer than 20 years ago. The NAG test is usually used in association
with NAPP. It is direct method to measure ability of sample to produce acid via sulfide
oxidation. Hydrogen peroxide (H
2
O
2
) is used to activate and complete oxidation process of
the sulfide minerals contained in the sample. H
2
O
2
added during the NAG test leads to
simultaneous reactions of acid generation and acid neutralization. Then pH measurement of
solution has to be carried out after the completion of reaction. The acidity of solution under
the NAG is a direct measurement of net acid generation of sample. Shu et al. (2001) studied
the effect of lead/zinc mine acidity on heavy metal mobility using both NAG test and ABA
method. They concluded, based on their results that NAG test, direct measurements of ANC
from acid produced from oxidized sulfide, yields more accurate than that of ABA method.
This is because prediction of acid forming potential from the total pyritic sulfur content as
done for ABA method may overestimate amount of acid generation due to uncompleted
acidification of pyritic sulfur.
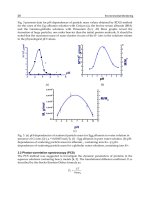
However, classifications of waste rock have generally used NAPP estimation based on ABA
method in combination of NAG pH testing. Schematic classification is present in Fig. 4.
Three types of west rocks from mining activity can be grouped as No Net Acid Forming
(NAF), Potentially Net Acid Forming (PAF), and Uncertainly Net Acid Forming (UC).
Definitions of these groups are given below.
Fig. 4. NAG pH plot against NAPP for classification potential of net acid formation of waste
rock
No Net Acid Forming (NAF): either there is minimal or no sulfides present or the
neutralization potential exceeds the acid potential. This type of waste rock gives a negative
NAPP and NAG pH greater than or equal to 4.5.
Environmental Monitoring
98
Potentially Net Acid Forming (PAF): the acid potential exceeds the neutralization potential.
These rocks are described as potentially acid forming. They may generate AMD if they are
exposed to sufficient oxygen to allow sulfide oxidations. Geochemical tests usually yield
positive NAPP and NAG pH below 4.5.
Uuncertain Net Acid Forming (UC): uncertain classification is obtained when there is an
apparent conflict between the NAPP result and NAG pH; for example, NAPP is negative
but NAG pH lower than 4.5 or NAPP is positive but NAG pH higher than 4.5. However,
further testing work would be performed for such rock types to determine proportion
between NAF and PAF if they occur.
Recently, this classification has been using widely for geochemical study of waste rock and
assessment of acid forming potential. Tran et al. (2003), for an example, also used NAG
together with NAPP tests to figure out key criteria for construction design of waste rock
dumps to avoid AMD. They collected samples from 2 sites in which have different
temperatures. NAG and NAPP tests were applied to classify PAF, NAF and UC materials
prior to placement control of waste rocks within the dumps. They succeeded to have
reduced AMD load that may be generated from both dumps.
4. Heavy metals
As mentioned earlier, heavy metals contained in mine wastes, particularly rocks and
tailings, may in turn become contamination to water systems around the dumping site.
Analyses of these solid wastes must be very crucially considered for environmental
protection plan during the mining operation. In fact, these heavy metals usually have
different forms appeared in these rocks and tailings. Some forms are quite stable and
durable to natural reactions such as weathering and erosion; however, some forms may be
leached and available to contamination. Moreover, their stable chemical bonds may have
been destroyed during the mining process, mineral dressing and metal extraction.
Therefore, placement and dumping of these solid wastes should concern about these
geochemical characteristics. Several standard procedures have been proposed for analyses
of heavy metals contained in geological materials such as soils, stream sediments and rocks.
These methods were initially engaged for geochemical exploration searching for potential
area of mineral deposits. Although, they can also be applied for environmental purpose,
some assumption must be taken into consideration as well as limitation of selected method
must be understood clearly before interpretation will be carried out. Some methods are
designed for total concentrations of element contained in the samples; on the other hand,
some of them are planned for partial portions of these elements reliable for specific concern.
However, some methods have been developed for environmental impact assessment. In this
section, some selective standard procedures are described for suitable application of mining
waste and related fields.
4.1 Total digestion
Whole-Rock Geochemical Analyses: this method is designed for analysis of total chemical
concentrations contained in the rock materials. This method may not be suitable to the
environmental concern because major and minor compositions of these rocks are usually
non toxic and they are quite stable. However, their trace compositions may have partly
impact after accumulation and transportation have taken place for some periods of time,
particularly due to AMD. Moreover, these whole-rock analyses are very useful for
Geochemical Application for Environmental Monitoring and Metal Mining Management
99
geological classification as well as mining operation. Placement and disposal may be
designed based on this classification in cooperation with other testing methods. Rock
powdering using appropriate crusher and miller must be done prior to further analyses.
Subsequently, the powdered rock samples may be fused to glass beads or pressed as pellet
for X-ray Fluorescence (XRF) analyses of 9 major oxides (i.e., SiO
2
, TiO
2
, FeO
t
, MnO, MgO,
CaO, Na
2
O, K
2
O and P
2
O
5
) and perhaps some trace elements (e.g., Ba, Zn, Sr, Rb, Zr, Co, Cr,
Ni, Y and V). Rock standards should be used for calibration at the same analytical condition.
Moreover, loss on ignition (LOI) should also be measured by weighting rock powders
before and after ignition at 900º C for 3 hrs in an electric furnace. Trace and rare earth
elements may be additionally analyzed using advanced instruments such as Inductively
Coupled Plasma (ICP) Spectrometer, Atomic Absorption Spectrometer (AAS) and other
spectrometric techniques. Rock samples have to be digested totally without remaining of
rock powders. About 0.1000 g (±0.0001 g) of powdered samples are weighted and then
dissolved in a concentrate HF-HNO
3
-HClO
4
acid mixture in sealed Teflon beakers. The
digested samples were diluted immediately and added mixed standard solution to all
samples. Proportion of these concentrate acids is usually adapted in laboratory as well as
time of digestion. Hotplate has been engaged traditionally but it may take long time.
Alternatively, microwave has been applied to shorten the digestion time. This method is
total digestion which most elements including toxic elements and non toxic ones are
dissolved for analyses. However, these contents do not clearly reflect environmental impact.
Microwave-assisted acid solubilization has been proved to be the most suitable method for
the digestion of complex matrices such as sediments and soil. This method shortens the
digestion time, reduces the risk of external contamination and uses smaller quantities of acid
(Wang et al., 2004). However, there are different procedures required for appropriate
sample types. Some standard digestion techniques are usually used for soil, sediment and
sludge; for example, EPA 3052, EPA 3050B and EPA 3051 are described below.
EPA 3052: This method is an acid digestion of siliceous matrices, and organic matrices and
other complex matrices (e.g., ashes, biological tissues, oils, oil contaminated soils, sediments,
sludges and soils) which they may be totally decomposed for analysis. Powdered sample of
up to 0.5 g is added into 9 ml of concentrated nitric acid and usually 3 ml hydrofluoric acid
for 15 minutes using microwave. Several additional alternative acids and reagents have been
applied for the digestion. These reagents include hydrochloric acid and hydrogen peroxide.
A maximum sample of 1.0 g can be prepared by this method. Mixed acids and sample are
placed in an inert polymeric microwave vessel then sealed prior to heating in the microwave
system. Temperature may be set for specific reactions and incorporates reaching 180 ± 5 ºC
in approximately shorter than 5.5 minutes and remaining at 180 ± 5 ºC for 9.5 minutes to
complete specific reactions. Solution may be filtered before appropriate volume is made by
dilution. Finally, the solution is now ready for analyses (e.g., AAS or ICP). More details
should be obtained from EPA (1996).
EPA 3050: Two separate procedures have been proposed for digestion of sediment, sludge
and soil etc. The first procedure is preparation for analysis of Flame Atomic Absorption
Spectrometry (FLAA) or Inductively Coupled Plasma-Atomic Emission Spectrometry
(ICP-AES) whereas the other is for Graphite Furnace AA (GFAA) or Inductively Coupled
Plasma Mass Spectrometry (ICP-MS). Appropriate elements and their detection limits
must be concerned and designed for selection of both methods (EPA, 2009). Alternative
determination techniques may also be modified as far as scientific validity is proven. This
method can also be applied to other elements and matrices but performance need to be
Environmental Monitoring
100
tested. It should be notified that this method is not a total digestion for most types of
sample. However, it is a very strong acid digestion that may dissolve most elements that
could cause environmental impact. In particular, silicate-bonding elements are unlikely to
be dissolved by this procedure. About 1-2 g (wet weight) or 1 g (dry weight) sample is
dissolved by repeated additions of nitric acid and hydrogen peroxide. For GFAA or ICP-
MS analysis, the digested solution is reduced in volume while heating then the final
volume is made to 100 ml. This method may refer to EPA 3050B. On the other hand, for
ICP-AES or FLAA analyses, hydrochloric acid (HCl) is additionally poured into the
previous digested solution; consequently, the solubility of some metals may be increased
which may refer to EPA 3050A. After filtering, filter paper and residue are dissolved by
additional HCl and then filtered again. Final digested solution is diluted to 100 ml (EPA,
2009).
A simplified procedure of EPA 3050B has been suggested as following detail. Powdered
sample (e.g., soil, sediment and sludge) is mixed in 10 ml of 1:1 HNO
3
, then sample is
covered with a watch glass. Subsequently, the sample is heated to 95±5 ºC and refluxed for
10 to 15 minutes without boiling. When the sample is allowed to cool, 5 ml of concentrate
HNO
3
is added and covered and refluxed for 30 minutes. If brown flumes are generated,
indicating oxidation of the sample by HNO
3
, repeat this step (addition of 5 ml of
HNO
3
conc.) over and over until no brown flame will be given off by the sample indicating
the complete reaction with HNO
3
. The solution has to be evaporated to approximately 5 ml
without boiling or heating at 95±5 ºC for 2 hrs. After the sample had been cooled, 2 ml of
water and 30 ml of 30% H
2
O
2
are added into the sample. In addition, 1 ml of 30% H
2
O
2
has
been continuously added with warming until the generated sample appears to have no
further change. The sample has to be heated until the volume reduces to about 5 ml. Finally,
the sample is then diluted to 100 ml with D.I. water after cooling. Particulates in the solution
must be removed by filter (Wattman No.41). The sample is now ready for analyses of ICP or
AAS.
EPA 3051: is an alternative to EPA 3050 procedure which is a rapid acid digestion of
multielement for analysis. Leaching levels must be designed. In case, hydrochloric acid is
required for digestion of certain elements; therefore EPA 3050A would be applied.
Otherwise, EPA 3051 may be considered. After 0.5 g of sample is placed in a digestion
vessel, 5 ml of 65% HNO
3
is added and the vessel is closed with a Teflon cover. Then, the
sample will be heated at 170±5ºC for approximately 5.5 minutes and remained at 170-180ºC
for 10 minutes to accelerate the leaching process by microwave digestion system. Heating
temperature and time may be adjusted as appropriate to each microwave system produced
by various manufacturers. After cooling, the solution must be filtered by membrane filter of
0.45 μm pore diameter. Finally, the filtered solution is further diluted in 50 ml volumetric
flask. The sample is now ready to be analyzed by ICP and AAS.
It has to be notified that EPA 3050 and 3051 methods usually are not total digestions;
undigested materials will be remained after acid is added into the sample. However, most of
the chemical bonding forms potentially environmental impact appear to have been
dissolved. Silicate bonding in particular is a stable form and unlikely to be removed; it
actually has no impact. Both methods are suitable for mining wastes that can be used for
environmental monitoring and protection plans. In addition, Aqua Regia, mixture of
hydrochloric acid and nitric acid, may also be applied for digestion. It is quite similar to
EPA 3050A method. Gold can be dissolved in this mixed acid which the method is usually
applied for stream sediment collected for mineral exploration.
Geochemical Application for Environmental Monitoring and Metal Mining Management
101
4.2 Sequential extraction
In the environmental field, determination of total metal concentrations in mining wastes
does not give sufficient information about the mobility of metals. Metals may be bound to
particulate matter by several mechanisms such as particle surfaces absorption, ion exchange,
co-precipitation and complexation with organic substances. For example, not all of heavy
metals in soil are available for plant uptaking, only the dissolved metals content in soil
solution is moveable enough for plant to absorb. Therefore, heavy metals speciation in form
of water soluble fraction and free weak acid soluble fraction out of total heavy metal content
are the maximum amount of heavy metals possibly uptaken by plant. However, actual
bioavailability of heavy metals by each species of plant must be determined from the plant
itself. This will lead to protection and reclamation plans after the mine close. Chemical
extraction is played an important role to define metal fractions, which can be related to
chemical species, as well as to potentially mobile, bioavailable, or ecotoxic phase of sample.
The mobile fraction is defined as the sum of amount dissolved in the liquid phase and an
amount which can be transferred into the liquid phase. It has generally accepted that
ecological effects of metals are related to such mobile fractions rather than the total
concentration.
Sequential extraction procedures are operationally defined as methodologies that are widely
applied for assessing heavy metal mobility in sediment. It is also used for the fractionation
of trace metal within sediment (Quevauviller et. al., 1993 ; Ure et. al., 1993) and allows for
the study of the bioavailability and behavior of metals fixed to the sediment (Pazos-Capeáns
et al. 2005). BCR has been applied to characterize the metal fraction of a variety of matrices,
including sediment with distinct origin, sewage sludge, amended soils and different
industrial soil (Mossop & Davidson, 2003).
There are many methods to determine the different forms of metals. BCR three-step
sequential extraction procedure is one of them, which was proposed by the Standards,
Measurements and Test Programme (SM&T-formerly Community Bureau of Reference,
BCR) of the European Union. It has been applied for the determination of trace metals (e.g.,
Cd, Co, Cr, Cu, Fe, Mn, Ni, Pb, and Zn) binding various forms. It is strongly recommended
to quantify the fractions of metal characterized by the highest mobility and availability
applied for sample which the total concentration is high enough. This procedure provides a
measurement of extractable metals from a reagent such as acetic acid (0.11 mol/l),
hydroxlyammonium chloride (0.1 mol/l) and hydrogen peroxide (8.8 mol/l), plus
ammonium acetate (1 mol/l), which are exchangeable, reducible and oxidizable metals,
respectively. There are many researchers have studied about this procedure and results
indicated that this procedure gave excellent recoveries for all six elements (e.g., Cu, Cr, Cd,
Zn, Ni and Pb). The concentration of metal extracted by the various reagents above gave a
good reproducibility on species bonded to carbonates, Fe/Mn-oxides, and the residual
fraction. Characters of each fraction are simplified and shown in Fig. 5 which summary of
these fractions are given below and details were described by Serife et al. (2003).
BCR 1: is an exchangeable, water and acid-soluble fraction. This fraction represents amounts
of elements that may be released into the environment if the condition becomes more acidic.
Acetic acid is applied for this extraction. The extracted solution includes water-soluble form,
easily exchangeable (non-specifically adsorbed) form and carbonate bonding form which are
vulnerable to change of pH and sorption–desorption processes. In addition, plants can
uptake this fraction easily; consequently, this metal form may in turn contaminate into food
chain. It is therefore the most dangerous form for the environment concern.
Environmental Monitoring
102
BCR 2: is a reducible fraction. It theoretically represents contents of metals bond to iron and
manganese oxides/hydroxides. These oxides/hydroxides are excellent cleaners of some
trace metals that have been weathered and transported from the initial sources. They are
thermodynamically unstable under anoxic conditions (Panda et al., 1995). Hydroxylamine
hydrochloride is used for this extraction. Levels of extraction in this step should be effected
by efficiency and selectivity of reagents used in the previous BCR 1. Therefore, this fraction
may be too high if the carbonates have not been completely dissolved or too low if parts of
the iron and manganese hydroxides have already been extracted.
BCR 3: is an oxidisable fraction or organic bound. Hydrogen peroxide and ammonium
acetate are applied for this extraction. Metals can bond to various forms of organic matter.
The complexities of natural organic matter are well recognized, as the phenomenon of
bioaccumulation in certain living organisms. These organic matters can be degraded
naturally under oxidizing conditions in waters leading to release of soluble metals. An
oxidizing condition may have occurred during exposure to the atmosphere either by natural
or artificial processes.
BCR 4: is defined as final residue. The final fraction can be calculated as the difference
between metal contents extractable from Aqua Regia method (using nitric and hydrochloric
acids) and metal contents released from the previous sequential extractions. Metal contents
of all three previous fractions are considerable as more mobile and bioavailable than the
residual fractions (Tack & Verloo, 1995; Ma & Rao, 1997). The residual metals appear to have
relation with mineral structures that are the most difficult to be extracted (Kersten &
Förstner, 1991).
Fig. 5. Chemical fractions of metals in sediments and their characters.
5. Case study in Thailand
Geochemical investigations as mentioned above were applied to the environmental aspects
of Akara Gold mine in Pichit Province of Thailand (i.e., Changul et al., 2010 a and b;
Geochemical Application for Environmental Monitoring and Metal Mining Management
103
Sutthirat et al., 2011). Although, obvious environmental impacts have never been directly
evidenced, some concerns have been raised by some sectors. Waste rocks from particular
mining pit and tailings from tailing pond were characterized based on their geochemistry.
Apart from AMD assessment, investigation of the geochemical characteristics, including
their heavy metal contents and the potential of each of these metals to leach, is the first step
to develop the best practice for environmental protection. Results of these studies are
summarized below.
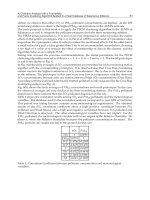
5.1 Waste rocks
Six types of waste rocks including volcanic clastic, porphyritic andesite, andesite, silicified
tuff, silicified lapilli tuff and sheared tuff were collected under supervision of mining
geologists. Whole-rock geochemistry, particularly their major compositions (rock powders
analyzed by XRF), can be used to differentiate these rocks clearly as shown in Fig. 6;
moreover, some trace elements and rare earth elements, using EPA 3052 digestion and
analyzed by ICP-OES, were applied for determination of their geneses and evolutions
(Sutthirat et al., 2011). Although, these may not be related to environmental aspect they
should be initial investigation, at least to distinguish types of waste rock clearly before
further testing program will be designed.
Subsequently, nitric leaching of these rocks was experimented following the EPA 3051
method. Amounts of leachable elements were then compared with the total digestion.
Almost linear relationship between both forms of at least eight heavy metals was observed
(Fig. 7). Except for As, the nitric recoverable levels of the heavy metals were slightly lower
than the total concentrations. In conclusion, the maximal leaching potential (%) of these
heavy metals were calculated as 30.5 - 63.2% for As, 80.4 - 81.9% for Ag, 0 - 92. 8% for Cd,
63.6 - 87.6% for Co, 91.1 - 100% for Cu, 87.9 - 99.7% for Mn, 85.3 - 93.5% for Ni and 0 - 82.8%
for Pb, respectively. Three of the six rock types, i.e., porphyritic andesite, silicified tuff and
silicified lapilli tuff, are of the greatest concern because they contain a high heavy metal load
(proportional concentration) each with a high maximal acid leaching potential. In the worst
case scenario, over 50% of the total heavy metal load would be leached by a very strong acid
passing through these rocks and impacting the environment, consequently; however, this
case is unrealistic and unlikely to happen.
Acid Base Accounting (ABA) and Net Acid Generation (NAG) tests were applied for
evaluation of acid generation potential of these waste rocks (Changul et al., 2010a).
Experimental results reveal silicified lapilli tuff and shear tuff are potentially acid forming
materials (PAF); on the other hand, the other rocks, i.e., volcanic clastic, porphyritic
andesite, andesite and silicified tuff are potentially non-acid-forming (NAF). Among these
west rocks, shear tuffs appear to be the most impact to the environment, based on their
highest potential of acid forming. Therefore, great care must be taken and focused on this
rock type. Finally, they also finally concluded that AMD generation from some waste rocks
may be occur a long time after mine closure due to the lag time of the dissolution of acid-
neutralizing sources. In addition, environmental conditions, particularly the oxidation of
sulphides which is usually activated by oxygen and water, are the crucial factor.
Consequently, waste rock dumping and storage must be planned and designed very well
that will lead to minimization of risk from AMD generation in the future. Surface
management system and addition storage pound should be installed to control the over
flood and runoff direction away from the rock waste dump. Environmental monitoring plan
including water quality should be also put in place.
Environmental Monitoring
104
5.2 Tailings
Tailing samples were also systematically collected and analyses for chemical composition
and mineral assemblages (Changul et al., 2010b). Consequently, these tailings have little
differences of chemical compositions quantitatively from place to place but their mineral
assemblages could not be clearly distinguished. They suggested that these end-processed
tailings were mixed between high and low grade ores which may have the same mineral
assemblages. Variation of chemical composition appeared to have been modified slightly by
the refining processes that may be somehow varied in proportion of alkali cyanide and
quick lime in particular. Moreover, content of clay within the ore-bearing layers may also
cause alumina content in these tailings, accordingly. Total heavy metals in the tailing
samples were analyzed using solution digested following the EPA 3052 method. Toxic
elements including Co, Cu, Cd, Cr, Pb, Ni, Zn etc. range within the Soil Quality Standards
for Habitat and Agriculture of Thailand. Only Mn contents are higher than the standard.
Potential of acid generation of these tailings was tested on the basis of Acid-Base Accounting
(ABA) and Net Acid Generation (NAG) tests. Tailing samples appear to have high sulfur
content but they also gave high acid neutralization capacity; therefore, they were generally
classified as a non-acid forming (NAF) material. However, they still suggested that
oxidizing process and dissolution should be protected with great care. Clay layer may be
placed over the pound prior to topping with topsoil for re-vegetation after the closure of the
mining operation. Native grass is suitable for stabilization of the surface and reduction of
natural erosion. In addition, water quality should also be monitored annually.
Mining and environmental management programs usually require considerable data for
best practice of mining operation and environmental monitoring. The management
techniques include the sampling and classification of waste rock types.
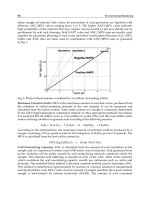
Fig. 6. Alkali-silica discrimination diagram of Le Bas et al. (1986) applied for whole-rock
geochemical analyses of waste rocks from the Akara Gold Mine, Thailand
Geochemical Application for Environmental Monitoring and Metal Mining Management
105
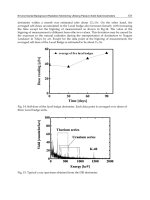
Fig. 7. Correlations between the total and nitric-leachable concentrations of eight heavy
metals from various waste rocks from Akara Gold Mine, Thailand, showing linear
regression relation
Environmental Monitoring
106
6. Conclusions
Solid mining wastes including host rocks and tailings must be managed during the whole
period of operation. Some of them can be utilized for construction and other activities;
however, some of them may also cause severe environmental impacts. Moreover,
unexpected occasions can be happened individually even routine monitoring program has
been carried out during all time of the operation. Therefore, all concerns must be taken into
account since mining plan is developed initially. All mining wastes generated from each
step of operation should be tested and put into the long term monitoring plans. Besides, all
types of top soil and host rock must be sampled systematically for analyses of AMD and
heavy metals prior to waste categorization and placement design. Dealing with natural
materials, both rock and top soil in this case, variety of chemical composition may lead to
complexity. Many of these chemicals are stable and unable to leaching out; however, just in
case of some leachable form exiting, it may turn to harmfulness and difficulty of operation.
Protection and prevention should therefore be planned well to keep mining operation
moving smoothly and clearly to be inspected.
Regarding to rock waste and top soil, both AMD and heavy metal have become the most
concerns for mining and environmental management. Some materials are unlikely to cause
AMD but they contain high amounts of heavy metals that seem to be well leachable. These
materials must be placed away from AMD potential wastes. Otherwise, mixing up of both
types can threaten the surrounding area leading to widely land contamination. Neutralizer
should be provided during the placement process. Limestone has been used as natural
neutralizer which is easy to find and quite cheap. Liners should also be provided
particularly for waste materials trending to have potentials of acid generation and/or heavy
metal contaminants. Both natural and artificial materials can be used in individual cases,
based on nature of the site and characteristics of mining waste. Cares must be taken very
well during operation as well as monitoring program must be carried out regularly. It
would also be notified that unexpected events can occur all the time; therefore, detailed
investigations have to be initiated anytime whenever unusual signature is reveled either by
regular monitoring or accident finding.
7. Acknowledgements
The author would like to thank all staff member of Geology Department, Faculty of Science,
Chulalongkorn University for their support. Dr. Chulalak Changul had been helping and
providing information earned from her PhD thesis research. This book chapter is a part of
work initiated by a research group named as Risk Assessment and Site Remediation (RASR)
which has been supported by the Center of Excellence for Environmental and Hazardous
Waste Management (NCE-EHWM), Chulalongkorn University. Moreover, this work was
partly supported by the Higher Education Research Promotion and National Research
University Project of Thailand, Office of the Higher Education Commission (project code
CC1000A).
8. References
Changul C.; Sutthirat C.; Padmanahban G. & Tongcumpou C. (2010a) Assessing the acidic
potential of waste rock in the Akara gold mining, Thailand, Journal of Environmental
Earth Science, Vol. 60, pp.1065-1071
Geochemical Application for Environmental Monitoring and Metal Mining Management
107
Changul, C.; Sutthirat, C.; Padmanahban, G. & Tongcumpou, C. (2010b). Chemical
characteristics and acid drainage assessment of mine tailings from Akara Gold
mine in Thailand, Journal of Environmental Earth Sciences, Vol. 60, pp. 1583-1595
Environment Australia (1997). Managing sulphidic mine wastes and acid drainage: Chapter
4, Best Practice Environmental Management in Mining, ISBN 0 642 19449 1
EPA (1995). Applicability of the toxicity characteristic leaching procedure to mineral
processing waste, Technical Background Document Supporting the Supplement Proposed
Rule Applying Phase IV Land Disposal Restrictions to Newly Identified Mineral
Processing Wastes, Office of Solid Waste, Available via DIALOG http://
www.environ-develop.ntua.gr/htdocs/pantazidou/tcremand.pdf
EPA (1996). Microwave Assisted Acid Digestion of Siliceous and Organically Based Matrices,
Available via DIALOG
/pdfs/3052.pdf
EPA (2009). Accelerated Acid Digestion, Available via DIALOG
ncer_abstracts/index.cfm/fuseaction/display.abstractDetail/abstract/1390
Ferguson, K.D. & Erickson, P.M. (1988). Pre-mine prediction of acid mine drainage, In
Dredged Material and Mine Tailings, Edited by Salomons W. & Forstner, U.,
Copyright by Springer-Verlag Berlin Heidelberg.
Kersten, M. & Förstner, U. (1991). Speciation of trace elements in sediments. In:, Trace
Element Speciation: Analytical Methods and Problems, Batley, G.E., Editor, CRC Press,
Boca Raton (1991), pp. 245–317
Lapakko, K. (2002). Metal Mine Rock and Waste Characterization Tools: An Overviews,
International Institute for Environmental and Development.
Le Bas, M.J. ; Le Maitre, R.W.; Streckeisen, A. & Zanettin, B. (1986). A chemical classification
of volcanic rocks based on the total alkali-silica diagram, Journal of Petrology, Vol.
27, pp.745–750
Ma, L. Q. & Rao, G. N. (1997). Chemical fractionation of cadmium, nickel, and zinc in
contaminated soils. Journal of Environmental Quality, Vol. 26, pp. 259-264
Mossop, K.F. & Davidson, C.M. (2003). Comparison of original and modified BCR
sequential extraction procedures for the fractionation of copper, iron, lead,
manganese and zinc in soils and sediments, Analytica Chimica Acta ,Vol. 478, Iss. 1,
pp. 111-118
Panda, D.; Subramanian, V. & Panigrahy, R.C. (1995). Geochemical fraction of heavy metals
in Chilka Lake (east coast of India)- A tropical coastal lagoon, Environmental
Geology, Vol.26, pp.199-210
Pazos-Capeáns, P.; Barciela-Alonso, M.C.; Bermejo-Barrera, A. & Bermejo-Barrera, P. (2005).
Chromium available fractions in arousa sediments using a modified microwave
BCR protocol based on microwave assisted extraction.
Quevauviller, P.; Imbert, J. & Olle, M. (1993). Evaluation of the use of microwave oven
systems for the digestion of environmental samples. Mikrochim. Acta, Vol. 112,
pp.147–154
Serife, T.; Senol, K. & Gokhan, B. (2003). Application of a three-stage sequential extraction
procedure for the determination of extraction metal contents in highway soils,
Turkish Journal of Chemistry, Vol.27, pp. 333-346
Environmental Monitoring
108
Shu, W.S.; Ye, Z.H.; Lan, C.Y.; Zhang, Z.Q. & Wong, M.H. (2001). Acidification of Pb/Zn
mine tailings and its effect on heavy metal mobility, Environ Int., Vol. 26, pp. 389–
394
Skousen, J.G.; Sencindiver, J.C. & Smith, R.M. (1987). A Review of Procedures for Surface
Mining and Reclamation in Areas with Acid-Producing Materials, National Research
Center for Coal and Energy, National Mine Land Reclamation Center,
Morgantown, WV.
Sutthirat, C. ; Changul, C. & Tongcumpou C. (2011). Geochemical characteristics of waste
rocks from the Akara Gold Mine, Pichit Province, Thailand, A manuscript submitted
to The Arabian Journal for Science and Engineering.
Tack, F.M.G. & Verloo, M.G. (1995). Chemical speciation and fractionation in soil and
sediment analysis, International Journal of Environment and Analytical Chemistry, Vol.
59, pp. 225–238
Tran, A.B.; Miller, S.; Williams, D.J.; Fines, P. & Wilson, G.W. (2003). Geochemical and
mineralogical characterisation of two contrasting waste rock dumps-the INAP
waste rock dump characterization project, 6th ICARD (International Conference Acid
Rock Drainage), Caims, Australia, 12-18 July 2003.
Ure, A.M.; Quevauviller, Ph.; Muntau, H. & Griepink, B. (1993). Specition of heavy metal in
solids and sediment: An account of the improvement and harmonization of
extraction techniques under taken under the auspices of the BCR of the commission
of the European Communities, International Journal of Environment and Analytical
Chemistry, Vol. 51, pp. 135-151
Wang, J.; Nakazato, T.; Sakanishi, K.; Yanada, O.; Tao, H. & Saito, I. (2004). Microwave
digestion with HNO3/H2O2 mixture at high temperatures for determination of
trace elements in coal by ICP-OES and IPC-MS, Analytica Chimica Acta, Vol. 514, pp.
115-124.
7
Determination of Fluoride and
Chloride Contents in Drinking
Water by Ion Selective Electrode
Amra Bratovcic and Amra Odobasic
University of Tuzla, Faculty of Technology,
Bosnia and Herzegovina
1. Introduction
The fluoride element is found in the environment and constitutes 0.06 – 0.09 % of the earth’s
crust. Fluoride is not found naturally in the air in large quantities. Average concentration of
fluoride in air are in the magnitude of 0.5 ng/m
3
.[
1
] Fluoride is found more frequently in
different sources of water but with higher concentrations in groundwater due to the
presence of fluoride-bearing minerals. Average fluoride concentrations in see water are
approximately 1.3 mgL
-1
. Water is vitally important to every aspect of our lives. Water is a
risk because of the possible input and transmission of infectious pathogens and parasitic
diseases. We use clean water to drink, grow crops for food and operate factories. The most
common pollutants in water are chemicals (pesticides, phenols, heavy metals and bacteria).
[
2
] According to the US Environmental Protection Agency, there are 6 groups which cause
contamination of drinking water: microorganisms, disinfectants, disinfection byproducts,
inorganic chemicals, organic chemicals, radioactive substances. This chapter concerns the
importance of continuously monitoring of fluoride and chloride in drinking water by using
a fluoride (F-ISE) and chloride (Cl-ISE) ion-selective electrodes.
Disinfectants that are added to reduce the number of microorganisms, as well as disinfection
byproducts can cause a series of disorders in body (anaemia, impaired function of liver,
kidneys, nervous system). Chemical disinfection is economically most favourable when it
comes to processing large amounts of water, for the preparation of drinking water and
wastewater treatment. That is why this type of disinfection is used almost exclusively in
Bosnia and Herzegovina. Chlorine is one of the most widely used disinfectants. Water
monitoring information helps us to control pollution level. In this context, our work concerns
the determination of fluoride in spring waters from different villages in Tuzla's Canton in
Bosnia and Herzegovina, and chloride in drinking tap water from Tuzla and Gradacac as well
as one sample of bottled water. Spring water sample from “Tarevcica” is designed by SW1,
from “Zatoca” by SW2, from “Sedam vrela” by SW3 and “Toplica” by SW4 while a tap water
from Tuzla by TW and tap water from Gradacac by GW and bottled water by FW.
The development of potentiometric ion-selective electrode has a wide range of applications
in determining ions in water and other mediums. These electrodes are relatively free from
interferences and provide a rapid, convenient and non-destructive means of quantitatively
determining numerous important anions and cations. [
3
] The use of ion-selective electrodes
Environmental Monitoring
110
enables the determination of very low concentrations of desired ions (to 10
-6
mol L
-1
). The
amount of fluoride present naturally in non-fluoridated drinking water is highly variable,
being dependent upon the individual geological environment from which the water is
obtained. It is well known that fluoridation of drinking water is an important tool in the
prevention of tooth decay. Adequate fluoride ingestion is helpful to avoid caries, but over
ingestion induces dental and skeletal fluorosis, which may result in malfunction of the bone
and joint system. [
4, 5
]. The severity depends upon the amounts ingested and the duration on
intake. Dental fluorosis is a condition where excessive fluoride can cause yellowing of teeth,
white spots and pitting or mottling of enamel. Skeletal fluorosis is a bone disease exclusively
caused by excessive consumption of fluoride.
The procedures of determination of fluoride and chloride will be described in detail.
Moreover, it will be discussed advantages and disadvantages of this method. These spring
waters are in used for tap water supply. The average fluoride concentration in 4 different
fresh spring waters was in a range of 0.04 to 0.12 mg L
-1
. The fluoride concentrations
obtained from the analyses of samples were compared with the permissible values given by
the Environmental Protection Agency, World Health Organization, American Dental
Association as well as Agency for safety food of Bosnia and Herzegovina who defined
maximum amount that is allowed in drinking water. The average chlorine concentration in
examined tap water was in a range of 4.55 mg L
-1
.
2. Importance of fluoride and chloride content in water
Chlorine and fluor are very reactive elements and because of that they easily bind to the
other elements. They belong to the group of halogens. Fluoride (F
-
) is an important anion,
present in water, air and food. Fluorides come naturally into water by dissolving minerals
that contain fluor, such as fluorite (CaF
2
), cryolite (Na
3
AlF
6
) and fluorapatite (Ca
5
(PO
4
)
3
F).
Rocks rich in alkali metals have a larger content of fluoride than other volcanic rocks. Small
amounts of fluoride are vital for the human organism, but it’s toxic in larger amounts.
Fluoride levels in surface waters vary according to geographical location and proximity to
emission sources. Surface water concentrations generally range from 0.01 to 0.3 mg L
-1
(ATSDR, 1993). Fluoride in drinking water is generally bioavailable. It has been shown, that
with all the human exposure to fluoride that varies from region to region, drinking water is
the largest single contributor to daily fluoride intake.[
6
] Due to this fact, daily fluoride
intakes (mg/kg of body weight are based on fluoride levels in the water and water
consumption per day per litter). There are maximum guiding values for fluoride in drinking
water. There are no minimum imposed limits, however there are recommended values to
ensure no potential health risks from lack of fluoride within the drinking water. World
Health Organisation (WHO) places international standards on drinking water that should
be adhered to for health purposes, however is not enforceable and each individual nation
may places its own standards and conditions on drinking water. This can be seen in the
United States, where the Environmental Protection Agency (EPA) places more lenient
drinking water standards than that of the WHO. This can be seen in the table 1.
Primary drinking water standards are those that must be enforced. Secondary drinking water
standards are non-enforceable guidelines regulating contaminants that may cause cosmetic
effects (such as skin or tooth discoloration) or aesthetic effects (such as taste, odour or colour) in
drinking water.[
7
] The WHO maximum guideline value of 1.5 is higher than the recommended
value for artificial fluoridation of water supplies, which is usually 0.5 – 1.0 mgL
-1
. [
1
]
Determination of Fluoride and Chloride Contents in Drinking Water by Ion Selective Electrode
111
Fluoride guideline value
drinking water standards
Recommended
minimum value
(m
g
L
-1
)
Maximum Value
(mgL
-1
)
Reference
WHO 0.5 1.5 WHO, 1993
USA
Primary
Secondar
y
0.5
0.5
4.0
2.0
US EPA, 1985
ADA 0.7 1.2
A
g
enc
y
for Safet
y
Food, B&H - 1.5 Statute, 2007
Table 1. International and national drinking water standards of fluoride contents
Determination of chloride ions is important in many different fields such as clinical
diagnosis [
8
,
9
] environmental monitoring [
10
,
11
,
12
] and various industrial applications [
13
,
14
].
Considering the fact that chloride channels play crucial role in physiological processes it is
not surprising that missregulation of chloride ions transport by these channels can cause
serious disorders. One of disease is cystic fibrosis. [
15
]
Chloride ions in large quantities are present in sea water and sediments of the Earth's crust
where it is associated with ions Na
+
, K
+
; Mg
2+
. Chlorides are widely distributed in nature as
salts of sodium (NaCl), potassium (KCl), and calcium (CaCl
2
). Chlorides are leached from
various rocks into soil and water by weathering. Exposure to chloride in air has been
reported to be negligible. [
16
] The taste threshold of the chloride anion in water is dependent
on the associated cation. Taste thresholds for sodium chloride and calcium chloride in water
are in the range 200–300 mg/litre [
17
]. Sodium chloride is widely used in the production of
industrial chemicals such as caustic soda, chlorine, sodium chlorite, and sodium
hypochlorite. In the human body it is also found in the form of chloride. In humans, 88% of
chloride is extracellular and contributes to the osmotic activity of body fluids. The
electrolyte balance in the body is maintained by adjusting total dietary intake and by
excretion via the kidneys and gastrointestinal tract. A normal adult human body contains
approximately 81.7 g chloride. On the basis of a total obligatory loss of chloride of
approximately 530 mg/day, a dietary intake for adults of 9 mg of chloride per kg of body
weight has been recommended (equivalent to slightly more than 1 g of table salt per person
per day). For children up to 18 years of age, a daily dietary intake of 45 mg of chloride
should be sufficient. [
16
] A dose of 1 g of sodium chloride per kg of body weight was
reported to have been lethal in a 9-week-old child [
18
] Daily requirements for intake of
chloride are up to the age range, from newborn to 500 mg and to 2000 mg for adults.
Chlorination as a method of water purification is used in 99% cases of the disinfection of
municipal water. The chlorine can be added directly into the water. The taste of chlorinated
water could be slightly acidic and it is probably because of the presence of chlorine is in the
form of hypochloric acid. Permissible concentration of chlorine as a means of disinfections is
up to 3 mg/L. Numerous analytical methods for chloride ions in a variety of samples have
been developed, such as ion chromatography [
19
,
20
] near-infrared spectrometry [
21
]
spectroscopy [
22
] light scattering [
23
] ionselective electrode method [
13
,
24
,
25
] turbidimetric
method [
26
] and flow based methods coupled with different detectors [
27
,
28
,
29
].
3. Potentiometric analysis
The potentiometric method is based upon measurements of the potential that measures
electromotive force of a galvanic element. Direct potentiometric determinations are almost
always performed using ion selective electrodes (ISEs), which are capable of rapid and
Environmental Monitoring
112
selective measurements of analyte concentration. Ion-selective potentiometry (ISP) is a non-
destructive method, which means that the sample can be used for further analysis. Ion-
selective electrode (ISE) such as chloride or fluoride, which is used in our investigation, as
detector provides a range of possibilities in the analysis of samples of biological material. [
30
]
Work of ion-selective electrode is based on the fact that there is a linear relationship between
the electrical potential established between the ISE and reference electrode and the
logarithm of activity (or effective concentration) of ions in the solution. This relationship is
described by Nernst equation:
2, 303RT
EE lo
g
(a)
zF
(1)
where E is the total potential in mV developed between the sensing and reference electrode,
z is the ion charge which is negative for anions, log(a) is the logarithm of the activity of the
measured ion. The factor 2,303 RT/F has a theoretical value of 59 mV at 25 °C. The equation
is valid for very dilute solutions or for solutions were the ion strength is constant. The
activity is equivalent to the concentration in dilute solutions but becomes increasingly lower
as the ionic strength increases. The activity (a) represents the effective concentration, while
the total fluoride ion concentration may include some bound ions as well. The electrode
responds only to free ions so it is important to avoid the formation of complexes that are
meant to be measured. In this case, the complexation would lower the activity and therefore
the electrode response. This is effectively the equation of a straight line:
y
mx c
(2)
where y = E = the measured electrode response in mV, x = log (a), c = E° = the intercept on
the y axis, m = - 0,0592/z = the electrode slope.
Ion selective electrodes are available for measuring more than 20 different cations for
instance Ag
+
, Na
+
, K
+
, Ca
2+
, and anions such as F
-
, Cl
-
, S
2-
, CN
-
.
The function of ion-selective electrode is based on selective leakage of positively charged
specie from one phase to another, creating a difference in potential. Working principle is
based on measuring the electrode potential (mV) depending on the concentration of tested
ions in the solution. The reference electrode has a constant potential, and potential of ISE is
changing with the concentration of certain ions.
3.1 Ion selective electrode as an efficient tool for monitoring of desired ion
An ion selective electrode is sensitive to analyte concentration due to the properties of the
ion-selective membrane that provides the interface between the ion-selective electrode and
the sample solution. The ability of the ion selective membrane to conduct current depends in
some manner on the presence of analyte in the solutions on both sides of the membrane. The
mechanism of this dependence varies but usually depends on some reaction of analyte at
the surface of the membrane. Analysis were carried out using a MICROPROCESSOR
pH/ION METER pMX 3000 WTW equipped with a reference electrode WTW R 500 and the
F 500 and Cl 500 as an ion-selective electrode. In Figure 1 is schematically shown reference
electrode and an ion selective electrode, where 1 indicate the filling opening for the bridge
electrolyte, fluid level of the bridge electrolyte, 3 the inner junction which must be covered
with bridge electrolyte and 4 the ground junction which indicate the minimum depth of
immersion.
Determination of Fluoride and Chloride Contents in Drinking Water by Ion Selective Electrode
113
Fig. 1. Schematic representation of reference and an ion-selective electrode. In this picture 1 -
indicate the filling opening for the bridge electrolyte, 2 - fluid level of the bridge electrolyte, 3 -
the inner junction which must be covered with bridge electrolyte and 4 - the ground junction.
For measurements with the F 500 fluoride electrode and Cl 500 chloride electrode, a
reference electrode is required. In our investigation has been used R 500 as a reference
electrode. The two electrodes together form a double rod combination electrode. Ion
selective electrodes have been storage into diluted aqueous standard solution. Measuring
range for fluoride electrode is 0.02 mg L
-1
or 10
-6
mol L
-1
and for chloride electrode from 2 to
35000 mg L
-1
or from 10
-5
to 1 mol L
-1
.
There are many advantages to use an ion-selective electrode as means of analysis, including
its efficiency, selectivity, ease of sample preparation and lack of interference and reactivity
with sample itself.
3.1.1 Fluoride electrode
One of the most significant of the solid – state electrode is the lanthanum fluoride electrode.
The membrane consists of a slice of a single crystal of lanthanum fluoride that has been doped
with europium (II) fluoride to improve its conductivity. The membrane, supported between a
reference solution and the solution to be measured, shows a theoretical response to changes in
fluoride ion activity from 0 to 10
-6
mol dm
-3
. The electrode is selective for fluoride ion, only
hydroxide ion appears to offer serious interference.[
31
] The unique property of a europium-
doped lanthanum fluoride crystal to form a membrane apparently permeable to fluoride ion
and virtually no other anion or cation, provided the first specific ion – selective fluoride
electrode. This electrode gives Nerstian response to fluoride ion concentrations from above 1M
to below 10
-5
M, and only OH
-
seems to interfere with this response.
Srinivasan and Rechnitz [
32
] noted that stirring sometimes had a substantial effect on the
observed potential. In 10
-3
M NaF solution, the potential changed from – 61.5 mV in a
quiescent solution to – 55.5 mV in a rapidly stirred solution. This shift was less at high
concentrations and negligible in the presence of 0.1 M NaNO
3
supporting electrolyte, even
at fluoride concentration as low as 5 x 10
-5
M. They recommended that readings be taken
with slow stirring (by a Teflon – coated magnetic bar), and that under these conditions
reproducibility was excellent: “The potentials were found to be quite stable, changing not
more than 0.1 mV even after an hour. The reproducibility on the same day for two different
solutions of the same concentration was within 0.1 mV”.
Environmental Monitoring
114
The kinetic response of the electrode is almost instantaneous [
32
,
33
], limited by the recorder
response time of 0.5 sec., at least in the solutions containing fluoride concentrations greater than
millimolar. In very dilute solutions, the response time is has been reported to be very long.
3.1.2 Chloride electrode
The chloride ion-selective electrode is a polycrystalline solid-state electrode that contains a
membrane. The membrane consists of a solid salt of silver sulfide/silver chloride. The
membrane must be insoluble in the analyte solution and contain the analyte ion of interest.
The membrane is placed at the end of a solid plastic tube. This membrane is in contact with
the analyte solution during the measurement. Inside of the tube is a reference solution,
which contains a known and fixed concentration of analyte (Cl
-
) solution. The concentration
difference between this inner solution and analyte solution causes the migration of charged
species across the membrane. This ion exchange process at the surface of the membrane
causes a potential to develop. Since the potential of both the reference electrode and the
inner reference (immersed in the standard solution) are constant, any change in measured
potential is caused only by a change in potential across the membrane and is a function of
the analyte chloride ion activity (or concentration).
The electrode is designed to detect chloride ions in aqueous and viscous solutions and is
suitable for use in laboratory investigations. The method allows the determination of chloride
in treated water, natural water, drinking water and most waste water with high accuracy and
sensitivity. The method is applicable only to samples containing more than 10 000 mgL
-1
dissolved substances.
All reagents used were of analytical reagent grade and were used without further
purification.
4. Results
In the experimental work ISP as a choice method was used, and Mohr's method as a
standard was the control method for the determination of chloride ions in drinking tap
water. As a comparative method could be use the UV/vis spectrophotometric method with
zirconium (IV) ion oxychloride and alizarin S for analysis of Fluoride contents. For the
determination of chloride and fluoride ions in represented drinking water has not been
required previously sample pre-treatment. Quantitative analyses were performed with
calibration curves obtained with standard solutions. The calibration curve has been
constructed by plotting obtained electrode potential vs. logarithm of concentrations of
standard chloride and fluoride solutions. In our experiments, several standard solutions
with different concentrations were prepared. Then, we measured the cell potential for each
individual standard solution and plot E
cell
vs. log C
F
This curve is our calibration curve and
has been used to determine the concentration of the unknown. The F-ISE method for the
fluoride determination can be applied either without pretreatment technique, namely
conventional potentiometric method, or with pretreatment technique, such as co-
precipitation and steam distillation. Frant and Ross [
34
] pointed out that there were changes
in potential as the pH of fluoride solutions was changed.
Since ion-selective electrode responds to activity of the analyte, it is extremely important
ionic strength solution. From the literature it is known that the OH
-
ions are only interfering
ions for fluoride electrode, at pH greater than eight. However, at pH lower than five, the
hydrogen ions also interfere, but the pH can not be too low due to the formation of HF,
Determination of Fluoride and Chloride Contents in Drinking Water by Ion Selective Electrode
115
which is a weak acid and whose salt with water gives alkaline reaction. The interference for
this fluoride electrode is pH less than 5 and higher than 7.
In this work has been used the electrode without the addition of any ionic buffer for the
determination of F
-
in examined water. The composition of the water and the total ionic
strength were analysed and were not over allowable limit for this methods in a range of
allowed concentration. The interference on the fluoride electrode from hydroxyl ion (OH
-
) is
eliminated by ensuring that pH is kept below 8. Consequently, there was no necessity to add
TISAB buffer to ensure constant ionic strength.
5. Experimental part
5.1 Potentiometric determination of fluoride
A 1000 mg L
-1
sodium fluoride stock solution was prepared by dissolving 2,21 g NaF in a
1000 mL polystyrene volumetric flask with deionised water. Sodium fluoride has been
previously oven-dried at 105 °C for 1 hour and stored in a dessicator. The concentration of
this stock solution is 1000 mgL
-1
. Standards at the required concentration were prepared by
appropriate dilution of the stock solution.
Calibration diagrams were obtained by measuring of potential of six different sets of fluorid
standard solutions ordered from low to high concentration. The concentration range is from
0.07 to 1.0 mgL
-1
. The meter reading was taken after a constant value has been attained that
is drift < 0,1 mV/min. The results are given in Table 2.
Concentration of F
-
(mgL
-1
) 0.07 0.1 0.3 0.5 0.7 1.0
Log C
F
-
-1,154 -1,0 -0,522 -0,301 -0,154 0.0
Potential (mV) 33,6 21,3 -0,1 -12,2 -24,7 -31,5
Table 2. Potentiometric responses of the membrane towards different concentrations of
fluoride ion.
On the basis of these results has been constructed diagram 1.
y = -54,988x - 30,961
R
2
= 0,9929
-40
-30
-20
-10
0
10
20
30
40
-1,2 -0,7 -0,2
Log Conc. of Fluoride
Potential, mV
NaF
Linear (NaF)
Diagram 1. Calibration curve for Fluoride ISE obtained for fluoride standard solutions in
range of concentration from 0,07 to 1 mol L
-1
. This calibration graph has been used for
determination of the samples marked as SW1, SW2, SW3 and SW4.
Environmental Monitoring
116
For determining the concentration of F
-
ions, the samples were placed in a clean, dry glass in
quantities of 50 ml. [
35
] First of all, has been determined the pH of the sample. The measured
pH value was in the range from 5 to 7, and then the sample has been stirred by using a
magnetic stirrer for 5 minutes. After that, it has been measured the concentration of fluoride
ions, by immersion of the reference and fluoride ion-selective electrode connected to the ion-
meter. After a few minutes were read values of the potential. Each sample was measured
three times in order to reduce experimental error. Based on the measured potential, was
calculated the concentration of fluoride for each individual measurement, and then,
calculated the average value of concentration.
In Table 3 are represented the obtained concentrations in samples marked as SW1, SW2,
SW3 and SW4.
Sample SW1 SW2 SW3 SW4
Potential (mV) 44,5 47,1 36,5 18,7
Conc. F
-
(mgL
-1
) 0,042 0.038 0.059 0.12
Table 3. Concentrations of fluoride obtained for samples: SW1, SW2, SW3 and SW4.
For these samples also have been determined the concentration of chloride by mercurimetric
titration. The results are shown in table 4.
Sample Concentration of Chloride (mgL
-1
)
SW1 2,81
SW2 4,80
SW3 3,60
SW4 7,25
Table 4. Concentrations of chloride obtained by mercurimetric titration method.
5.2 Potentiometric determination of chloride
Specific ion electrodes measure activity and not concentration, a large amount of an inert
strong electrolyte (e.g. nitrate ion) can be added to fix the ionic strength to a constant value.
When the ionic strength is constant, the activity is constant and concentration can be
accurately measured. To determine the concentration of chloride ions, samples were
prepared as follows: in a glass flask of 100 ml was measured 2 ml of 5% NaNO
3
, and diluted
to mark with water that is being analyzed (5% NaNO
3
concentrations in all samples was 0.1
mol L
-1
). Then, 5 mL of prepared sample was transferred in clean, dry glass and stirred
using a magnetic stirrer for 5 min with immersed electrodes. After 5 minutes of stirring, the
magnetic stirrer has been stopped and then red the potential. Response time for all samples
was in a range from 1 to 5 minutes. The samples marked by FW, TW and GW have been
analyzed on chloride concentration using a chloride selective electrode. The sample
designed as FW was analyzed using a calibration curve represented in diagram 2, while the
samples marked as TW and GW by using a calibration curve shown in diagram 3. In Table 5
are given the concentration of chloride solutions for KK1 calibration curve.
Conc. Cl
-
(mgL
-1
) 60 120 180 230 280
Potential (mV) 155.1 148.6 143.7 140.2 135.3
Table 5. Electrode response on prepared chloride standard solutions.
Determination of Fluoride and Chloride Contents in Drinking Water by Ion Selective Electrode
117
y = -0,0874x + 159,79
130
135
140
145
150
155
160
0 50 100 150 200 250 300
Concentration of Chloride (mg/L)
Potential (mV)
KK1
Linear (KK1)
Diagram 2. Shows the obtained calibration curve KK1.
In Table 6 are given the concentration of chloride solutions for KK2 calibration curve.
Conc. Cl
-
(mgL
-1
) 1 3 5 10 15 20
Potential (mV) 183.3 179.6 177.8 171.5 166.8 161.3
Table 6. Electrode response on prepared chloride standard solutions.
y = -1,1263x + 183,52
155
160
165
170
175
180
185
0 5 10 15 20 25
Concentration of Chloride, mg/L
Potential, mV
KK2
Linear (KK2)
Diagram 3. Shows the obtained calibration curve KK2.
In Table 7 are shown the average concentrations of chloride ion determined in our tested
samples.
Sample FW TW GW
Potential, mV 129.9 171,9 178,4
Concentration, mg/L 341.99 10,12 4,55
Table 7. Concentrations of chloride obtained for samples: FW, TW and GW determined
using appropriate calibration curve.
Environmental Monitoring
118
5.3 Mohr’s method
Cations and anions are systematized according to the analytical groups to make it easier to
prove. When the sample contains a lot of cations and anions is difficult or even impossible to
prove, because they interfere with each other. Ions belonging to a different groups defined
by their relationship to reagent with which the ion is deposited in hard soluble salt. Chloride
ion belongs to the fourth group of anions that precipitate reagent AgNO
3
. Mohr's method is
used for volumetric determination of chloride by titration with AgNO
3
solution in neutral or
slightly alkaline solution and using of potassium or sodium chromate as indicator. It is
based on the reactions of the formation of hardly soluble precipitates with the condition that
the reaction of precipitation is fast and that there is a true indicator that shows the end of the
titration. To determine the concentration of chloride by Mohr, samples were prepared as
follows: the sample has been transferred by pipette of 25 mL into Erlenmayer flask and
diluted by distilled water (about 100 mL) and added 2 mL of 5% K
2
CrO
4
. Thus, titration of
the sample prepared in this way has been done with standard solution of 0,0984 mol/L
AgNO
3
. The standardization of AgNO
3
has been done previously. Titration was completed
when appeared a reddish solution.
The amount of chloride was calculated using the equation:
33
AgNO AgNO Cl
Cl
mC V MR
where:
m
Cl
- the amount of chloride in water (g)
C
AgNO3
- concentration of solution (mol L
-1
)
V
AgNO3
– volume of AgNO
3
used for titration (L)
R- dilution
Calculated values of chloride concentration by Mohr method is 14.8 mg L
-1
for TW sample.
TW sample shows a significant discrepancy in values between the two methods used. The
difference is caused by problems that can occur when working with a chloride electrode.
Interference can cause:
Complexes with Bi
3+
, Cd
2+
, Mn
2+
,Pb
2+
,Sn
2+
, Tl
2+
Reducing agents
Interfering ions: 10 % error with the following concentration ratio.
(concentration ratio = interfering ion/measured ion):
In the table are given values of concentration relations for some interfering ions:
OH
-
Br
-
J
-
S
2-
CN
-
NH
3
S
2
O
3
2-
80 3x10
-3
5x10
-3
1x10
-6
2x10
-7
0.12 0.01
To determine accurately interfering ion present and its concentration in the sample, TW,
require long and detailed chemical and bacteriological analysis of water. The results
obtained for the GW and TW indicate that the chloride content is in the range of permissible
limits prescribed by WHO.
Results for the FW sample show that the concentration of chloride ions is extremely high
and exceeds the maximum limit. According to the Regulations of the Republic of Serbia,
given that Bosnia and Herzegovina has no defined Rules on allowable concentrations of
cations and anions in water, for the chloride limit is 200 mgL
-1
(Official Gazette of
SFRY 42/98). The limit in drinking water is 250 mgL
-1
. European Economic Community
Determination of Fluoride and Chloride Contents in Drinking Water by Ion Selective Electrode
119
Directive 80/777/EEC provides that in case of bottled natural mineral waters, chloride
concentrations exceed 200 mgL
-1
, and then the water is declared on the label as chlorinated.
6. Conclusion
Electroanalytical methods based on potentiometry with ion-selective electrodes seem to be
the most popular and convenient methods of fluoride and chloride ion determination.
Fluoride and chloride selective electrodes can be used to determine fluoride and chloride
concentrations in drinking water due to its high selectivity, specificity and low detection
limits. The advantages of this study include a short analysis time, elimination of sample
pretreatment, simplicity of the measuring system and relatively low instrument cost. The
concentration of fluoride ion was determined in 4 drinking water samples, while the
concentrations of chloride have been determined in 3 samples (FW, TW and GW) by a
chloride selective electrode as well as by Mohr’s method. All these samples were analyzed
with use direct reading method. By our experimental data we can conclude that the
concentration of fluoride in samples marked as SW1, SW2, SW3 and SW4 is within allowed
concentration according to World Health Organisation. On the basis of the results of
analysis carried out on the water content chloride ions can be concluded that the applied
electrochemical measurements and analytical shown that the content is the same within the
limits of permissible concentration laid down by WHO. Method ISP when it proved more
effective, fast and reliable enough to determine chloride ions in the water and the
concentration in the range of 10
-4
mol L
-1
to 10
-5
mol L
-1
. Additionally, it has an advantage
over any other analytical method because it is non-destructive and allows the use of samples
for other types of analysis. Based on the results obtained it can be concluded that there are
many advantages of using ion-selective potentiometry (ISP) in reference to standard
spectrophotometric and Mohr’s methods, because measurements with the ISP are faster,
efficient and reliable. It does not require the use of many different chemicals, and does not
require any preparation of samples before analysis, which directly affects the economic
availability. Our experimental data give in evidence that the concentration in these samples
are within the allowed concentration according to World Health Organisation except the
concentration of chloride in tested bottled water. Therefore, determining of Fluoride and
Chloride in drinking water is of great significance for human health because of daily
consumption of certain amounts.
7. References
[1] Fluoride in Drinking - water, WHO, 2004.
[2] Rowell, R. M.; Removal of metal ions from contaminated water using agricultural
residues, 2
nd
International Conference on Environmentally – Compatible Forest
Products, Portugal (2006), 241-250.
[3] Hutchins, R. S.; Bachas, L. G.; In: Handbook of Instrumental Techniques for Analytical
Chemistry, (Ed.), Chapter 38, 727-748, Upper Saddle River, NJ: Prentice-Hall, 1997.
[4] Institute of Medicine, (1997), Fluoride. In “Dietary reference intakes for calcium,
phosphorus, magnesium, vitamin D, and fluoride”, 288-313. National Academy
Press. Washington, D.C., U.S.A.
[5] World Health Organisation (WHO) 2002, Fluorides, World Health Organization
(Environmental Health Criteria 227).
Environmental Monitoring
120
[6] Appropriate use of fluorides for human health, J. J. Murray, 1986.
[7] United States Environmental Protection Agency (US EPA), 1985.
[8] Jiang, Q.S.; Mak, D.; Devidas, S.; Schwiebert, E.M.; Bragin, A.; Zhang, Y.L.; Skach, W.R.;
Guggino, W.B.; Foskett, J.K.; Engelhardt, J.F., J. Cell Biol. 1998, 143, 645-657.
[9] Huber, C.; Werner, T.; Krause, C.; Klimant, I.; Wolfbeis, O.S., Anal. Chim. Acta 1998, 364,
143-151.
[10] Montemor, M.F.; Alves, J.H.; Simoes, A.M.; Fernandes, J.C.S.; Lourenco, Z.; Costa, A.J.S.;
Appleton, A.J.; Ferreira, M.G.S., Cem. Concr. Compos. 2006, 28, 233-236.
[11] Huber, C.; Klimant, I.; Krause, C.; Werner, T.; Mayr, T.; Wolfbeis, O.S., Fresenius J. Anal.
Chem. 2000, 368, 196-202.
[12] Martin, A.; Narayanaswamy, R., Sens. Actuator B-Chem. 1997, 39, 330-333.
[13] Babu, J.N.; Bhalla, V.; Kumar, M.; Mahajan, R.K.; Puri, R.K., Tetrahedron Lett. 2008, 49,
2772-2775.
[14] Badr, I.H.A.; Diaz, M.; Hawthorne, M.F.; Bachas, L.G., Anal. Chem. 1999, 71, 1371-1377.
[15] Ratjen, F.; Doring, G., Lancet 2003, 361, 681-689.
[16] Department of National Health and Welfare (Canada). Guidelines for Canadian
drinking water quality. Supporting documentation. Ottawa, 1978.
[17] RC Weast, ed. CRC handbook of chemistry and physics, 67th ed. Boca Raton, FL, CRC
Press, 1986.
[18] Sodium, chlorides, and conductivity in drinking water: a report on a WHO working
group. Copenhagen, WHO Regional Office for Europe, 1978 (EURO Reports and
Studies 2).
[19] Mesquita, R.B.R.; Fernandes, S.M.V.; Rangel, A., J. Environ. Monit. 2002, 4, 458-461.
[20] Pimenta, A.M.; Araujo, A.N.; Conceicao, M.; Montenegro, B.S.M.; Pasquini, C.;
Rohwedder, J.J.R.; Raimundo, I.M., J. Pharm. Biomed. Anal. 2004, 36, 49-55.
[21] Wu, R.H.; Shao, X.G., Spectrosc. Spectr. Anal. 2006, 26, 617-619.
[22] Philippi, M.; dos Santos, H.S.; Martins, A.O.; Azevedo, C.M.N.; Pires, M., Anal. Chim.
Acta 2007, 585, 361-365.
[23] Cao, H.; Dong, H.W., J. Autom. Methods Manag. Chem. 2008, Article No 745636, 5.
[24] Kumar, K.G.; John, K.S.; Indira, C.J., Indian J. Chem. Technol. 2006, 13, 13-16.
[25] Shishkanova, T.V.; Sykora, D.; Sessler, J.L.; Kral, V., Anal. Chim. Acta 2007, 587, 247-253.
[26] Mesquita, R.B.R.; Fernandes, S.M.V.; Rangel, A., J. Environ. Monit. 2002, 4, 458-461.
[27] Junsomboon, J.; Jakmunee, J., Talanta 2008, 76, 365-368.
[28] Pimenta, A.M.; Araujo, A.N.; Conceicao, M.; Montenegro, B.S.M.; Pasquini, C.;
Rohwedder, J.J.R.; Raimundo, I.M., J. Pharm. Biomed. Anal. 2004, 36, 49-55.
[29] Bonifacio, V.G.; Figueiredo-Filho, L.C.; Marcolino, L.H.; Fatibello-Filho, O., Talanta
2007, 72, 663-667.
[30] Mentus S., Electrochemistry (Belgrade, 2001).
[31] Douglas A. Skoog, Donald M. West, F. James Holler, Stanley R. Crouch, Fundamentals
of Analytical Chemistry, 8
th
edition, pag. 607.
[32] Srinivasan K., Rechnitz G. A., Anal. Chem. 40, 509 (1968).
[33] Srinivasan K., Rechnitz G. A., Anal. Chem. 40, 1818 (1968).
[34] Frant, M., Ross, J. W., Jr., Science 154, 1553 (1966).
[35] Bratovcic A., Master thesis, Determining of Fluoride contents in waters by application
of contemporary of electrochemical methods, 2008, Tuzla, Bosnia and Herzegovina.