Environmental Monitoring Part 10 pptx
Bạn đang xem bản rút gọn của tài liệu. Xem và tải ngay bản đầy đủ của tài liệu tại đây (661.25 KB, 35 trang )
Environmental Monitoring
306
concentrations of urea (160 mV to 0.1 M urea at pH 5.6). In additional to the response was
more pronounced at 1 M than in 0.01 M NH
4
Cl. Time to reach 95% response was about 2.5
min for the concentration of 10
-4
– 10
-3
M. Sensitivity of the sensor in a solution of 0.01 M
NH
4
Cl and pH 5.6 was 58.8±1,2 mV/decade, the region of linear response – 0.04 - 36 mM,
for 0.01 M Tris-HCl solution – 35 mV/decade in the field of 1-25 mM. The decline of
response during the month was 10%.
2.3 Photo linking in biosensorics
Typically photo-linking prepared polymers are used (Jae Ho Shin et al., 1998; Jobst et al.,
1993; Nakako at al., 1986; Barie et al., 1998; Dobrikov & Shishkin, 1983a, 1983b; Dontha et al.,
1997; Leca et al., 1995; Nakayama & Matsuda, 1992; Nakayama et al., 1995; Navera et al.,
1991). Polyvinyl derivatives such as polyvinyl chloride were widely used at the creation of
biosensors (Jae Ho Shin et al., 1998). It was communicated about photo-linked polyvinyl
alcohol in aqueous solution for the immobilization of cells of Arthrobacter globiformis. PhI in
this case is not used. Prolonged exposure to UV light (30 min), poor adsorption and
mechanical properties of membranes obtained did not allow them to be widely used in the
photo immobilization at the manufacture of biosensors.
At the development of amperometric biosensors for the choline determination the
immobilization of cholin oxidize was made in the polyvinyl alcohol containing linked
styryl-pyridine groups which served as PhI agent (PVA/SbQ) (Leca et al., 1995). The
working and measuring electrodes were made from platinum and calomel electrode was as
comparative one. The oxidative potential was on the level of 700 mV. The polymer and
enzyme solutions were placed on a platinum disk of the working electrode and were
irradiated with UV-source with a wavelength of 254 nm during 45 min. Then the polymer
was washed in 30 mM of veronal-HCl buffer, pH 8 at 26 ˚C. It was studied the effect of the
polymerization degree and the number of groups on styrylpyrydine on the biosensor
response. For this purpose three types of polymer (with a degree of polymerization of 500,
1700 and 2300, and accordingly the number of reactive groups 2.94, 1.31 and 1.06 mol%)
were used. The highest sensitivity (21 mA/mol) and the minimum defined limit (1,5·10
-8
M)
was obtained for a polymer with a longer chain (and less cross-linking groups). This
polymer was selected for further studies. The amount of polymer for the electrode in this
series of experiments was 0.22–0.39 mg and immobilized cholin oxidase – 0.7 – 1.7 U (at the
activity of 17 U/mg). Next it was studied the effect of enzyme content in biosensor response.
If the cholin oxidase content was changed from 0.9 to 2.7 U in 0.3 mg of the polymer it was
occurred a slight increase of biosensor sensitivity to choline (20 to 22 mA/mol). The
response time was about 10-40 sec. When 0.1 M phosphate buffer (contained 0.1 M KCl at
pH 8) were used the determined limit reduced to 5·10
-9
M, however, narrowed the region
and a linear response - 4·10
-8
– 4.5·10
-5
(vs. 1.5·10
-8
- 4.5·10
-5
).
It was studied the effectiveness of immobilization of butyryl cholin oxidase in the
PVA/SbQ-matrix in the comparison with the BSA-matrix cross-linked with glutaraldehyde
(Wan et al., 1999). The polymer membrane was manufactured as follows. PVA/SbQ (45 mg)
was mixed with the enzyme (5 mg) in phosphate buffer (50 mg, 1 mM, pH 8.0). These
mixtures (0.5 ml) were applied to the gate of the IsFET and then irradiated with UV during
25 min. The greatest response of both biosensors to butyryl cholin was found when the
phosphate buffer (pH 8.0 at the concentration of 1 mM) was used. Region of linear responses
of biosensors measured in dynamic regime was 0.2-1 mM and 0.2 – 5.8 mM and the
calculated KM achieved 2 mM and 3.8 mM for BSA- and PVA/SbQ-membranes,
Photopolymerizable Materials in Biosensorics
307
respectively. When storing the biosensor with PVA/SbQ-membrane in the dry state and in
the dark at 4 ˚C for 9 months the fall of its response was 20% (similar to the decline in
storage in a phosphate buffer at pH 8 in the same conditions was achieved at 1 month). For
the biosensor based on BSA-membrane the similar declines of the responses were through 7
and 42 days when it was stored in a dry state and in the buffer, respectively. The field of the
determination of such organophosphorus pesticide as trichlorphon was similar for both
types of biosensors and amounted to 10
-3
–10
-6
M
Navera et al. (1991) reported about the development of the acetylcholine biosensor using
carbon fibers. Acetyl cholinesterase and cholin oxidase were co-immobilized in polyvinyl
alcohol with a stiryl pyrydine as cross linking agent. Duration of response was 0.8 minutes
and the linear region was within 0,2-1,0 mM.
Jobst et al. (1993) created oxygen amperometric biosensor for the application in vivo
condition. Selective membrane was made from the poly-N-vinilpirolidon cross linked with
2,6-bis-(4-azidobenziliden)-4-methylcyclohexanone (total 3%) under UV irradiation. For 10
sec 95% of the response is realized and its value in the presence of dissolved oxygen in the
water reached about 200 nA.
The biosensor based on the IsFET for the determination of a neutral lipids [34] was
developed on the sensitive membrane obtained photo-crosslinking polyvinylpyrrolidone
(PVP), 4,4 '-diazidostilben-2,2'-disulfonate sodium (0,1 g of cross-linking reagent in 100 ml of
10% aqueous solution of PVP). To 200 ml of this solution 15 mg lipase and 10 mg BSA were
added. This mixture was applied to the IsFET gate, centrifuged at 3000 rev/min for 2 min
and irradiated with a mercury lamp during 5 min. Then the mixture was treated during 15
min with a solution of glutaraldehyde at 4 º C and finally it was kept in 0.1 M solution of
glycine (4 ºC). The chips were stored in a buffer solution at 4 ºC. Linear fields of responses
were as follows: for triacetin - 100-400 mM, tributylin - 3-50 mM and triolein – 0,6-3 mM.
The minimum detectable concentration of the last was 9 mg/ml. Decline in response for 3
months was 12% only.
At the development of immune biosensors based on surface acoustic waves to detect a
specific protein (urease) as photo-crossing agent served bovine serum albumin (BSA)
modified aryldiazirine (Barie et al., 1998). Aryldiazirine absorbs light with a wavelength of
350 nm and forms a highly reactive carbenes, which are preferably interact with the C-H, C-
C, C=C, N-H, O-H or S-H groups. The surface of the transducer was sialinized by
dimethylamino-propyl-ethoxy-silane, then coated with a polyimide film (thermal
polymerization mixture p-phenylenediamine and 3,3',4,4'-biphenyl-tetracarbocyclic
dianhydride) or parilene C (poly (2-chloro-p-xylene). Then, on the surface it was applied the
mixture of triftor-methylaryl-diazirine BSA (T-BSA) with dextran and its was irradiated by
UV-source (0,7 mW/cm
2
, the main emission 365 nm). For the glass surfaces, passivated by
parilene the optimum ratio was: 75% T-BSA and 25% dextran at the irradiation time of 45
min. The density of dextran on the surface was 1 ng/mm
2
. The special peptides – antibodies
to urease were linked to the carboxylated dextran with a mixture of N-hydroxysuccinimide
and N-(3-dimethylaminopropyl)-N'-ethylcarbodiimide hydrochloride in 1:4 ratio
(passivating layer was polyimide, the operating frequency - 379, .43 MHz, the loss during
the passage - 4.89 dB). It was received a response to urea at concentrations of 15-500 µg/ml
with a maximum shift of the oscillation frequency transducer 110 kHz.
BSA derivatives were used for cross-linking antibodies to planar optrods (Gao et al., 1995).
On the surface of the waveguide (TiO
2
/SiO
2
) a mixture of 3-(trifluoromethyl)-3-(m-
izotiocyanophenil) diazirine derivative of BSA and (Fab')
2
fragments of antibodies (4:1) was
Environmental Monitoring
308
placed and then it was irradiated with UV-source (0,7 mW/cm
2
, 20 min) Immobilized
antibodies were specific to the prostate antigen. The density of immobilized antibodies was
16.8 fmol permm
2
or 1.05 µg per chip. Biosensor sensitivity reached 0.35–3.5 µg of protein
per chip. The biosensor had a low non-specific response. Its regeneration was curried out by
treatment with glycine buffer (pH 2.3). When storing the biosensor in the presence of 0.5%
BSA, and 4 ˚C during the month there is no significant activity decrease.
2.4 Application of photo polymerisable matrix at the creation of potentiometric
enzymatic biosensors
Early (Arenkov et al., 1994a; 1994b; Levkovets et al., 2004; Nabok et al., 2007; Starodub et al.,
1999a; 1999b; 2000a; 2002a; Starodub & Starodub, 2002; Starodub, 2006; Starodub et al., 2008)
we have developed prototypes of the enzyme- and immune biosensors based on the IsFETs
and the electrolyte insulator semiconductors (EIS) structures. Both types of the biosensors
are perspective for use in different fields, in particular, medicine, biotechnology and
environmental monitoring. Nevertheless, before start of their wide manufacturing there is
necessary to optimize the procedure of biological material immobilization on the transducer
surface. In generally it is the main problem of biosensorics and for it’s solving a lot of
different approaches including pure physical, chemical and hybrid physical-chemical
methods were proposed (Pyrogova & Starodub, 2008; Starodub et al., 1990; 1995; 1998;
1999c; 2001; 2005). All these methods are directed on more effective fulfillment of the main
practice demand which concern the achievement of maximal level of residual activity of
biological molecules and exposition of their active centers toward solution, simplification of
procedure of immobilization and its combining in unique electronic cycle of transducer
manufacturing, preservation of high level of biosensor response during its storage and
working, etc.
The application of the liquid polymerisable compositions (LPC) on the basis of monomer-
olygomeric substances at the biological membrane creation may be considered as
perspective approach directed on providing above mentioned practice demands. These
compositions give possibility to form sensitive membranes with adjustable physical-
chemical and mechanical abilities without strong temperature and chemical destructive
effects on biological molecules. Among the most wide dispersed LPC it is necessary to
mention a number of monomeric and olygomeric acrylate compounds (acrylic, metacrylic
acids their ethers and derivatives) as well as urethane olygomers and vinyl copolymers
(sterol, vinyl acetate, vinylidenchloride, vinylpyrrolidone and others). At the varying of
chemical origin and concentration of some components there is possibility to regulate a lot
of parameters of biological membranes obtained on the basis of these components (Rebrijev,
2000; 2002; Rebrijev et al., 2001; 2002a; 2002b; Rebrijev & Starodub, 2001; Starodub &
Rebrijev, 2002; 2007; Starodub et al., 2002b).
The use of the LPC in biosensors supposes that they should be characterized by number of
indexes, namely: they should be non-active concerning biological substances, permeable in
respect of determined analytes, as well as have defined hydrophobic-hydrophilic balance
and sufficient level of adhesion to the transducer surface. The liquid photopolymerisable
composition (LPhPC) causes special interest in biosensorics. Although it’s wide application
is restricted by the practice demands above-mentioned. As a rule at the biosensor creation
the influence of supported substances on the biological materials is not special observed.
Usually the excess of biological material is taken and for the estimation of its state the non-
direct approaches are used, namely: the determination of biosensor response, the rate of
Photopolymerizable Materials in Biosensorics
309
product formation and others. At the same time the change of structure of biological
molecules at the creation of biochips or during their preservation reflects disproportionately
on the intensity of response and lifetime of biosensor work. Moreover at the multi-layer
immobilization of biological material the inner layers may work with the small productivity
in comparison with the external ones due to the diffusive restrictions. That is why the main
purpose of this work was the elaboration of content of the LPhPC, which is characterized by
number of abilities in concordance with the biosensorics demands in respect of above
mentioned and some additional ones: simplicity of immobilization procedure and
homogeneity of formed membrane. To optimize the conditions of the enzyme including in
the LPhPC the absolute level of residual activity of the immobilized molecules was
determined and the principal factors affected on this level were characterized.
In experiments it was used: urease from soybean with activity of 200 u/mg (Sigma, USA),
GOD from Penicillium vitale with activity of 160 u/mg (Kamenskoe distillery, Ukraine),
horse radish peroxidase (HRP) of type VI with activity of 275 u/mg (Sigma, USA).
N-vinylpirrolidone (VP) was obtained from “Aldrich” (Germany). 2-hydroxy-2methyl-1-
phenylpropan-1-on (Darocure 1173, λ
max
= 310-350 nm) from “Ciba-Geigy”, Switzerland)
served as PhI. Monomethacrylate ether ethyleneglycol (МEG) was produced by “BASF”
(Germany) and olygocarbonatediethylenglycolmetacrylate (OKM-2) by АООТ "Korund"
(Russia). Olygouretane metacrilate (OUM-1000Т or OUM-2000T) was synthesised according
to (Masljuk & Chranovsky, 1989).
The IsFETs were manufactured in the Institute of Biocybernetics and Biomedical
Engineering of PAN (Poland). Each chip contained two IsFETs, which were characterized by
45-48 mV/pH. Construction of the IsFETs, device for registration of their response and the
main algorithm of measurement were described early (Starodub et al., 1990). The gate
surface of the IsFETs was preliminary cleaned by consecutive washing: sulphuric acid,
water and ethanol. On the top of this surface the mixture of the appropriate enzyme and the
LPhPC (about 1-5 μl) was dropped. Polymerisation of this mixture was curried out at the
effect of the UV radiation in vacuum conditions (0.1-0.2 mm of mercury). As source of the
UV it was used lamps: LUF-80-04 (λ
max
= 300-400 nm, intensity of light on the irradiated
surface – about 2.6 Watt/m
2
) and DRT-120 (λ
max
= 320-400 nm, intensity of luminous flux
about 12.5 Watt/m
2
).
The homogeneity of composition and obtained polymer was determined by visualization,
i.e. the absence of visible disseminations at microscopy was taken as maximal level of this
index and was marked as (++). Adhesion abilities of the formed polymer were non-direct
appreciated on the assumption of time being membrane on the transducer surface without
its peeling at the immersion of chip into buffer solution. The extreme positions, i.e.
immediate peeling of membrane was marked by ( ) and its attaching during two month –
by (++). In case of the determination of the residual enzyme activity the LPhPC was
presented as two-component mixture containing VP and PhI at 98 and 2 g/100g of
concentration, respectively. Then, to 50 μl of this mixture and 20 μl of the enzyme solution
was added at the shaking and water was removed in the vacuum conditions (0.1-0.2 mm of
mercury). The concentrations of urease, GOD and HRP in the solutions were 0.1, 0.1 and
0.02 mg per 1 ml, respectively. The time of UV irradiation was 11 and 4 min at the
application of LUF-80-04 and DRT lamps, respectively. Intensity of luminous flux was
measured by the automotive dosimeter (DAU-81). Part of the obtained membrane was
dissolved in 2 ml of 10 mM phosphate buffer with pH of 5.5, 7.0 and 6.0 in case of the
determination of activity of GOD, urease and HRP, respectively.
Environmental Monitoring
310
It is necessary to mention that at the obtaining of calibration curves the VP, PVP or
intermediate products of these substances (depends on duration of irradiation or method of
analysis) were added to the analyzed samples. The some details of experiments are given in
the text below.
According to the preliminary investigations as main component of the LPhPC it was taken
VP as substances with appropriate hydrophilic-hydrophobic balance. The optimal contents
of the enzymes and PhI were 3 and 2g per 100g of LPhPC, respectively. Primarily MEG was
used as cross-linking polymers. The results of choosing optimal variant of the LPhPC in
respect of homogeneity of the obtained polymer, its adhesion to transducer surface and
biosensor response are summarised in Table 1.
Applying the above LPhPC and immobilized GOD on the transducer surface it was created
biosensor for glucose level control (Fig. 1). It had the following characteristics: linear
response region in frame of 0.1 - 10 mM, the slope of the curve 30 mV/pC and response time
during 10 -15 min. Km values for GOD immobilized in photopolymer material is 3.1 mM. To
calculate Km used graphical method of inverse coordinates. In the literature there is
information about the positive experience of the introduction of the LPhPC glycerol, which
was injected together with enzyme in a hydrophobic matrix. We also carried out attempts to
introduce GOD in the chosen composition of LPhPC using glycerol (in an amount which
was 5, 10 and 20 of wt.%). However, it turned out, this led only to a deterioration of the
homogeneity of composition and adhesion of the polymer as well as to reducing the latter to
the surface of the transducer. So we abandoned the use of glycerol in LPhPC.
Thus, the obtained LPhPC due to its properties for ease of manufacturing and process of
biomaterial immobilization may be included in extended technological stages of
photolithographic manufacture of semiconductor structures. The created on this basis
biosensor may have the characteristics needed for use in laboratory, clinical, food and
biotechnology practice.
VP,
mas.%
MEG,
mas.%
ОКM-2,
mas.%
ОUM-
1000Т,
mas.%
Homo
g
eneit
y
Adhesion of
membrane to
ISFET surface
Response on
10 mM
GOD**
mixture
with GOD
membranes
88 10 -
93 5 - - -
88 5 5 - - - 12
88 10 ++ ++ +- 42
78 20 ++ + - 33
78 10 10 + + ++ 46
68 10 20 - - ++ 25
78 5 15 - + ++ 40
78 20 ++ 20
78 10 10*** + + ++ 57
Table 1. Some characteristics of the LPhPC based on VP*. *Quantity of PhI in all LPhPC was
2 mas%. ** In 1 mM sodium phosphate buffer, рН 7,0. *** Instead of ОUM-1000Т it was used
ОUM-2000Т
In literature as a rule, the degree of decrease in activity of biological material in the process
of immobilization is not special considered. For the state of biological structures it is using
indirect methods such as measurement values the sensor response, speed of formation of
Photopolymerizable Materials in Biosensorics
311
different substances, etc. It should be noted that for the immobilization is usually initially
taken excess of biological material. However, increased activity of enzymes in the selection
of optimal conditions for this process or its decrease in functioning and maintaining
biochips disproportionately affects on the efficiency of the measuring device (the intensity of
his response, duration of work etc.). Moreover, in most cases the biological material is
immobilized often by multilayer and thus the inner layers operate with lower productivity
due to diffusion limitations.
0
10
20
30
40
50
60
0,01 0,1 1 10 100
Substrate concentration, mМ
Response, mV
Fig. 1. Response of biosensor with the immobilized GOD (substrate – glucose).
Measurements were made in 1 mM of sodium-phospate buffer, pH 7,0.
That is why, the next experiments were fulfilled for the estimation of the absolute level of
residual activity of immobilized enzymes, as well as the main factors influencing this level,
to determine the optimal conditions for the inclusion of enzymes in photopolymer
membrane. For this purpose the enzymes immobilized in LPhPC based on VP. The obtained
on this basis polymer was water soluble, so after the dilution of its in buffer solution can
there is possible to study the activity of immobilized enzymes.
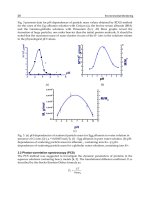
Fig. 2 presents the results of changes of GOD activity at the including into PVP matrix
depending on the source of UV radiation. These data suggest that the decreasing activity
of the enzyme occurs to a greater extent when as a source of UV radiation it was used
LUF (32.45%) than DRT lamps (37.25%), p <0.05. The presence of VP and PVP in GOD
solution made no significant influences on the level of activity, which can serve as an
indirect indicator of chemical inactivity of VP and obtained polymer in respect of the
enzyme.
It is known that immobilization of biological material is usually preceded by dissolving it
in buffer solutions. However, mixing composition, which is able for photo
polymerization, with a buffer solution, usually, leads ultimately to a deterioration
homogeneity system and mechanical properties of the resulting polymer, due to the
presence of salt ions in the system. Therefore, interest was to find out the possibility of
eliminating this effect by replacement of buffer solution on distilled water when the
preparing compositions contained biological material. First of all, it was necessary to
Environmental Monitoring
312
establish the impact of replacing the buffer solution on distilled water for preservation of
enzyme activity in the polymer. Consideration of the data is shown in Fig. 2 (UV
irradiation LUF for 11 min.) It was shown that the replacement solvent has not affect on
the level of residual enzyme activity in the membrane. This was the reason to exclude in
these studies the use of buffer solutions with the introduction of the enzyme in the photo
polymerizable composition.
The irradiation of the GOD solution (10 mM sodium phosphate buffer, pH 5.5 over time,
which corresponds to that given during the course of polymerization, i.e., 11 and 4 min for
different powers of UV sources - LUF and DRT) does not significantly affect on the change
of activity of the enzyme studied.
0
20
40
60
80
100
123456789
Enzyme acrivity, %
Fig. 2. Residual activity of GOD under different conditions of preparation of membranes.
Where: 1, 2, 5 - photo polymerization in VP, 3 - in a mixture of solutions of GOD and VP, 4 -
a mixture of solutions of PVP and GOD, 6, 7 - UV-irradiation of buffer solution of GOD, 8, 9
- mixture of solutions of GOD and PhI in glycerin (1, 5, 6, 9 - LUF irradiation; 2, 7 -
irradiation of DRT; 1, 2, 3, 4, 8, 9 – GOD was previously dissolved in water, and 5 – GOD
was previously dissolved in 10 mM sodium phosphate buffer solution, pH 5.5.
It was interested to study the effect on the GOD activity of another component LPhPC - PhI.
For this purpose it was necessary to take into account that the used 2-hydroxy-2-methyl-1-
phenylpropan-1-one as PhI is insoluble in water. To this end in LPhPC was used 2%
solution (mas.) of PhI in glycerin, which in turn dissolves in water.
As shown in Fig. 2, when entering GOD (water solution) in this composition noticeable
change in enzyme activity is not observed. At the same time UV-irradiation of this mixture
(source - LUF) leads to a reliable (p <0.005) lower enzyme activity, representing 76.7% of the
initial level. However, it is established that at the use of DRT and LUF for photo
immobilization the residual activity is according to peroxidase 41.5% and 44% and for
urease - 21% and 16.5%, reliable data, p <0,05 (Fig. 3). Conditions of the experiment were the
same as in case of GOD immobilization.
Photopolymerizable Materials in Biosensorics
313
0
5
10
15
20
25
30
35
40
45
50
123456
Enzyme activity, %
Fig. 3. Residual activity of GOD (1, 2), peroxidase (3, 4) and urease (5, 6) in photo
polymerizable matrix. Source of irradiation: LUF – 1, 3, 5 and DRT – 2, 4, 6.
0
5
10
15
20
25
12345
Enzyme activity, %
Fig. 4. The level of residual activity of urease after photo immobilization. Where: 1, 2 –
without filter for UV; 3, 4 – with application of glass filter; 5 – in condition of low
temperature (-8
0
C). Source of irradiation: LUF – 1, 3, 5 and DRT – 2, 4.
Unlike GOD and peroxidase urease reveals itself as the low stable enzyme. The fall of its
activity is due, mainly, oxidation sulfhydryl groups present in the active center. This
enzyme is subsequently used for working out optimal conditions for immobilization. In
addition, interest was to determine the influence of UV radiation of different wavelengths
on the amount of residual enzyme activity. For this purpose, the short-wave area up to λ =
300 nm was cut off by a filter (glass). At the using glass (3 mm thick) as the UV-irradiation
filter to 300 nm and without it’s the enzyme activity in the mixture after irradiation LUF did
not change (Fig. 4). However, note that in similar conditions DRT-irradiation the enzyme
Environmental Monitoring
314
activity significantly increased (p <0.001), reaching some of the value that was registered
using the LUF-irradiation. This experimental fact, most likely due to the fact that short-
range (220 - 280 nm) lamp DRT, which has great energy, influences on urease. At the same
time, irradiation of LUF with λ
max
300 - 400 nm, when the radiation is almost entirely absent
in the 220 - 280 nm using a glass filter, did not affect on the activity of the enzyme. Thus the
measured power of UV radiation of DRT (220 - 280 nm) was equal to 12 W/m
2
, which is
60% of the energy range 300 - 400 nm. Data about the effect of low temperatures (-8 ° C) on
urease activity presented in Fig. 4. Given the fact that the freezing point VP is +13 ˚C, it
should be noted that the photo polymerization at -8 ˚C was carried out in solid phase.
Apparently, lowering the temperature of polymerization mixture to -8 °C is not made
definite influence on the residual activity of urease.`
To investigate the dependence of the residual activity of urease from time of influence of
LUF illumination it was chosen the next time range: 220, 330, 440, 660 and 990 sec. It was
found that the enzyme activity decreases after the most exposure for 300 - 420 sec. (Fig. 5).
Typically, kinetics process of the polymer solidification had S-shaped character. To measure
the degree of polymerization the spectroscopic studies of irradiated RFPK were carried out
by infrared spectrophotometer SP-300S Philips with the various time of intervals. The
degree of conversion was judged by peak area with a maximum range of 1640 cm
-1
, which
corresponds to the double carbon-carbon bonds in VP that quantitatively reduced in a
polymerization composition in the comparison with the relatively quantified not variable
carbonyl VP group, which has a maximum peak at 1700 cm
-1
. The drop in enzyme activity
correlates with the polymerization matrix.
It is well known that to preserve the active center of urease during immobilization using
blocking its substrate analogs that do not split, for example, thiourea. Thiourea molecule is
similar in structure to urea and a urease competitive inhibitor. Introducing thiourea in a
mixture and analyzing the activity of the enzyme by the above mentioned method, its
impact can not be set because it is constantly present in solution. To avoid this, it was used
the following approach. It lies in the fact that the first LPhPC consisting of Oum-2000T - 10
wt. %, VP - 88 wt. % and PhI - 2 wt.% was prepared.
Fig. 5. Dynamics of changing in urease activity in dependence on time of UV irradiation by
LUF lamp.
Photopolymerizable Materials in Biosensorics
315
OUM-2000T - is a urethane oligomer with a molecular mass of 2800 with terminal
methacrylate groups, i.e. tetra functional compound that performs role of cross linking
reagent in this photo polymerizable compositions. Thus, at the photo solidification of this
composition the strong three-dimensional polymer is formed, but very flexible. In LPhPC
the enzyme solution was injected and this mixture after photo solidification formed the
strong elastic film with the thickness of 0.1-0.15 mm. Also, the control film was prepared
that does not contain thiourea. Then within two days the films were washed from thiourea.
Urease activity was calculated per unit surface of the film. Activity of the enzyme in control
films was taken as 100%. The results presented in Fig. 6 shown that at 0.5% (mas.) of the
initial contents of thiourea in LPhPC the residual urease activity increases on 11,3%
(p <0.05). At the same time increasing the thiourea content in the composition up to 1%
stabilized the enzyme in less degree.
90
95
100
105
110
115
120
abc
Enzyme activity, %
Fig. 6. Influence of thiourea content in phtopolymerizable composition on the activity of the
immobilized urease. Content of thiourea according to mass:: a – 0 %, b – 0,5%, c – 1 %.
It was stated that the urease activity decreased in LPhPC at its preservation (at - 4 ˚C).
Trough two months this decreasing reached 15% (p <0.05) (Fig. 7) then this index continued
to decline and after six months the reduction was a few less than half (47%) of fresh
compositions (p <0.005). At the same time while maintaining the urease in photopolymer
matrix (with PVP), a marked decrease in its activity during the two months was not
observed. Only after 6 months it was indicated the significant decrease in its activity, which
was approximately 30% (p <0.01). Saving GOD over six months in the PVP-matrix leads to a
decrease in its activity about 23% (p <0.005).
When the low (-35 - -50 ºC) temperature was used for the polymerization the level of
residual enzyme activity increased up to 50% at -50 ºC in comparioson with the
polymerization in ordinary (20 ºC) conditions (p <0,002). The required low temperature was
achieved using liquid nitrogen (Fig. 8).
Therefore, it was proposed a method of determining absolute enzyme activity during
immobilization in a polymer matrix and it was characterized the changes of enzyme activity
(GOD, peroxidase, urease) at photo immobilization. The main attention was paid to the
dynamics of changes of enzyme activity in the process of photo polymerization when UV
Environmental Monitoring
316
irradiation was used. The needed conditions for increasing the activity of enzymes at the
immobilization and at the storage prepared membrane were chosen.
0
5
10
15
20
25
30
35
40
01236 01236 01236
a b c
Enzyme activity, %
Fig. 7. Dynamics of changes of enzyme activity at the preservation (figures under the
columns – quantity of month). Enzyme used: a, b – urease, c – GOD. Preservation in non
polymerised composition (a) and in PVP matrix (b, c). Irradiation – by LUF lamp.
0
10
20
30
40
50
60
20 -20 -35 -50
Temperature, С
Enzyme activity, %
°
Fig. 8. Effect of temperature during LPhPC polymerization on the residual GOD activity.
2.5 Characterization of work efficiency of urea biosensor with LPhPC
This enzyme was chosen as such which has a much low stability in the comparison with
others ones mentioned above. Upon the addition of urea in the test cell the potential at the
Photopolymerizable Materials in Biosensorics
317
IsFET gate decreases as result of pH growth. Noticeable changes are found only during 0.5-3
min after substrate adding. Then, trough a few minutes decreasing voltage signal stops and
it goes to the plateau. With increasing concentration of urea the biosensor response time
decreases. For example, the duration of the analysis of 0.1 mM of urea solution is 10 min.
and at 1 mM of substrate concentration - 4 min. Dependence of the biosensor response on
the urease content in the composition is illustrated in Fig. 9, on which is shown that the
greatest response observed at the presence in its of 3% of enzyme (mas.). The graph shows
that there is a linear relationship between the content of the enzyme in the composition and
the biosensor response. In accordance with this relationship it can be concluded that further
increase the enzyme content in the composition biosensor response could be larger, and
therefore the higher sensitivity of the sensor. However, the attempts to further increase of
the enzyme content in the composition led to a sharp deterioration in both its homogeneity
and solidity derived from its polymer with immobilized enzyme.
The work of the IsFET based biosensor depends not only on the acidity of the medium and
also its ionic strength, but effect of first is much stronger than the second one. It is well
known that the work potentiometric biosensors depend on the buffer capacity of solution,
which eliminates local changes in pH under the gate region. The developed biosensor
showed the largest response in 1 mM sodium phosphate buffer (Fig. 10). However, it should
be noted that even at 10 mM buffer, the urea biosensor response was quite significant if the
substrate solution was present in concentrations of not lower than 0.5 mM. It is worth noting
that the concentration of urea in the blood serum of healthy individuals is 2.50 - 8.33 mM
and it increases to 50 - 83 mM in the case of kidney failure as a result of various diseases. So
enzymatic biosensor based on the proposed biological membranes can be successfully used
for measuring the concentration of urea in the blood without its additional dilution that
distinguishes this biosensor from others early proposed (Arenkov et al., 1994a; 1994b;
Levkovets et al., 2004; Nabok et al., 2007; Starodub et al., 1999a; 1999b; 2000a; 2002a;
Starodub & Starodub, 2002; Starodub, 2006; Starodub et al., 2008).
U, mV
0
20
40
60
80
100
120
0 0,5 1 1,5 2 2,5 3 3,5
Content of urease in composition, %
Fig. 9. Dependence of the biosensor response on urease content in the composition.
Conditions of measurement: 1 mM of sodium-phosphate buffer, pH 7.3 and 5 mМ urea.
Environmental Monitoring
318
Dependence of biosensor response on temperature (Fig. 11) shows that with its increasing
from 28 to 41 ºC the value of response increases by 15%. Similar data on the dependence of the
sensor response on the temperature were obtained by us when the sensitive membrane was
cross-linking enzyme with the protein carriers by glutaraldehyde (Soldatkin at al., 1993).
0
20
40
60
80
100
120
140
0,001 0,01 0,1 1 10 100
[Urea], mM
U, mV
1
2
3
4
Fig. 10. Dependence of biosensor response on buffer capacity of the analyzed solution. 1-4 –
concentration of sodium-phosphate buffer: 1; 2; 5 і 10 mМ respectively.
0
10
20
30
40
50
60
70
80
90
25 30 35 40 45
Temperature, °С
U, mV
Fig. 11. Dependence of the biosensor response on the temperature. Conditions of
measurements: 2 мМ sodium phosphate buffer, рН 7.3; 2 mМ urea.
It is well known that the optimum pH for urease is at 7.4. Therefore, studying the
dependence of sensor response on pH it was conducted in a range from 5.5 to 8.5 at intervals
of 0.5. In these experients polimiks-buffer (containing 2.5 mM citric acid, tris hydroxymethyl
aminomethane, borax and potassium dihydrophosphate) that supports the buffer capacity
in the pH range from 4 to 9. According to the data shown in Fig. 12, the maximum response
Photopolymerizable Materials in Biosensorics
319
in this case is achieved when the pH level was in frame of 6 - 6.5. Properties of urease
immobilized probably a little different from those which are characteristic for the free
enzyme.
0
10
20
30
40
50
60
5,0 6,0 7,0 8,0 9,0
buffer рН
Response, mV
Fig. 12. Dependence of urea biosensor response on buffer pH (1 mM of urea, 10 mM of
polymix buffer.
For biological fluids is characterized by the presence of some salts in different
concentrations, so it was important to determine the dependence of biosensor response on
ionic strength solution of NaCl (basic salt contained in biological fluids). As follows from
Fig. 13, increasing concentrations of NaCl in the analyzed solution leads to a decrease in
biosensor response for urea (1 mM in 10 mM sodium phosphate buffer, pH 7.0). At NaCl
concentration of 300 mM falling response is about 50% but at the next increase of salt
concentration up to 500 mM falling response practically does not observe.
0
5
10
15
20
25
30
35
40
0 100 200 300 400 500 600
[NaCl], mM
Response, mV
Fig. 13. Dependence of biosensor response on ionic strength of solution to be analyzed (1
mM of urea, 10 mM of sodium phosphate buffer).
Environmental Monitoring
320
In order to verify if the biosensor could be used in real conditions for analysis of human
serum the measurements were conducted by both the developed biosensor and a standard
colorimetric method using nessler's reagent. The serum blood was preliminary diluted by 10
mM of sodium phosphate buffer (pH 7.3). The data presented in Fig. 14, indicate a high level
of coincidence of results obtained by both methods. But for a single measurement
differences in test results by these methods were in the range 15-20%.
The special interest at the development of biosensors always the question is aroused about
possible time of them operations. It was shown that the intensity of the response of the
developed biosensor gradually decreased in course of 40 days. Moreover, during this period
reduce of the intensity of response was 20% (Fig. 15). This indicates the possibility of
significant extension of time functioning biosensor. As it was mention above urease contains
in the active center sulfhydryl groups, which a lot of what determines the loss of enzyme
activity over time. The latter are evident in the case of chemical modification or partial
denaturation of the enzyme at the formation of biosensor membranes. Under the conditions
of experiment the formed enzymatic membrane slowly loses its activity and life can be
above or even higher limits.
In the developed photo polymerizable composition enzyme is probably in a stabilized
condition. This confirmed by data about the studying responses of the biosensors,
biological membranes of which were obtained from the freshly composition and prepared
from one preserved in a dark place at 2 °C for 46 days. According to results shown in Fig.
16 the differences in the intensity of responses of biosensors that used these membranes
are absent. These data suggest the possibility of long storage of the finished compositions
without significant decrease in enzyme activity. In addition, this experimental fact
indicates the promising application of compositions in industrial manufacturing sensors
with immobilized urease. It seems that pre-prepared photo polymerizable composition
can be used for a long time in the process fo the photolithographic formation of
biologically active membrane of biosensors. Moreover, this process may be continuing
technological production of IsFET using basic approaches of integrated electronic
technology
0
1
2
3
4
5
6
12
Number of measurements
[Urea], mM
Fig. 14. Determination of urea in the serum blood by the colorimetric method (1) and by the
developed biosensor (2).
Photopolymerizable Materials in Biosensorics
321
0
10
20
30
40
50
60
70
80
90
100
0 10203040
Days
Response changing, %
Fig. 15. Changing of response level of urease biosensor during time of its functioning.
0
20
40
60
80
100
120
140
0,001 0,01 0,1 1 10 100
[Urea], mM
U, mV
1
2
Fig. 16. Level of responses of the biosensors with membranes: fresh prepared (1), preserved
(2) composition. Conditions of measurements: 1 mМ of sodium phosphate buffer, pH 7,3.
Thus, an easy and fast method for immobilization of the enzyme urease on the surface of the
IsFET gate is proposed. Based on the proposed bioactive membrane it was created biosensor
for the express determination of urea in solution. Possibility of prolonged operation of the
biosensor in real conditions was demonstrated. The conclusion about the possibility of
recommendations developed photo polymerizable compositions for combining technologies
of bioactive membrane production and manufacture of transducers, in particular, creation of
IsFETs.
Environmental Monitoring
322
3. Conclusion
It was demonstrated that the proposed LPhPC is very suitable for the enzymatic biosensor
creation. The process of the biological material immobilization on the surface of transducer
can be done anyway phasic process and may be served as basis for technology of the
biosensor production. Enzymes are long (up to 6 months) remaining active in staying as a
part of the developed compositions, capable of photo polymerization and in the polymer
membrane obtained from this composition. It was chosen the conditions (temperature,
filtration of UV irradiation, the presence of competitive inhibitors) that increase the residual
activity of immobilized enzymes. Extensively it was studied the properties of the developed
electrochemical biosensors based on the IsFETs for the determination of glucose and urea as
well it was show that they have the characteristics needed for use in laboratory, clinical,
food and biotech practice.
4. Acknowledgment
This work was supported by State Fond of Fundamental Investigations of Ukraine, grant
F28.7/020. Author thanks Dr. V.M. Starodub for assistance in the preparation of this article.
5. References
Ambrose T. M., Meyerhoff M. E. (1997) Photo-cross-linked decyl methacrylate films for
electrochemical and optical polyion probes. Anal. Chem., 69. 4092-4098.
Arenkov P.I., Starodub A.N., Beresin V.A. (1994a) Fiber optic immunosensors based on
enhanced chemiluminescence and their application to determine different antigens.
Sensors and Actuators (B), 18, 1-3, 161-165.
Arenkov P.I., Starodub A.N., Beresin V.A. (1994b) Construction and biomedical application
of immunosensors based on fiber optics and enhanced chemiluminescence. Optical
Engeneereng, 33, 9, 2958-2963.
Arica Y., Hasirci V. N. (1987) Immobilization of glucose oxidase in poly(2-hydroxyethyl
methacrylate) membranes. Biomaterials. 8, November, 489-495.
Barie N., Rapp M., Sigrist H., Ache H. J. (1998) Covalent photolinker-mediated
immobilization of an intermediate dextran layer to polymer-coated surfaces for
biosensing applications. Biosensors & Bioelectronics. 13. 855-860.
Dobrikov M.I., Shishkin G.V. (1983a) Photo materials on the basis of photo immobilized
enzymes. Dependence of light sensitivity on way of photo immobilization.
Avtometry. 5. 17-23.
Dobrikov M.I., Shishkin G.V. (1983b) Photo materials on the basis photo immobilized
enzymes. Dependence of photographic characteristics on conditions of fulfilment
ofconsolidating, strengthening and manifestation of hidden enzymatic image.
Avtometry. 5. 23-28.
Dontha N., Nowall W. B., Kuhr W.G. (1997) Generation of biotin/avidin/enzyme
nanostructures with maskless photolitography. Anal Chem., 69(14), Jul 15. 2619-
2625.
Doretti L., Ferrara D. (1993) Enzyme-entrapping membranes for biosensors obtained by
radiation-induced polymerization. Biosensors and Bioelectronics. 8. 443-450.
Photopolymerizable Materials in Biosensorics
323
Doretti L., Ferrara D., Barison G., Lora S. (1994) Glucose sensors based on enzyme
immobilization onto biocompatible membranes obtained by radiation-induced
polymerization. Appl Biochem Biotechnol., 49(3), Dec.,191-202.
Doretti L., Gattolin P., Burla A., Ferrara, D.; Lora, S. & Palma, G. (1998) Covalently
immobilized choline oxidase and cholinesterases on a methacrylate copolymer for
disposable membrane biosensors. Applied Biochemistry and Biotechnology, 74, 1-12.
Freemen A. (1986) Gel entrapment of whole cells and enzymes in crosslinked,
prepolymerized polyactrylamide hydrazide. Ann.N.Y.Acad.Sci., 434, 418–426.
Gao H., Sanger M., Luginbuhl R., Sigrist H. (1995) Immunosensing with photoimmobilized
immunoreagents on planar optical wave guides. Biosens Bioelectron., 10(3-4). 317-
328.
Gooding J. J., Hall E.A.H. (1996) Membrane properties of acrylate bulk polymers for
biosensor applications. Biosensors and Bioelectronics. 11, 10, 1031-1040.
Grishchenko V.K., Masljuk V.K., Gudzera S.S. (1985) Liquidphoto polimerizable compositions.
Naukova dumka, Кiev.
Hall E. A. H., Gooding J. J., Martens C. E. (1999) Acrylate polymer immobilization of
enzymes. Fresenius J Anal Chem., 364, 58-65.
Jae Ho Shin, Sang Yong Yoon, In Jun Yoon, Sung Hynk Choi, Sung Dong Lee, Hakhyun
Nam, Ceein Sig Cha. (1998) Potentiometric biosensors using immobilized enzyme
laers mixed with hydrophilic polyurethane. Sensors and Actuators (B), 50, 19–26.
Jimenez C., Bartoli J., de Rooij N.F., Koudelka-Hep M. (1995) Glucose sensor on an
amperometric microelectrode with a photopolymerizable enzyme membrane.
Sensors and Actiuators (B), 26-27, 421-424.
Jobst G., Urban G., Jachimowich A., Kohl F. Tilado O. (1993) Thin-film Clark-type oxygen
sensors based on novel polymer membrane systems for in vivo and biosensors
applications. Biosensors & Bioelectronics. 8. 123-128.
Каtsev А. М., Аbduramanove Е. Р., Starodub N.F (2009) Immobilization of bioluminescent
bacteria on the nonorganic substances and estimation of their ability for the
biotesting. Biotechnology, 2. 3. 74-78.
Kolytcheva N. V., Műller H., Marstalerz J. (1999) Influence of the organic matrix on the
properties of membrane coated ion sensor field-effect transistors. Sensors and
Actuators B., 58, 456-463.
Kumakura M., Kaetsu I. (1989) Preparation of immobilized enzyme membrane by radiation-
cast-polymerization. Isotopenpraxis. 25, 5. 192-195.
Kuriyamma T., Kimura J. (1991) FET-based biosensors. Bioprocess Technology. 15. 139–162.
Leca B., Morelis R.M., Coulet P.R. (1995) Design of a choline sensor via direct coating of the
transducer by photopolymerization of the sensing layer. Sensors and Actuators B. 26-
27. 436-439.
Lesho M. J., Sheppard N. F. (1996) Adgesion of polymer films to oxidized silicon and its
effects on perfomance of a conductometric pH sensor. Sensors and Actuators B. 37.
61-66.
Levkovets I., Adanyi N., Trummer N., Varadi M., Szendro I., Starodub N., Szekacs A. (2004)
Development of optical (OWLS) immunosensors for macromolecules and small
analytes. Biokemia, XXVIII, 7-15.
Environmental Monitoring
324
Macca C., Solda L., Palma G. (1995) Potentiometric biosensing of penicillins using a flow-
through reactor with penicillinase or penicillin amidase immobilised by gamma-
irradiation. Analytical Letters. 28, 10. 1735-1749.
Masljuk A.F., Chranovsky V.A. (1989) Photochemistry of polymerization able olygomers.
Naukova dumka, Кiev.
Mohy Eldin M. S., De Maio A., Di Martino S. Bencivenga U., Rossi S. (1999) Immobilization
of β-galactosidase on nylon membranes grafted with diethylenglycol
dimethacrylate (DGDA) by γ-radiation: effect of membrane pore size. Advances in
Polimer Technology. 18, 2, 109-123.
Moser I., Jobst G., Aschauer E. Svasek P., Varahram M., Urban G. (1995) Miniaturized thin
film glutamate and glutamine biosensors. Biosens Bioelectron., 10, 6-7, 527-232.
Munoz J., Jimenez C., Bratov A. (1997) Photosensitive polyurethanes applied to the
development of CHEMFET and ENFET devices for biomedical sensing. Biosensors
& Bioelectronics, 12. 7, 577-585.
Nabok A.V., Tsargorodskaya A., Holloway A., Starodub N.F., Gojster O. (2007) Registration
of T2mycotoxin with total internal reflection ellipsometry and QCM impedance
methods. Biosensors and Bioelectronics, 22, 885-890.
Nakako M., Hanazato Y., Maeda M., Shiono S. (1986) Neutral lipid enzyme electrode based
on ion-sensitive field effect transistors. Analitica Chimica Acta, 185. 179-185.
Nakayama Y., Matsuda T. (1992) Surface fixation of hydrogels. Heparin and glucose oxidase
hydrogelated surfaces. ASAIO J. 38(3), jul. 421-424.
Nakayama Y., Zheng Q., Nishimura J., Matsuda T. (1995) Design and properties of
photocurable electroconductive polymer for use in biosensors. ASAAIO J. 41(3), Jul-
Sep. 418-421.
Navera E.N., Sode K., Tamiya E., Karube I. (1991) Development of acetylcholine sensor
using carbon fiber (amperometric determination). Biosens Bioelectron 6(8). 675-680.
Pyrogova L.V., Starodub N.F. (2008) Immobilization of bovine leucosis antigen on the
transducer surface of biosensor, Biotechnology, 1, 2, 52-58.
Puig-Lleixa C., Ramirez-Garcia S., Bartoli J. (1999a) Development of new
photopolymerizable membrane for monochloracetate sensetive potentiometric
sensors. Analytica Chimica Acta, 386, 13-19.
Puig-Lleixa C., Jimenez C., Alonso J., Bartoli J. (1999b) Polyurethane-acrylate photocurable
polymeric membrane for ion-sensetive field-effect transistor based urea biosensors.
Analytica Chimica Acta, 389, 179-188.
Puig-Lleixa C., Jimenez C., Fabregas E., Bartoli J. (1999c) Potentiometric pH sensors based on
urethan-acrylate photocurable polymer membranes. Sensors and Actuators B. 49,
211-217.
Rebrijev A.V. (2000) Enzyme sensor on the basis of photopolimeric membranes for the urea
determination. Ukr. Biochem.J., 72, 6, 141-142.
Rebrijev A.V., Ivashkevich S.P., Starodub N.F., Kercha S.F., Masljuk A.F. (2001)
Electrochemical sensor on the basis of photo polymeric membrans for the
determination of urea. Ukr. Biochem. J., 73, 1, 133-142.
Rebrijev A.V., Starodub N.F. (2001) Photopolymers as immobilization matrix in biosensorics.
Ukr. Biochem. J., 73, 6. 5-17.
Rebrijev A.V. (2002) Optimization of conditions of the immobilization of enzymes in photo
polymerizable membrane. Ukr. Biochem J., 74, 4b (addition 2), 194-195.
Photopolymerizable Materials in Biosensorics
325
Rebrijev A.V., Starodub N.F., Masljuk A.F. (2002a) Optimization of the conditions for the
immobilization of enzymes in photopolymeric membrane. Ukr. Biochem. J., 74, 3, 82-
87.
Rebrijev A.V., Starodub N.F., Masljuk A.F. Liquid photo polimerizable compositions as
immobilization matrix in biosensorics. (2002b) Ukr. Biochem. J., 74, 4, 101-106.
Rehman F. N., Auden M., Abrams E. S., Hammond
+
Ph. W., Kenney M., Boles T. Ch. (1999)
Immobilization of acrylamide-modified oligonucleotides by co-polymerization.
Nucleic Acids Reseach. 27, 2. 649–655.
Starodub N.F. (1989) Nonelectrode biosensors – a new direction in biochemical diagnostics.
Biopolymers and cells, 1, 5–15.
Starodub N. F. (1990) Lecture notes of the Int. Sensors Center of Biocybernetics of the Acad.
of Sci. of the Socialist. Countries. Jablonna, 3. 173–202.
Starodub N.F., Chustochka L.N., Lazorenko A.V., Bubrjk O.A., Terent’jev A.V., El’skaja A.V.
(1990) Integration of biological materials in electrochemical devices. J. Anal. Chem.,
45, 1432–1440.
Starodub N.F., Samodumova I.M., Starodub V.N. (1995) Usage of organosilanes for
integration of enzymes and immunocomponents with electrochemical and optical
transducers. Sensors and Actuators (B), 176, 173-176.
Starodub N.F., Torbicz W., Pijanowska D., Starodub V.M., Kanjuk M.I., Dawgul M. (1998)
Optimization of enzyme integration with transducers for analysis of irreversible
inhibitors. Eurosensors XII. Proceedigs of the European conference on solid-state
transducers and 9 th UK conference on sensors and their applications,
Southampton, UK, 13-16 September 1998.
Starodub V.M., Fedorenko L.L., Sisetskiy A.P., Starodub N.F. (1999a) Control of mioglobin
level in an immune sensor based on the photoluminescence of porous silicon.
Sensor and Actuators (B), 58, 1-3, 409-414.
Starodub N.F., Kanjuk N.I., Kukla A.L., Kanjuk M.I., Shirshov Y.M. (1999b) Multi-enzymatic
electrochemical sensor: field measurements and their optimization. Anal. Chim.
Acta, 385, 461-466.
Starodub N.F., Torbicz W., Pijanovska D., Starodub V.M., Kanjuk M.I., Dawgul M. (1999c)
Optimization methods of enzyme integration with transducers for analysis of
irreversible inhibitors. Sensors and Actuators (B), 58, 1-3, 420-426.
Starodub N.F., Dzantiev B.B., Starodub V.M., Zherdev A.V. (2000a) Immunosensor for the
determination of the herbicide simazine based on an ion-selective field-effect
transistor. Anal. Chim. Acta, 424, 37-43.
Starodub V.M., Fedorenko L.L., Starodub N.F. (2000b) Optical immune sensor for the
monitoring protein substances in the air. Sensor and Actuators (B), 68, 1-3, 40-47.
Starodub N.F., Nabok A.V., Starodub V.M., Ray A.K., Hassan A.K.(2001) Immobilization of
biocomponents for immune optical sensors. Ukr. Biochem. J., 73, 3, 16-24.
Starodub N.F., Rebrijev A.V. (2002) Photopolymerisable membrane for electrochemical
enzymaticsensors. Abstract Book of the Seventh World Congress on Biosensors,
Kyoto, Japan, 15-17 May, 2002.
Starodub N. F., Rebriev A. V., Starodub V. M. (2002a) Biosensors and express biochemical
diagnostics of some diseases. Proc. of the NATO ASI “Biosensors and Express
Biochemical Diagnostics of Some Diseases”, Eds. N. Marczin and M. Yacoub, IOS
Press, 2002.
Environmental Monitoring
326
Starodub N., Rebrijev A., Maslyuk A. (2002b) Photopolymerisable materils and enzymatic
biosensors. Abstract Book of NATO advanced research workshop "Nanostructured
materials and coatings for biomedical and sensor applications". Kiev, Ukraine, 4-8
August 2002.
Starodub N. F., Rebriev A. V. (2002) Biosensors for diagnostics of some diseases. Abstract Book
of 53
rd
Annual Meting of the International Society of Electrochemistry
"Electrochemistry in Molecular and Microscopic Dimensions". Dusseldorf,
Germany, 15-20 September 2002.
Starodub N.F., Starodub V. M. (2002) Biosensor control of water contamination by some
chemical organic substances. Chemistry and Technology of Water, 6, 112-119.
Starodub N.F., Pyrogova L.V., Demchenko A., Nabok A.V. (2005) Antibody immobilization
on the metal and silicon surface. The use of self-assambled layers and specific
receptors, Bioelectrochemistry, 66, 111-115.
Starodub N.F. (2006) Biosensor for the evaluation of lipase. J. Mol. Catalysis B: Enzymatic,
40, 155-160.
Starodub N.F., Rebriev A.V. (2007) Liquid photopolymerizable compositions as immobilized
matrix of biosensors. Bioelectrochemistry, 71, 1, 29-32.
Starodub N.F., Kanjuk M.I., Shmyryeva A.N. (2008) Microelectronic multi-parametrical
biosensors. Biotechnology, 1, 1, 61-73.
Triven M. (1983) Immobilization enzymes. Mir, M.
Turner A. P. F. Preface (1989) Biosensors: Fundamentals and Applications. Oxford: Oxford Univ.
Press. p. 3–12.
Wan K., Chovelon J.M., Jaffrezic-Renault N., Soldatkin A.P. (1999) Sensitive detection of
pesticide using Enfet with enzymes immobilized by cross-linking and entrapment
method. Sensors and Actuators (B). 58. 399-408.
Wróblewski W., Dawgul M., Torbicz W., Brzózka Z. (1997) Anion-selective CHEMFETs.
Proc. SPIE. 3054. 197.
Wudvord J. (1988) Immobilized cells and enzymes. Methods. Mir, M.
19
Visual Detection of Change Points and
Trends Using Animated Bubble Charts
Sackmone Sirisack and Anders Grimvall
Linköping University,
Sweden
1. Introduction
The rapid growth of automatic data collection systems has increased the need for
algorithms that can efficiently reveal important features of large or complex datasets. For
example, it is often of great interest to examine the occurrence of abrupt changes in long
bi- or multivariate time series of data. Several numerical algorithms and statistical tests
have been developed to detect abrupt shifts in the mean or other parameters of uni- or
multivariate distributions (Caussinus & Mestre, 2004; Hawkins, 1977, 2001; Srivastava &
Worsley, 1986; Stephens, 1994). However, there is also a need for visualization techniques
that can help the user identify any type of abrupt changes or trends in the collected data.
More generally, techniques are needed that can simultaneously highlight important
features of the data and filter out irrelevant information (Bederson & Boltman, 1999;
Bundesen, 1990; Cleveland & McGill, 1984; Healey, 2000; Ware, 2004). In this chapter, we
present flexible and user-friendly animations of bubble charts in which subsets of the
collected data are sequentially highlighted on a static background representing all data
points.
The basic ideas of interactive visualization of quantitative data were presented before
computer technologies were sufficiently developed to enable widespread use of such
methods. In 1978, Newton introduced a form of linked brushing that allowed the user to
select a subset of observations in one display and simultaneously highlight the same
subset in another display. About a decade later, several ground-breaking articles were
published. Asimov (1985) introduced the concept of helicopter tours for viewing high-
dimensional datasets via a structured progression of 2D projections, and Becker and co-
workers (1987a, b) provided a systematic framework for brushing, linking, and other
forms of interactive statistical graphics. Moreover, Unwin and colleagues (1988)
demonstrated how zooming, rescaling, and overlaying can facilitate visual analysis of
multivariate time series data.
More recently, improvements in computing power, display resolution, and numerical
algorithms have brought interactive visualization of quantitative data to higher levels and
stimulated the development of new applications. The software XGobi and its descendant
GGobi set a new standard for interactive modification of linked plotting windows, and an
application programming interface made such methods available to the rapidly growing
group of R users (Cook & Swayne, 2007; Swayne et al., 2003; the GGobi website, 2011).
Zooming and rescaling were established as standard tools in software packages for time
Environmental Monitoring
328
series analysis, and visual specification of queries was introduced to facilitate the search for
interesting features of time series data (Hochheiser et al., 2003).
Motion charts, or animated bubble charts, represent another breakthrough in data
visualization (the Gapminder website, 2011). The basic display is a 2D bubble chart showing
observed pairs of two variables x and y that have been recorded annually for a set of objects.
By highlighting the positions of the bubbles year by year, changes over time can be
visualized. Additional information about the investigated objects can be entered into the
graphs by colour-coding the bubbles and letting their size vary with some covariate. A
Google gadget (the Google website, 2011) has made motion charts available to any user with
a good Internet connection.
The use of animated population pyramids in official statistics (the Australian Bureau of
Statistics, 2011) illustrates that almost any static graph in statistics can be animated to
visualize changes over time. However, some authors have emphasized that animations are
not always superior to static presentations such as a small multiples display (Robertson et
al., 2008). Visualization of temporal changes in the size and shape of 2D point clouds
represents yet another approach that is particularly suitable for exploring large datasets
(Landesberger et al., 2009).
Here, we present a flexible two-stage method for making animated bubble charts in Excel
®
.
In the first stage, a macro written in VBA (Visual Basic for Applications) is utilized to
identify data tables in a given worksheet and help the user select and organize the inputs to
the animation. This macro also creates a suitable bubble-chart template. Thereafter, a
collection of other VBA macros is employed to produce the animation.
The methods and software solutions we propose are designed to handle fairly large
datasets with multiple groups of objects and multiple observations per time stamp and
group. Furthermore, it can be noted that the order in which different subsets of data are
highlighted can be determined by an arbitrary numerical or string variable. In general,
bubble charts are used to visualize relationships between interval variables. However,
relationships involving categorical or ordinal variables can also be visualized. In such
cases, adding a small amount of noise (jitter) to the original data might be helpful, because
it will improve the separation of the data points so that each point is made visible. In
addition, the visualization can be extended to high-dimensional time series data by using
a macro that first performs principal components analysis and then creates 2D animated
score charts.
After a brief summary of the general principles of animating bubble charts, and some
remarks regarding design issues, we use time series of daily to monthly environmental data
to illustrate the power of visual tools to bring out important characteristics of the collected
data. Most of our analyses are focused on the occurrence of sudden shifts in the mean or
dispersion, and whether or not such shifts can be found in all investigated groups of data.
However, the tools presented here are also used to examine temporal trends across seasons
and changes along gradients. Moreover, we use a set of multivariate chemical data on olive
oils to illustrate how animated score charts can highlight differences between geographical
regions.
After presenting a set of useful displays and animation options, we resume our discussion
of factors that influence the visual impression of static and animated charts, and we also
consider how to achieve a good balance between the information content of a display and
perceptual capacity limits. In addition, we address some technical aspects of using
spreadsheets with tens of thousands of observations.
Visual Detection of Change Points and Trends Using Animated Bubble Charts
329
2. General principles of animating bubble charts
In Excel® and other spreadsheet programs, graphs added to a worksheet can be updated
automatically and almost instantaneously when the content of the worksheet is altered. This
enables animations driven by a macro that achieves step-by-step changes in the content of a
range of worksheet cells. The speed of an animation can be controlled by making calls to a
special function that puts the macro to sleep and wakes it up after a specified amount of
time.
Because visual inspection is particularly suitable for detecting motion against a static
background, we developed animations in which all data are used to construct a static
background, and different subsets of data are sequentially highlighted. In a 2D bubble chart,
this type of displays can be constructed by using open markers for the static background
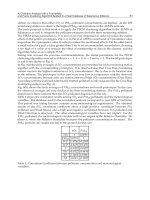
and filled markers for the highlighted data. This is illustrated in Figure 1, which shows how
the interdependence between reported pH and alkalinity levels in the Baltic Proper has
changed over time. In particular, it can be noted that the reported interdependence changed
dramatically from 1989–1993 to 1994–1998, most probably due to changes in laboratory
practices.
3. Some design issues
A user-friendly implementation of animated bubble charts requires a good balance between
flexibility and standardization. The selection of data and the design of the bubble charts
should be flexible, whereas efficient updating of spreadsheets and graphs is greatly
facilitated if the data tables have a standardized design. This favours two-stage procedures
in which a set of user forms first help the user organize the data in a standardized manner
and create a suitable graph template; thereafter, the animation can be run and controlled
with buttons and scroll bars.
We created a VBA macro that initially determines the position and size of the data tables
that are to be visualized, and then utilizes list boxes to select up to five variables for an
animated bubble chart. The first variable, which is required and may represent a time
stamp, is used to control the highlighting of different subsets of data. Variables two and
three, which are also required, represent the x and y variables in a bubble chart. Variable
four, which is optional, can be used to partition the set of bubbles into different groups.
Finally, another optional variable can be used to size code the bubbles.
The macro that prepares for the animation can also allow the user to select a suitable step
length (time step) for the animation and a desired range of animation records (time span).
Furthermore, the preparations include automatic scaling of the x- and y-axes of the bubble
chart and selection of marker types. The applicability of animated bubble charts can be
further increased by performing an optional standardization of the x and y variables to
mean zero and variance one, and by calculating the first two principal components of a user-
defined set of variables. In the latter case, high-dimensional data can be scrutinized by
creating animated 2D score charts.
4. Different types of displays
4.1 Standard bubble charts with groups
The simplest form of bubble charts has a single group of highlighted cases (see Fig. 1).
This type of display can easily be generalized to displays in which two or more groups are
Environmental Monitoring
330
assigned different coloured markers. Theoretically, the red-green-blue (RGB) system
enables colour coding of up to 2
24
groups. However, static bubble charts with more than
eight colours are difficult to perceive (Gilmore et al., 1989), and animated charts are best
perceived if no more than four groups of cases are simultaneously highlighted in the same
display.
Fig. 1. Four consecutive frames from an animation of pH against alkalinity of seawater
samples from the Eastern Gotland Basin in the Baltic Proper (sampling site BY15). Data
source: the Swedish Meteorological and Hydrological Institute (SMHI).
Figure 2 shows how the interdependence between pH and salinity of seawater samples
varied over time and between laboratories. In particular, it can be seen that in 1989–1993
the variability of pH for a given salinity was unusually large for one of the laboratories
involved, which indicates data quality problems. Moreover, there are single outliers in the
data that were collected more recently. Further studies are needed to determine whether
these outliers represent flawed data or unusual water samples. It cannot be excluded that
mixing of seawater due to strong winds can cause rather abrupt changes in pH.
We have already emphasized that multicoloured bubble charts should be used with
caution. This advice is further motivated by Figure 3, in which the upper frames with
group-specific coloured markers contain more information than the lower frames with
black markers only. Nevertheless, the lower frames show more clearly that there was a
level shift in the total volume of phytoplankton between the two time periods, although