Expert Systems for Human Materials and Automation Part 7 doc
Bạn đang xem bản rút gọn của tài liệu. Xem và tải ngay bản đầy đủ của tài liệu tại đây (2.6 MB, 30 trang )
Expert System Used on Materials Processing
171
- Orientation of the material in coolant vertical or transversal and depends on material
geometry.
- Cooling speed depends on viscosity of the coolant, its agitation speed the oxides layer
from the surface of the material. It classifies in rapid, moderate or slow.
- Uniformity of cooling process such as uniform or non-uniform.
- Global coefficient of heat transfer depends on cooling speed, material density and
specific heat and geometric factors. It classifies in high, average and low.
- Residual tensions in the material after heat treatment depend on material history and
the entire cycle of heat treatment, the material supported. It classifies in negligible,
moderate or high.
- Hardness of the material after treatment is influenced by cooling speed, carbon content
and type of the coolant. It classifies in high, average and low.
- Deformation tendency of the material depends on cooling speed, nature of the coolant
and residual stresses within material. It classifies in small, average and high.
- Cracking probability is influenced by the same parameters as deformation is.
- Input variables of the expert system.
List of the input variables is exhaustive, but between these, only those that influence the
problem analyzed by the expert system are chosen.
- Coolant water, oil, polymer
- Temperature of the coolant high, average, low
- Agitation speed for coolant insufficient, moderate or excessive,
- Viscosity of the coolant big, average, small
- Agitation type that defines the way agitation realizes through pump, adjustment or
compressor
- Circulation speed of the coolant
- Type of the coolant old or new
- Degradation of the polymer as coolant
- Material that must be treated, steel mark
- Material geometry
- Material surface and its section
- Material volume big, small
- Material density high, low
- Specific heat high, low
- Oxide layer from material surface,
- Material roughness rough or smooth
-
Orientation of the material in the coolant
- Carbon content within material
- Grains structure of the material
- Plastic deformation of the material,
Output parameters for ES:
- Orientation of the material in the coolant
- Cooling speed,
- Uniformity of cooling process,
- Global heat transfer coefficient,
- Residual stresses in material,
- Hardness of the material,
- Cracking probability.
Expert Systems for Human, Materials and Automation
172
The user can select as output parameter one or more variables from those itemized above.
We consider cooling speed as output parameter.
Input parameters:
- coolant: water
- temperature: high
- agitation speed: insufficient
- viscosity
- circulation speed of the coolant
- material
• section: thin
• volume:
• oxide layer: thick
• surface roughness: rough
We notice that the user must not complete all the lines. Certain fields are determined
automate by inference engine ES processes input data and presents on the display the result
of the analysis: rapid in our case.
Inference engine can also present intermediary reasoning based on rules from knowledge
base such as:
- a coolant with small viscosity (water) implies a rapid cooling,
- an insufficient agitation implies a slower cooling
- the areas with thin walls implies a rapid cooling
- a thick oxide layer implies o slower cooling
- a rough surface implies a rapid cooling,
- high temperature of the coolant implies a slower cooling
Per total cooling is rapid.
The program is written using Java Expert System Shell, so-called JESS. Jess uses for program
progress Forward Chaining examination technique. Inference rules apply directly to the
knowledge base. Input data are stored in working memory. At every turn, the program
gives a set of rules that satisfy the data from working memory. In order to “map” (fit) the
rules with data from the database Jess uses RETE algorithm.
Rules apply or eliminate taking into account their specificity, the conflict between them and
ponderosity.
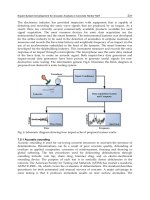
Decisions that QuenchMiner expert system takes are actually estimations based on empiric
relations experimentally ascertained and validated in practice. These are a support for the
user in taking appropriate decisions.
Decisions taken into inference Engine base on the analysis of input data and output
variables, ES identifies the dependences between variables based on cause-effect relations.
The ponderosity of each input variable is determined by analyzing the impact or in output
variable. In addition, it is analyzed influence tendency of each variable on cooling speed
taking into account its ponderosity and compares between them these tendencies in order to
model the final answer.
6.2 Expert system based on anterior cases RBC (Case-Based Reasoning)
Expert system based on anterior cases is, in fact, the process of solving new problems based
on given solutions of some similar anterior problems. RBC lies on prototype theory explored
in human cognitive sciences. RBC depends on the intuitive fact that new problems are often
similar to those met anterior and their solutions will be similar to those given in the past.
RBC does not offer concrete solutions, sure conclusions to the current problem.
Expert System Used on Materials Processing
173
(A. Aamodt and E. Plaza, 1994), proposed that case-based reasoning need to be described in
four steps:
1. Recovery of the similar cases from the past. A case consists in a problem and its solution
and the observations how it reached to this solution;
2. The use all over again of the solutions. It analyzes the connection between the anterior
case and the current problem. It identifies the resemblances and differences between the
two cases and adapts the solution to the current case;
3. Review of the solution. The new adapted solution tests and if necessary modifies;
4. Retain of the solution. The solution adapted to the new case is stored as a new case into
memory.
Each task from those four steps divides in other tasks. Thus, to recover anterior cases we
need to accomplish the following stages:
- Cases identification, their search, initial match and selection of the most accurate case.
To use all over again the solution we must realize the next steps such as solution copying, its
matching and modification. The task regarding review of the solution implies its evaluation
(by learning and simulation) and defects repair.
- Retain of the solution implies its integration by its continuation, knowledge updating, the
adequate index of the solution and the extraction of the main descriptors by justifying them for
the found solution.
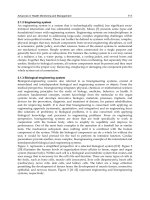
Fig. 10. Case-Based Reasoning general model.
Re-establish mechanism of the similar cases from the past is very important in method case.
For this, the method of the closest neighbors is used. In this method considers that all the
characteristics of the case are as much important, which practically does not confirm.
Accordingly, it proposed to give different ponderosities for the most important
characteristics based on the information they carry.
(Shin et al., 2000) proposed a hybrid method to regain knowledge made of CBR and neural
networks technique. The system is adequate especially when the characteristics of the case
Expert Systems for Human, Materials and Automation
174
are numerical expressed. A distance type normalized Euclidean measures the similarity of
the characteristic features (Kwang and Sang, 2006). If X is the past case with the
characteristics x
1
,
x
2
,
x
n
and takes part from class x
c
and q the vector of the current
problem with the characteristics q
f,
then the difference between the two vectors defines
through the relation
2
(,)
ff
dxq x q
⎛⎞
=−
⎜⎟
⎝⎠
(1)
by introducing value barriers, certain features can be considered similar between the two
cases. If we introduce ponderosities for the characteristics of the case based on their
importance then the distance between the two cases defines through the following relation
() ( )
D x,q wf2 x difference xf, qf 2= ∑√ (2)
where:
ff
|x q |− , if f is characterized numeric
(,)
ff f f
di
ff
erence x
q
x
q
=−, if f has numerical value, or (3)
(,)0
ff
difference x q =
, if f has symbolic value and x
f
= q
f
, or (4)
(,)1
ff
difference x q = , for other cases (5)
If the characteristic features have symbolic or unsorted values that the featured that match
can be numbered for the simple cases and it determines a similarity based on similar
characteristics.
For the complex cases proposed a more complicated metric. Stanfill and Waltz proposed as
measure “value difference metric” (VDM) that takes into account the similarity of
characteristics value.
We consider two cases X and Y, which have N characteristic features x
i
, respectively y
i
.
We
suppose n – number of classes and f
i
declared features and g characteristic class where c
l
is a
possible one. Under these conditions, VDM defines by the set of relations:
()
()
()()()
()
()
()
()
()
()
()
()
1
1
2
1
,,
,,,
,
,
N
ii
i
ii ii ii
k
n
ii l ii l
ii
ii ii
l
n
ii l
ii
ii
l
XY x y
xy dxywxy
Df x g c Df y g c
dx y
Df x Df y
Df x g c
wx y
Df x
δ
δ
=
=
=
Δ=
=
== ==
=−
==
⎛⎞
==
=
⎜⎟
⎜⎟
=
⎝⎠
∑
∑
∑
∩∩
∩
(6)
D is the number of examples in a data set for learning that satisfies the requested condition.
Expert System Used on Materials Processing
175
D(x
i
, y
i
) is a measure of similarity between the characteristics of X and Y.
()
()
/
ii i ii
D
f
x
g
cD
f
x== =
∩
represents the probability for a case with features x
i
is
classified in class c
l
.
w(x
i
, y
i
) represents the ponderosity with which x
i
feature imposes the class.
An important characteristic of CBR is its correlation with learning process. This needs a set
of techniques for extracting relevant knowledge from experience, to integrate the case into
existent knowledge and to index the case to assimilate it with the similar cases. Learning can
be:
•
inductive,
• rapid,
•
learning based on explanations through:
•
learning the most general rules;
•
learning of the rules more often used;
•
resignation of the unused rules so the learning system is not delayed.
6.3 Expert systems based on neural networks for the control of hardening control
through induction of the material
The surface hardening of the material by induction heating followed by a heat treatment
made of quenching and annealing is an old procedure often used in industry. The hardness
prediction of the material after such a heat treatment is hard to achieve due to non-linear
phenomena that take place and to their difficulty in simulation. More, the problem of
process control proves to be very difficult. The use of artificial intelligence proves to be of
good omen. At Southern-Illinois University, Technologies Department designed and
realized an ES based on neural network for this purpose.
The furnace for induction heat treatment is made of a coil with a big diameter that makes a
tunnel where the material for heat treatment passes through. The coil is supplied with high
frequency currents. The material is transported through this tunnel with a certain speed
given by an engine depending on the necessary time for heat treatment at a certain
temperature.
Variables parameters:
•
shifting speed of the material given by pulling speed of the engine,
•
height of the trembler coil,
• temperature of the material at the furnace exit,
•
time made by the material from furnace exit until it drops into a coolant for
quenching.
All the parameters are expressed in distances.
Material hardness is determined by material speed in the furnace and temperature at
furnace exit. The correlation between hardness and pulling speed of the engine and material
temperature using a linear regression equation proved to be very weak. Correlation
coefficient in R
2
is of 18.7%. In order to control the entire hardening process through
induction, it was designed a neural network, which is capable to make predictions on
hardness and functional parameters.
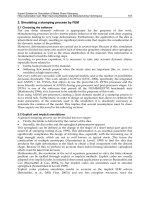
The system consists in two neural networks type “backpropagation” with a supervised
learning module. Input parameters are pulling engine speed and material temperature.
Expert Systems for Human, Materials and Automation
176
Fig. 11. Control system with an artificial neural network of the hardening process.
The first neural network was designed to predict on material hardness according to input
parameters. The network consists in two input layers, three hidden layers and one output
layer. For training, 30 set of data used and for tests 15 set of data used. The network was
taught by admitting an error of 5% on the entire value range of the hardness. The value of
the precise hardness in proportion to real hardness both at learning and at test is given in
figures 12 and 13.
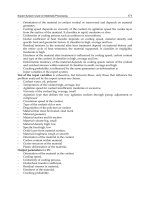
The sum of the square errors decreased considerably in relation to a linear regression
anterior determined from 15.68 to 2.53.
Fig. 12. Prediction of RN network for data used for learning: real hardness towards
predicted hardness.
Expert System Used on Materials Processing
177
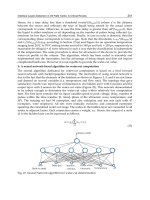
Fig. 13. Prediction of the network for test data: real hardness towards predicted hardness.
For the network that acts as feedback the same type of network adopted (backpropagation,
supervised). The architecture is a little bit different meaning that the layer of intermediary
neural has four layers. In a case the set of data for training is 14 and for tests 9 set of 3 data
used. The network was taught with a tolerance of 5% on hardness range. The speed of
pulling engine varies depending on the difference between predicted hardness and real
hardness of the material. This difference is an input variable of the first layer of the network.
The other input is made of material temperature.
7. Validity of expert system
The prediction of the neural network was tested with 32 set of real data. Each set contains
two inputs speed of the engine and material temperature. The exit from the model is
material hardness. In feedback neural network, input variables represent the difference
between the value predicted by network and the real one and material temperature.
Depending on this value, the pulling engine speed of the material through the furnace
modifies so that the difference is smaller and the calculated value is closer to the real one.
The compared results are given in table 2 and are graphically presented in figure 14.
Fig. 14. Values of hardness without RNA in proportion to hardness values with RNA.
Expert Systems for Human, Materials and Automation
178
No.
Hardness without
RNA (HR15N)
Hardness with
RNA (HR15N)
Hardness modification
(HR15N)
1 88.7 88.852 0.152
2 89.3 89.354 0.054
3 89.5 89.608 0.108
4 - Adjusted Necessary
5 88.3 88.780 0.480
6 88.3 88.890 0.590
7 87.3 89.817 2.517
8 87.3 89.314 2.014
9 88.0 89.871 1.871
10 89.0 89.495 0.495
11 - Adjusted Necessary
12 89.0 89.917 0.917
13 89.5 89.732 0.232
14 89.3 89.701 0.401
15 89.3 89.306 0.006
16 - Adjusted Necessary
17 89.3 89.865 0.565
18 88.7 89.807 1.107
19 88.7 89.941 0.241
20 89.3 89.933 0.633
21 89.3 89.354 0.054
22 - Adjusted Necessary
23 88.0 89.724 1.724
24 88.3 89.165 0.865
25 - Adjusted Necessary
26 89.3 89.366 0.066
27 89.0 89.821 0.821
28 89.3 89.354 0.054
29 - Adjusted Necessary
30 - Adjusted Necessary
31 89.3 89.825 0.525
32 89.7 89.929 0.229
inferior 88.8800 89.5488
Standard
deviation
0.6880 0.3587
Table 2. Comparison between hardness without RNA and with RNA.
8. Conclusions and perspectives of expert systems
Even though, at the beginning, the followers of artificial intelligence promotion (AI) through
expert systems hoped to develop some systems that would exceed through their
performances the human experts, this desire did not fulfill, at least not now. This happened
because knowledge acquisition within an ES is not a very simple process, as it may seem at a
Expert System Used on Materials Processing
179
first glance. Why this process would be so complicated? Probably the easiest answer is that
human expert gains, in time, not only knowledge but also experience. Knowledge itself
allows the development of some reasoning based on rules (as in ES case). On another hand,
experience allows the development of some subliminal reasoning (not accessible yet by
computing programs), which in day-to-day life would translate by instinct or inspiration.
Due to this, the majority of ES developed so far limited to relative tight domains that can be
quantified in a rigorous and direct manner.
9. References
Aamodt, A., E.Plaza(1994),A I Com-Artficial intelligence Communications, IOS Press,vol
7:1,p39-59.
Alberg H., Simulation of Welding and Heat Treatment Modelling and Validation, Doctoral
Thesis 2005:33 ISSN: 1402-1544, ISRN: LTU-DT - -05/33 -SE.
ASM Handbook - Heat Treatments, vol. IV, U.S.A., 1994.
Aylen Jonathan, Megabytes for metals: development of computer applications in the iron
and steel industry, Ironmaking and Steelmaking, 2004, vol. 31, No.6.
Friedmann E.– Hiu, Jess the Rule Engine for the Java Platform, CA, USA 2003.
Han J. and M.Kamber: Data Mining:Concepts and Techniques, Morgan Kaufman Publisher,
San Fransisco,Ca,USA,2001.
Hopgood Adrian A., The State of Artificial Intelligence, Advances in Computers, vol 65,p 1-
75, 2005.
Kang J., Y. Rong, W. Wang, "Numerical simulation of heat transfer in loaded heat treatment
furnaces", Journal of Physics, Vol. 4, France, No. 120, 2004, pp. 545-553.
Kolonder, Riesbeck and Schank,An introduction to case-based reasoning, Artificial
Intelligence Review 6(1), pp. 3-34, 1992.
Kwang Hyuk Im, Sang Chan Park, Case-based reasoning and neural network expert system
for personalization, Expert Systems with Applications 32(2006) 77-85.
Kwang Hyuk Im, Sang Chan Park, Case-based reasoning and neural network expert system
for personalization, Expert Systems with Applications 32(2007) 77-85.
Lilantha Samaranayake, Distributed Control of Electric Drives via Ethernet, TRITA-ETS-
2003-09, ISSN 1650{674xISRN KTH/EME/R 0305-SE}, Stockholm 2003.
Owhadi, J. Hedjazi, and P. Davami, Materials Science and Technology, 1998, 14, 245-250.
Romero Carlos E., Jiefeng Shan, Development of an artificial network based software for
prediction of power plant canal water discharge temperature, Expert Systems with
Applications 29(2005)835-838.
Saha Podder, A.S. Pandit, A. Murugaiyan, D. Bhattacharjee and R.K. Ray, Phase
transformation behaviour in two C-Mn-Si based steels Ander different cooling
rates, Ironmaking and Steelmaking, 2007, vol. 34, No.1.
Shin, C.K., Yun,U.T., Kim,H.K.&Park,S.C.(2000) A hibrid approach of neural network and
memory-based learning to data mining, International Journal of IEEE Transactions
on Neural Networks,11(3), 637-646.
Shin, C.K.,Yun,U.T., Kim,H.K.&Park,S.C.(2000) A hibrid approach of neural network and
memory-based learning to data mining, International Journal of IEEE Transactions
on Neural Networks,11(3), 637-646.
Shu-Hsien Liao, Expert System Methodologies and Applications-a decade review from 1995
to 2004,Expert Systems with Applications 28(2005),93-103.
Expert Systems for Human, Materials and Automation
180
Singh A., et al. Predicting microstructural evolution and yield strength of microalloyed hot
rolled steel plate, Materials Science and technology, october 2004, vol. 20, 1317.
Topolov, E.V., Panferov, V.I., Câteva probleme de realizare a automatizării cuptoarelor
industriale, Cernaia Metalurgiia, nr. 2, 1991, pp. 93-96.
Varde Aparna S., Mohammed Maniruzzaman, Elke A. Rundensteiner and Richard D. Sisson
Jr., The Quench Miner Expert Syatem for Quenching and Distorsion Control,
Worcester Polytechnic Institute(WPI),USA,2003.
Vizureanu, P., (2006) Experimental Programming in Materials Science, Mirea Publishing House,
Moscow, 2006, 116 pg., ISBN 5-7339-0601-4.
Vizureanu, P., (2009) Echipamente şi instalaţii de încălzire, Editura PIM, Iaşi, 2009, 316pg.,
ISBN 978-606-520-349-5.
Vizureanu, P., Andreescu, A., Iftimie, N., Savin, A., Steigmann, R., Leiţoiu, S., Grimberg, R.,
(2007) Neuro-fuzzy expert systems for prediction of mechanical properties induced
by thermal treatments, Buletin I.P.Iaşi, tom LIII (LVII), fasc. 2, secţia Ştiinţa şi
Ingineria Materialelor, 2007, pg. 45-52.
Vizureanu, P., Ştefan, M., Baciu, C., Ioniţă, I., (2008) Baze de date şi sisteme expert în selecţia şi
proiectarea materialelor, vol. II, Editura Tehnopress, Iaşi, 2008, 262 pg. (40
rânduri/pg.) ISBN 978-973-702-515-9.
Xu Xiaoli, Wu Guoxin and Shi Yongchao, Development of intelligent system of thermal
analysis Instrument, Journal of Physics: Conference Series 13 (2005) 59–62.
Yescas M.A., Prediction of the Vickers Hardness in austempered ductil iron using neural
networks, Int.J.Cast Metals Res. 2003,15, p513-521.
10
Interface Layers Detection in Oil Field Tanks:
A Critical Review
Mahmoud Meribout
1
, Ahmed Al Naamany
2
and Khamis Al Busaidi
3
1
Petroleum Institute,
2
Sultane Qaboos University,
3
Petroleum Development Oman,
1
United Arab Emirates
2,3
Oman
1. Introduction
An emulsion layer is a mixture of two or more liquids in which one of them - the dispersed
phase, is present as droplets of microscopic size, distributed throughout the other, called
continuous phase. The existence of such layer between oil and water is due to the crude
properties, and contaminants such as asphaltenes and resins. A measurement system to
determine the boundaries of this emulsion in a modern oil production field is necessary to
extract the pure single phase liquids [1, 2, 3]. This would for instance reduce the usage of
expensive two phase flow meters and avoid the installation of additional tank separators
along the upstream oil pipeline. In addition, this would help collecting accurate daily oil
production statistics from each oil station. One widely deployed solution consists to inject
chemical substances to completely eliminate the emulsion layer and leave only a crisp oil-
water interface which can then be detected relatively much more easier. However, this
approach is costly, not environmental friendly, and leads to a significant increase of the
retention time in the separator. This book chapter provides a survey on electronic-based-
techniques which are capable to measure the high and low boundaries of the emulsion layer
in real-time. It then describes in more details a new ultrasonic-based device along with the
experimental results it could provide.
2. State of the art techniques for emulsion layer detection in oil tanks
In recent years various types of devices have been proposed and in some cases deployed in
the oil field to measure the lower and upper positions of the emulsion layers. These devices
require more challenging design considerations than the ones used for level measurement
because of the inhomogeneity, opacity, and multitude of phases which usually exist inside
the tank. In addition, inside the crude oil tanks, there is usually abundance of H2S substance
which is a harmful gas which can cause a devastating blast in case of a small ignition of the
electrical parts of the device. Thus, the zone assigned to the inside area of the crude oil tanks
is classified as an extremely dangerous zone, namely Zone 0 area. This requires a careful
design of the device by ensuring that the voltage, current, and capacitances do not exceed a
certain limit. Recently, intensive research & development works have been performed on
Expert Systems for Human, Materials and Automation
182
the design of such devices. They can be usually classified as radioactive or non radioactive
types, in addition of featuring one or many of the followings:
- The device is non intrusive and non invasive;
- The device can operate continuously and require a minimum of maintenance;
- The device is intrinsically safe and can operate in zone 0 areas; and
- The device is a clamp-on type and externally mounted.
2.1 Differential pressure-based device
One of the commonly used devices to measure the liquid-liquid interface inside crude oil
tanks is the pressure sensor-based device. The pressure, P, at a given height, h, within a
liquid of density,
ρ
, is given by [3, 4, 5]:
Pgh
ρ
= (1)
Figure 1 below shows the principle of measuring the interface level, h
1
within an uncovered
tank containing water (density
ρ
W
) and oil (density
ρ
O
). A gauge differential pressure sensor
for which one side is in direct contact with the bottom side of the tank, and the other side is
in contact with the air provides the following gauge pressure, P
G
:
()
G1 1
() ( )
WW
P
g
h
g
Hh
ρρ
=+− (2)
Fig. 1. Principle of interface level measurement using pressure sensors.
Where H is the height of the liquid. Hence, knowing H,
ρ
W
, and
ρ
o
one can determine the
height of the interface, h
1
. Note that the temperature compensation is usually required in
these devices as the density of liquids varies with temperature. The main advantages of this
technique are that the pressure sensors are cheap, not cumbersome, and can be easily
installed in a tank. However it is suitable only when the interface separating the two liquids
is crisp. In case a relatively thick layer containing mixed liquids separates the two liquids,
the above design will not be any more applicable to determine the low and high positions of
this layer. A possible design alternative with this kind of sensors would be to place an array
Water(
ρ
W
)
Oil(
ρ
o
)
h
1
Interface Layers Detection in Oil Field Tanks: A Critical Review
183
of n pressure sensors along the vertical path of the tank which are separated by a constant
distance, x (Figure 2). Hence, the lower and higher positions of the emulsion layer (h
1
and h
2
respectively in Figure 2) would correspond to the pressure sensors providing the following
values:
11 2o2
( ) and ( )
W
Pgh Pgh
ρρ
== (3)
Fig. 2. Principle of emulsion layer measurement using pressure sensors.
Hence, for each height, h, the transmitter stores in its database the pressure values
corresponding to water and oil respectively (
ρ
W
gh) and (
ρ
O
gh). It then proceeds to compare
the actual pressure at height h, captured by the pressure sensor with these two stored
values. The top height providing same (
ρ
W
gh) and lowest height providing same (
ρ
W
gh)
corresponds to the lowest and highest interfaces respectively.
Note that in this case, the knowledge of the total height of the liquid (H in Figure 2) is not
any more required. Providing one single sensor is possible if it is attached to an electro-
mechanical system to provide precise motion of the sensor in vertical positions (Figure 3).
This technique however is not recommended in oil industry as moving parts in contact with
conductive materials are subject to fast corrosion which would affect then the precision of
the associated devices.
The other problem with both designs (Figure 2 and Figure 3) is the extremely low sensitivity
required for the pressure sensors. For instance, if a resolution of the device of x = 15 cm is
sought, a sensor with a sensitivity of at least 0.210 psi would be required. Another not less
important limitation of this device is its inability to deal with build-up problem which can
be most likely be created on the sensor in case of crude oil. These are few reasons why
pressure sensors-based devices have been used for level or crisp interface measurements,
rather than emulsion layer measurement.
Expert Systems for Human, Materials and Automation
184
Atmospheric
Pressure
Pressure due to
P=mHd
oil
Pressure due to P=mHd
oil/water
emulsion
Pressure due to P=mHd
oil
Plus the oil above
Plus the oil and the
emulsion above
Pressure Sensor
Weight to counter
Buoyancy
Pressure
Distance from the top of
the tank
Sensor raising
and
lowering mechanism
Fig. 3. Varying pressure as sensor level is changed.
2.2 Capacitive sensor-based device
Radio Frequency (RF) technology uses the electrical characteristics of a capacitor in several
different configurations for interface measurement. Commonly referred to as RF
capacitance, the method is suited for detecting the interface which might occur between or
within liquids, slurries, or granular. Basically, when two conductive plates of area, A, are
separated by a distance, d, the corresponding capacitance is proportional to the dielectric
constant of the process enclosed within the plates,
ε
r
(Figure 4):
0r
C . .A /d
εε
=
(4)
d
Conductive plates
Dielectric ε
r
C
Fig. 4. Simple configuration of a capacitance.
Interface Layers Detection in Oil Field Tanks: A Critical Review
185
In case of interface measurement, One plate can be the vessel wall, and the other one the
measurement probe or electrode (Figure 5(a)). In another configuration, both plates are
provided within the device (Figure 5(b)). For both configurations, the second plate
(reference plate) should be connected electrically to the grounded metallic tank. Hence, in
case of oil-water interface measurement, the capacitance gets short by water and thus the
effective area of the plates change with the level of the water inside the tank. This leads to a
linear trend between the height of the tank and the value of the capacitance.
(First Plate)
Water
Oil
Transmitter
Electrode
Electric wire
Tank Wall
(Second Plate)
(Second Plate)
Water
Oil
Transmitter
Electrode
(First Plate)
(a) (b)
Fig. 5. Possible configurations of the capacitance probe for interface measurement (a) with
one electrode only (b) with two electrodes.
The measurement of the emulsion layer using capacitance probe is possible by deploying a
vertical array of capacitance sensors along the vertical axis of the tank. In this case, the
transmitter measures the dielectric constant of the liquid existing between the plates to
determine the water-cut (i.e. the fraction of water in the total volume of liquid) at that
height. By doing same for all sensors of the array, a vertical profile of the liquid existing in
the tank can be provided. The difficulty here however is that for water-cut values greater
than 40%, the capacitances tend to lose their sensitivity preventing the transmitter to
determine the profile corresponding to the lower half of the emulsion layer. Another
difficulty of capacitance probes in general is their inability to deal with build-up substances
that might be created at the surface of their sensors.
2.3 Radar or microwave-based device
Radar or microwave-based devices generate electromagnetic waves, typically in the
microwave X-band (10 GHz) range, and then proceed by analyzing the received signal to
determine the liquids interface levels in the tank. The microwave generator is usually placed
on the top of the tank to beam microwaves downward and then receives one or several echo
signals which might be generated by the liquids interfaces, as well as by the top level of the
liquid and bottom area of the tank (Figure 6). The measurement of travel time for the signal
(called the time of flight) of these echoes signals allow to determine the heights of these
Expert Systems for Human, Materials and Automation
186
interfaces. For instance, in Figure 6, the height h of the oil-water interface is determined
using the following equation:
()
()
1122
H – 0.5 / – /htvtv= (5)
Where H is the distance between the transmitter and the ground (i.e. this corresponds to the
height of the tank), t
1
and t
2
, the transit time of the first and second echoes respectively, and
v
1
and v
2
the speed of microwaves in the air and oil respectively.
Water
Oil
Transmitte
r
Microwave
g
enerator
RF
Receiver
h
H
a
Echo 1
Echo 2
Fig. 6. Principle of radar-based device for interface level measurement
Note that in the above case, no echoes are reflected by the bottom wall of the tank since the
water absorbs most of the microwave energy. For this same reason, the detection of the
emulsion layer which might be created between oil and water using this type of device is
difficult. However, one of the advantages of this technology is that the sensors are not
intrusive and non invasive and hence no build-up substances are created on its sensing part.
In addition, the device is not affected by possible changes of the environmental conditions
(e.g. temperature and humidity) which facilitate its deployment in the field.
2.4 Radiation-based device
Recently, radiation-based instruments have been widely used in oil field, including for the
measurement of interface levels in oil separators and tanks. Radioisotopes (such as Gamma
sources) used for level measurement emit energy at a fairly constant rate and in a random
fashion. Different radioactive isotopes are used, based on the penetrating power needed to
“see” through the process vessel. The radiation from the source penetrates through the
vessel wall and process fluid. In case of interface measurement, the radiation sensors are
placed on a vertical array to measure the density profile across the height of the tanks. The
Tracerco Density Profiler system (based on nuclear technology) [18, 19] is one the most
famous devices using this technology (Figure 7). The instrument consists of a vertical array
of a small, gamma ray emitting radioactive sources (Americium-241, the same radioisotope
as is used in smoke detectors). The radiation is monitored by a vertical array of radiation
detectors. The source and detector assemblies are secured in dip-pipes that project down
Interface Layers Detection in Oil Field Tanks: A Critical Review
187
into the separator. The radiation beam from each source is collimated so that only the
radiation detector at the corresponding elevation detects it. The attenuation of the beam in
the process material between the source and detector is related to the density of that
material. Effectively, each source/detector pair functions as a density gauge. The outputs
from the detectors give the density profile of the fluids inside the separator from which a
precise measurement of the oil/water interface point can be obtained.
Fig. 7. The Nucleonic Tracerco’s level measurement system ([18,19]).
The advantage of this technology is its ability to operate in harsh environments and to deal
simultaneously with multitude of phases of different types (e.g. liquid and gas phases). In
addition, it is extremely suitable for applications involving high temperatures and pressures
or corrosive materials within the vessel [18.19]. However, there are a number of
compensating factors that seem to prevent nuclear from becoming a truly universal
technology. One factor is high cost which is estimated at 2-4 times that of other technologies.
In addition, because of the safety risks that might occur in case of radiation lose, periodical
inspections and approvals are vital.
2.5 Displacer-based device
Displacers or floats are some of the most commonly used interface measuring mechanisms
for ages. They rely on the Archimedes principle which states that when a body is floated or
immersed in a fluid, it loses weight equal to the weight of the liquid displaced [20][21].
Hence, when two liquids have densities
ρ
1
and ρ
2
(ρ
1
< ρ
2
), a floater with density ρ would
float on the interface separating the two liquids if the following condition is satisfied:
12
ρ < ρ <ρ
(6)
In case of emulsion layer measurement, a vertical array of several floats can be deployed in
such a way that adjacent floats have densities which match the ones of liquids to be
detected. For instance in Figure 8, the middle float would have a weight just larger than the
oil and just lower than the highest level of emulsion to be measured.
These devices have the advantages to be simple, accurate and can be adapted to measure
wide variations in fluid densities. However, once the sensor is set up and adjusted for
specific density of the liquid, the fluids measured must maintain their density, which is not
always the case in oil field tanks where the wide variation range of temperature leads to a
Expert Systems for Human, Materials and Automation
188
change in the density of the liquid. Another possible source of errors in displacer/floats
measurements is caused by sticky fluids such as heavy crude oil which can deposit on it and
effectively change the displacement and causes a calibration shift.
Displacers
Signal Processing
& Microprocessor
Oil
Water
Emulsion
Fig. 8. Displacers floating at top of each liquid.
2.6 Vibrating switches-based device
Vibrating level switches detect the dampening that occurs when a vibrating probe
submerged in the target fluid moves at a resonance frequency which can range from 85 to
400 Hz. This dampening is function of the density of the fluid surrounding it. Figure 9
shows the basic principle of the device. It comprises mainly a paddle, control and processing
unit, a magnet, and reed switch. The control and processing unit uses a driver coil to induce
a 85-400 Hz vibration in the paddle that is damped out when the paddle gets covered by a
process material. Hence, the magnet which is screwed inside the paddle moves vertically up
and down and the reed switch gets actuated whenever the magnet is located in front of the
switch. By this way, the sensor can detect both rising and falling levels of the paddle whose
speed depends on the process. Hence, by deploying a vertical array of these switches inside
the oil tank, the liquid profile inside the tank can be obtained. These devices can detect
liquid/liquid, liquid/vapor, and solid/vapor interfaces, and can also signal density or
viscosity variations. In addition, they are able to operate at pressures reaching up to 3,000
psig and at temperatures ranging from -100 to 150°C (-150 to 300°F).
Interface Layers Detection in Oil Field Tanks: A Critical Review
189
Magnet
Paddle
vibration
Control and
Processing
Unit
Reed Switch
Fig. 9. Block diagram of the vibrating Switch for interface measurement
Also, the low operational frequency of these sensors makes the hardware-software design of
the system easy and cheap. In addition, its fast response time, which is about 1 second, make
real-time measurements possible. However, one major disadvantage of these sensors is the
huge power required to drive the sensors up and down in the oil tank. Such motions may
create some turbulences on the fluid which may induce some measurement errors. Another
disadvantage of this device is the necessity to watch its sensing part immediately after each
immersion in a sludge or slurry as they are extremely sensitive to material build-up or
coating. In addition they are invasive and intrusive. These are few reasons why these
sensors have been rarely deployed in the field.
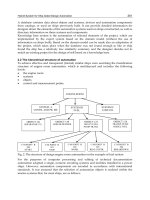
2.7 Optical fiber-based device
In recent years, optical fiber sensors have been used in some oil field tanks as they have the
capability to measure the pressure and temperature at different vertical positions of the tank
and along one single optical fiber [3, 4, 5, 6, 7]. The basic concept is that the power propagating
along the optical fiber is attenuated if part of its cladding is removed and if the external
surrounding medium has a refractive index greater than that of the core. This is known as
Fiber Brag Grating (Figure 10). Consequently the sensing element consists of a fiber that
extends over the whole depth of the tank and whose cladding has been removed in equally
spaced zones. Every time the liquid reaches or leaves one of these zones, the output power
increases or decreases depending on the direction of the change of the liquid level. The liquid
measurement is then carried by a discrete component analog signal conditioning circuit, which
sums the up and down output power variations, each of which is counted separately. This
prototype showed itself to have a good accuracy and an acceptable dynamic performance. The
transducer resolution can be extremely low (less than 1 mm).
Expert Systems for Human, Materials and Automation
190
Transducer
Claddings
Optical fiber
Fig. 10. Principle of multi-level measurements using optical fiber.
In practice, increasing the number of unclad zones per meter would decrease the output
power changes when the liquid level nears the full-scale. Hence, if the resolution has to be
improved, the sensitivity of the signal conditioning hardware must be increased, to allow
useful output power variations to be distinguished from noise. One of the major advantages
of this type of sensors is that the readings are not affected by the electrical interfaces that
might be generated by the surrounding electrical cables or motors. In addition they are
intrinsically safe and the signal cable can be deployed inside the tank without the need of
any kind of certification. However, one of their main disadvantages is their incapacity to
overcome the build-up problem.
3. An alternative: ultrasonic-based device
Detection of changes of composition in a medium with the aid of ultrasound waves has been
disclosed in [9]. The probe comprises two ultrasonic sensors (one emitting and another
receiving sensor) mounted into two vertical stands to detect the upper and lower levels of
the emulsion layer inside a laboratory-scale tank of 1 meter height. Both sensors move up
and down at the same horizontal level to provide information on the liquid within that
level. However the system is not suitable to operate in relatively higher tanks (i.e. more than
3 meters tanks, which is the minimum height of storage or separation tanks in oil fields).
One reason is that the electrical millivolt echo signal generated by the receiver ultrasound
sensor can barely reach the electronics located at the top of the tank if their separating
distance exceeds few meters. In addition, the system suffers from using relatively low
ultrasonic frequencies (i.e. less than 180 kHz) which affects the accuracy of the measurement
and prevents the device to detect relatively thin layers of sludge buildup commonly found
at the surface of the sensors after few operating days.
Interface Layers Detection in Oil Field Tanks: A Critical Review
191
In this book chapter, a new industrial prototype ultrasonic-based device, which overcomes
the above drawbacks, is presented. It does not contain any moving part and has been
demonstrated to effectively measure the emulsion levels, in addition to the amount of
water-cut (i.e. percentage of water in oil) within the emulsion layer. The probe operates in a
real oil field tank (e.g. a tank with a height equal to 4.35 m) by transmitting ultrasonic waves
at its different heights in a time multiplexer manner. An embedded expert system algorithm
is implemented in the transmitter situated at the top of the tank to find out if the fluid at the
height of the ultrasound transducer which is being activated corresponds to oil, water,
emulsion, or air. It uses as input features for the pattern recognition algorithm both the
delay and number of echoes whose amplitude exceeds a predefined threshold. The
determination of the water-cut within the emulsion layer is performed by an embedded feed
forward neural network algorithm. Experimental results in various conditions of
temperature showed a good accuracy for the detection of the emulsion layer and +/- 3
relative error for the computation of the water-cut within the emulsion layer.
3.1 Measurement principal and preliminary experimental setup
The measuring principle for measuring the position of the emulsion layer in the oil tank
consists to use a one dimensional array of high frequency ultrasonic sensors (i.e. 3 MHz
sensors have been used in this book). Each sensor of the array operates in transmit-receive
mode to emit horizontally burst of ultrasonic waves through the medium (i.e. oil, water,
emulsion, or foam) and then collects the received waves and convert them into electronic
signals for further processing. This latter task is performed by the transmitter, which is fixed
on the top of the tank, to measure the type of medium surrounding the actual sensor. By
similarly driving all the sensors of the array, a vertical profile of the oil tank can be deduced.
The usage of high frequency sensors, instead of low frequency is motivated by the fact that
usually the crude oil leaves a thin layer of undesirable sludge buildup on the surfaces. Thus,
a high resolution ultrasound imaging system is required to scale down to that small
thickness. This book chapter treats this common practical problem, which, to our
knowledge, has not been sufficiently tackled in the literature. Figure 11 shows the overall
hardware bloc diagram of the system. The array of ultrasonic sensors are hold in cuboid
boxes (two sensors per box) which are fixed to a vertical stainless steel bar though screws to
occupy the complete height of the tank (i.e. 4.35 m). A second vertical stainless steel bar
which is parallel to the first one by a separating distance of 5 cm is used as a reflector for the
ultrasonic sensors. The usage of stainless steel material is motivated by the need to avoid the
corrosion of the metallic bars which may lead to false measurements. One of the advantages
of the proposed system is that it is modular, since adjacent sensors are connected to each
other though a removable flexible stainless steel pipes which carry few electrical wires (i.e.
for carrying power supply and sensor signals: See Section 3). In addition, the system is not
invasive since the sensors are not in direct contact with the process liquid but protected with
circular glass. Prior to a detailed design of the electronic system and its pattern recognition
algorithm, a preliminary experimental setup was built to carry out the analog signals of each
sensor of the array under various conditions of temperature, sensor depth, and flow rate of
the mixed two phases liquid injected into the tank. The repetitiveness of the measurements
and matching the collected database with theoretical concepts were sought out of this
preliminary step of the design. In addition, the tightness of the sensor against any
penetration of the liquid into the electronics had to be investigated for different depths. This
Expert Systems for Human, Materials and Automation
192
is because the amount of acidity existing in the crude oil can easily attack the gaskets which
protect the electronics, especially under high temperature and pressure. Following extensive
experiments, it came out that the strongest epoxy can't sustain crude oil, whereas viton,
which has been selected, could resist up to 5 bars pressure and 75
0
C in contact with crude
oil. The designed device is inserted inside a thermostat regulated and pressurized column of
4.7 meters height. This would allow testing the instrument at even deeper depth (e.g. up to
45 meters for some oil field separator tanks) since this latest, h, is proportional to the
pressure, p (e.g.
). Two pumps are used to inject either water or oil, from two outdoor
storage oil and water tanks of 1 m
3
each respectively, towards the column creating an
emulsion layer inside it. The liquid formed in the column may also be carried out into a
separate storage tank under different flow rate, leading to a continuous testing with similar
conditions than in the oil field. The operational cycle can be described in the following way:
A pulse generator feeds each transmit transducer of the array under test with a sinusoidal
burst of a predetermined number of periods through a connection network. This process
continues for a predetermined number of times, where the acquisition is performed in a
coherent fashion by a high bandwidth oscilloscope (i.e. 500 Msamples/sec) which was
placed on the top of the tank (i.e. same connection points than the transmitter). The
measured data were presented to the remote PC over the RS485 serial interface. Figure 12
shows the reflection signals generated by one of the ultrasonic sensors of the array and
collected by the oscilloscope. Hence, several echo signals (more than seven in this case)
could be observed. The first high-amplitude signal which follows the transmitted pulse
however is not an echo signal but a reflection signal from the sensor’s stainless-steel casing.
Hence, a software delay of few
μs is performed by the transmitter in order to discriminate
this pulse from the real echoes. The removal of these latest is not required since it does not
belong to the region of interest (i.e. before the actual echoes start to appear).
Fig. 11. Hardware overview
Interface Layers Detection in Oil Field Tanks: A Critical Review
193
3.2 Feature extraction and pattern recognition algorithm
The discrimination between oil, water, and emulsion relies on a number of feature
descriptors, some of them being meaningful and the rest being redundant, if not properly
handled. The aim of this section is to highlight effects of some parameters on the ultrasound
waves and how they can complement each other to achieve accurate results with low
hardware complexity.
Fig. 12. Oscilloscope output displaying the echoes generated by one of the ultrasonic sensors
a. Effects of temperature and sensor depth in pure water and oil
As the experiments have to be carried out in outdoor where the temperature may vary
within a relatively high range (from 20ºC to 70ºC), the effect of temperature on the
ultrasound waves has been addressed. The speed of ultrasound waves (in [m/s.]) in water
increases with temperature according to the equation [10]:
23 2 3-1
12 3 4 5 6 7 8 9
() (35) (35) [s]cT a aT aT aT a S aZ aZ aTS aTZ m=+ + + + − + + + − + (7)
Where T, S, and Z are temperature in degrees Celsius, salinity in parts per thousand and
depth in meters, respectively. Where a
1
to a
9
are positive constants. However, in case of oil,
the speed of the ultrasonic waves decreases with the increase of temperature [11]. Therefore,
the detection of the emulsion layer in case of high temperature is easier since the delay tends
to be larger. A mixture of oil and water would 3provide a speed between the speed of pure
oil and speed of pure water. Consequently, knowing the actual temperature and salinity of
the liquid, together with the speed of the ultrasonic waves in the liquid, it is possible to
deduce the density of liquid using some well adopted pattern recognition algorithms. Figure
13 shows the effect of the temperature (from 20 to 85 ºC) on the delay for one of the
ultrasonic sensor of the array (i.e. sensor # 12). The delay here corresponds to the time it
takes for echo to cross 100 mV for the first time. From Figure 13, it can be deduced that the
delay can be used as one of the features for classification since it provides a clear
discrimination between pure oil and pure water at a given temperature. However, as it will
Time [x100
μ
s]
Expert Systems for Human, Materials and Automation
194
be highlighted in the next section, the computation of the water-cut may require the
consideration of more additional parameters since various combinations of oil-water
mixtures may lead to a same delay.
Water-cut [%]
Fig. 13. Plot showing the effect of temperature on the delay of the ultrasonic wave for one of
the sensor of the array [sensor # 12].
b. Effects of oil used
The type of oil used in our experiments is crude oil which is continuously injected into the
oil tank creating a significant emulsion layer of undefined water-cut. The effect of the water-
cut and the flow rate of the fluid carried out from the tank on the ultrasonic waves were
sought out of this phase of experiments. As shown in Figure 14, in case of bubbles of oil
(fluid2 in Figure 14) in water (fluid1 in Figure 14), the average delay of ultrasound waves (in
seconds) are expected to vary according to the equation:
12
2
(1)(2)
dd
Delay
Fluid Fluid
νν
⎡
⎤
=⋅ +
⎢
⎥
⎣
⎦
(8)
Where d
1
and d
2
are the path lengths traversed by the ultrasonic wave in Fluid 1 and Fluid
2 respectively and v(Fluid1) and v(Fluid2) the sound speed in Fluid 1 and Fluid 2
respectively. In addition, the reflected wave, Pr in Figure 14, may be damped by the
mixed fluid proportionally to its absorption coefficient,
α, which has the following
expression [12]:
3
2
f
c
π
μ
α
ρ
=
(9)
Where f is the frequency of the sound wave, μ the viscosity of the medium, ρ the density of
the medium, and c the velocity of the sound in the medium.
Interface Layers Detection in Oil Field Tanks: A Critical Review
195
Fig. 14. Ultrasonic waves reflections with the presence of large bubbles.
Figure 15 shows the water-cut function of the delay for two sensors of the array (i.e. sensors
#4 and 12) at 32
0
C. Hence, overall the delay follows a non linear increasing trend for both
sensors. Similar trend was observed for the peak to peak voltage of the ultrasound wave.
The usage of neural network technique for each sensor seems then to be a possible
alternative for the pattern recognition algorithm to determine the water-cut surrounding the
sensor. However, in some regions (points A and B in Figure 15), the delay is similar for two
different values of water-cut. The reason is due to the output flow of the liquid inside the
tank, which tends to move the ultrasonic wave in its direction, causing an extra delay. This
is the reason why additional information regarding the flow velocity, v, of the liquid carried
out from the column needs to be considered. This latest is function of the differential
pressure, ΔP, between two sensors fixed along the array as follows [14]:
2
2
Lf v
Ppgh
d
ρ
×××
Δ= + (10)
Where h is the distance separating the two pressure sensors, ρ the density of the liquid along
the column, f is the friction factor (e.g. a Moody friction factor calculated using known
roughness of an inner surface of the pipe), and d is the inner diameter of the pipe. The
solution adopted in this book chapter consists then to add two pressure sensors in the array
(i.e. in transducers 1 and 28 respectively), within which, the average density of the liquid is
also estimated. Figure 16 shows the plot of the velocity function of the differential pressure
for different fluid densities (ρ = 820, 910, and 950 kg.m
-3
). Hence, overall the flow velocity
follows the trend of equation 10. In practice, by using the pressure as additional input to
treat the regions which are similar to A and B, a compensation of the delay function of the
fluid velocity could be achieved.
Fluid
Bubble of Fluid 2
Ultrasonic
sensor
Pi
Pr
Pipe Wall