Expert Systems for Human Materials and Automation Part 10 doc
Bạn đang xem bản rút gọn của tài liệu. Xem và tải ngay bản đầy đủ của tài liệu tại đây (1.43 MB, 30 trang )
Hybrid System for Ship-Aided Design Automation
261
A database contains data about objects and systems, devices and automation components
from catalogs, or used on ships previously built. It can provide detailed information for
designer about the elements of the automation systems used on ships constructed, as well as
directory information on those systems and components.
Knowledge base system is the automation of selected elements of the project, which are
implemented by the expert system based on the domain model (without the use of
information on ships built). Based on the domain model can be made also an adaptation of
the project, which takes place when the database was not found enough to like or ship
found the ship has a relatively low similarity summary and the designer decides not to
match an existing project for the design of self based on a knowledge base.
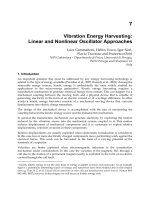
2.2 The hierarchical structure of automation
To achieve effective and transparent (formal) similar ships were searching the classification
structure of engine room automation, which is multilayered and includes the following
levels:
• the engine room
• systems
• objects
• control and measurement points.
ENGINE ROOM
SYSTEM A
CONTR. AND PR. ME
SYSTEM B
FUEL
SYSTEM C
LUBE OIL
OBJECT 141
SEPARATOR F.C.
OBJECT 130
BOILER BURNER
OBJECT 125
HEAVY FUEL
PUMP TRANS.
OBJECT 126
TRANSP. PUMP
DIESEL FUEL
C-M POINT B
300
START
C-M POINT B
301
STOP
C-M POINT B
302
WORK
C-M POINT B
303
REM. CONTR.
C-M POINT B
304
BREAKDOWN.
Fig. 2. The structure of design engine room automation on the example of fuel system
For the purposes of computer processing and editing of technical documentation
automation adopted a single, numeric encoding systems and facilities installed in a power
ships. However, automation components are encoded in accordance with international
standards. It was assumed that the selection of automation objects is realized within the
marine systems that, for most ships, are as follows:
Expert Systems for Human, Materials and Automation
262
• system control and protection ME,
• fuel system,
• lube oil system,
• fresh water system,
• a system of sea water,
• compressed air system,
• boilers and steam system,
• bilge system,
• power system,
• ballast system,
• other.
Different levels of this structure (for example, fuel system) are shown in Figure 2.
2.3 Algorithmization searches similar ships
To search for similar ships multiobjective optimization algorithm was used for the selection
of automation based on a hierarchy of similarity: the whole engine room, her ships systems
and objects designed (proposed) for the individual ships stored in the database. Tasks of this
algorithm are as follows:
• Search for similarity between the structures of automation,
• Optimizing cost and scope of automation.
In the first stage of the algorithm is sought in the structure of the ship automation most
similar like that described by the structure and number of elements present in the system
automation (structure and number of objects, sensors, etc.). By comparing the structure of
the automation of other ships built it to be classified in terms of fuzzy as: same, better or
worse. Finding the best engine room automation structure is based on the provisions
contained in the key project documents such as technical description and comparison of
measurement equipment.
In the second stage of the algorithm, based on the existing structure, searches in the
directories of the database systems and automation equipment, minimizing costs and
maximizing capacity factor (range) of automation for these costs. At this stage, looking for a
ship with a high density of automation possible with the relatively small cost - fuzzy
optimization criterion.
Optimization method used here is based on a hierarchical optimization successively
performed for all criteria.
• Arrange the criteria of importance (f
1
) to least important (f
M
)
• Find the optimal solution X
1
the primary criterion for f
1
and limitations
• Search for optimal solutions X
i
, i = 2.3 , , M relative to the other criteria for the
introduction of additional restrictions.
Keeping the cost calculation is done using two methods:
- using an estimate - in the initial stages of design based on the technical description and
a base price of standard.
- using the exact - in the later stages of the design is based on information from a
comparison of measurement and control equipment and bills of materials and details of
offers and contracts for the purchase of equipment automation.
Accepted calculation method is based on an estimate of costs based on price information
from the pre-built ships that are brought into the so-called. standard prices, ie price per unit
Hybrid System for Ship-Aided Design Automation
263
for a ship with a standard contract for the equipment. A detailed list of the equipment along
with the accepted price is the calculation of the cost of automation, which includes: an
integrated alarm system / control / monitoring, maneuvering control panel desktop, remote
control system ME, ME diagnostic system, generators, automation systems, pressure
transducers, pressure switches, thermostats, level sensors, temperature sensors, etc. The
criteria for the optimization algorithm includes:
- computing the minimum price
- the minimum delivery time
- maximum discount
- maximum warranty period
- the priority of the supplier or their lack of automation.
For determining the similarity of the ship used in the classical method of weighted profits.
In this method, the coordinates of the vector of profits - the partial similarities are
aggregated into a single function of income - a summary by the similarity transformation:
(( * )’)
is
is is
pg
ps sum mo m po
=
=
is
ws* ps ’
where
: pg
is
- similar summary automation of the whole ship,
ps
is
’- Column vector of similarities of partial automation systems [w
1
w
2
w
ip.
w
lp
],
w
ip
∈<0,1>and Σwg
ip
[i]=1,
mo - array of objects weighing individual systems
mpo
is
- matrix of similarities of objects of individual systems
is
- the ID of the ship,
*
- the dot product.
The project built the ship automation can be adopted without any change or be subject to
adaptation in accordance with the requirements of the designer of automation. Adaptation
of the project built ship can be achieved in two ways:
•
on the basis of other projects ships built,
•
model domain - based.
Adaptation based on other ships built projects takes place when the partial similarity
between the different systems of the ship similar (with the greatest similarity of the
summary) are smaller than the similarities of the individual systems of other ships.
Adapting model domain - based [3] takes place when the database did not find enough like
a ship or ship is found has a relatively low similarity summary and the designer decides not
to match an existing project for the design of self. At each stage of development envisaged is
the possibility of interference by the designer of automation.
3. Analysis of the similarity of the hierarchical automation engine room
3.1 Basics of calculating the similarity automation
The support system of the ship design automation similarity was related to characteristics of
ships built in the engine room. It is assumed that the solutions for the automation are subject
to certain features of the engine room in scheduled ship. Due to the large number of ships
taken into account the characteristics of similarity is defined, broken down by certain groups
of traits. The collection in question features (parameters) of the ships was divided into
subsets with respect to the entire ship propulsion, power, and the following marine systems
Expert Systems for Human, Materials and Automation
264
(installation): fuel, lube oil, fresh water, sea water, compressed air, boiler and steam system,
bilge, in ballast, and others. The results of calculations of similarities in these subsets are
defined as partial similarity. The study of similarity includes some parameters such as:
•
general information: type of ship, load, number of refrigerated containers, the number
of moving cars, the classification society, class automation
•
main propulsion (MP): The number of main engines (ME), type ME, power ME, ME
speed, the number of propellers, the type of propellers, the number of transmissions;
•
power plant: the number of sets PG1 type, the type of PG1, power PG1, PG1 speed,
number of sets PG2 type, the type of PG2, PG2 power, speed PG2, the number of shaft
generators,
•
the installation of fuel : the number of fuel valves, the number of fuel pumps, the
number of centrifuges, the number of filters;
•
bilge: number of valves, the number of bilge pumps.
To calculate the similarity of ships in the database application uses some functions of
similarity (rectangular, trapezoidal, triangular, Gaussian, with a lower limit), and the expert
system - fuzzy logic. The similarity of ships calculated in the database application is
forwarded to the system Exsys in tabular form. Along with the similarities and partial
summary of the database shall be the values of selected parameters on which the expert
system calculates the fuzzy similarities and looks similar ships.
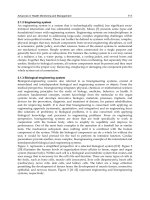
The system Exsys to the database are forwarded to the resulting maximum partial similarity
with the corresponding identifiers of ships and ship’s maximum aggregate similarity as the
sum of the partial similarities. On this basis, the system searches the database of the ship as
a ship like that.
Choice of
similar ship
Required
parameters
Parameters
of ships
built
Similarit
y
MP from DB
ME
p
ower
MP
similarity
MP fuzzy
similarity
ME s
p
eed
Similarit
y
EPP from
PG1
p
ower
EPP
similarity
EPP fuzzy
similarity
PG1 s
p
eed
Number of bi
g
e filters
Number of fuel filters
Auxiliary
systems
similarity
Auxiliary
systems
fuzzy
similarity
Similarit
y
of fuel
Similarit
y
of bil
g
e s
y
stem
Similarity calculation
in database
General similarit
y
from
Dis
p
lacement
General
similarity
General
fuzzy
similarity
Number of
Similarity calculation
in expert system
Fig. 3. Block diagram of a search for a similar ship in the database application and expert
system
Hybrid System for Ship-Aided Design Automation
265
Example of searching for a similar ship is shown in Figure 3, where: MP - main propulsion,
ME - the main engine, PG1 - generator of type 1, PG2 - generator of type 2.
The project on the basis of automation projects, other ships can be implemented:
•
based on a draft of the ship similar or ship chosen project,
•
by including the individual systems (objects) of ships built.
Maybe there is the adoption of the entire project before the ship was built (as a base project)
or its adaptation projects on the basis of individual systems and (or) objects of other ships
stored in the database.
Project base design can also be freely chosen by the designer of the ship built. In each
scenario using the base project can then be modified several times based on systems built by
other ships built in terms of both technical description and selection of equipment, such as
by changing the design of systems (objects) that originate from other ships or may be
supplemented and corrected by the addition of new and (or) removal of existing control and
measurement points.
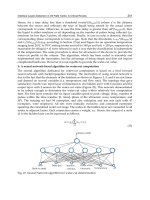
The search system or building automation built ship is carried out in two stages: the first
stage of the search is looking for entries for the system (object) on all ships stored in the
database, in the second stage, records are searched for the system (object) on the selected
ship. The result of each stage is displayed on the screen, giving the designer the opportunity
to review and compare the equipment of the system (object) to individual ships before the
final choice.
Network activities of this process is shown in Figure 4.
Does the project
Is the modification
of the project?
Is the end of the design?
N
N
The project base?
I
Select
shi
p
Transfer of technical
description.
Transfer the control
and measurement
e
q
ui
p
ment
Select your system
Select your ship
Select your object
OU
T
N
N
T
T
T
N
N
T
Is the designer of the
ship like that?
Fig. 4. A network activities of algorithm design engine room automation
Expert Systems for Human, Materials and Automation
266
3.2 Application of the similarity calculation functions of engine room automation
Functions of similarity is one of the most important element of case based reasoning
method. Functions presented in the literature of this type (with a similar use) relate to the
similarity collections without analyzing the similarity of the individual components. These
functions do not provide such a large room for maneuver for the designer in search of
similar ships, as proposed here functions of similarity. The fact that they may play a role
similar to that of fuzzy logic improves their usability for two reasons:
•
In database applications, ensure the implementation of fuzzy logic operators,
•
It gives the possibility of waiving the application of expert system and reduce support
automation for simplified variant (without the use of expert system).
The developed system of choice for calculating the similarity function depends on the
design task, as well as the expectations of the designer. These functions provide greater
flexibility in determining the ranges of values of the parameters input. Their selection
should result from the need to include greater or lesser number of similar ships, for example
for the similarity analysis of individual systems (installation). The designer may choose a
specific function or function can be automatically applied at both the preliminary design, as
well as in the selection process of automation.
The designer can specify the value of individual design parameters, as well as deviations
and standard percentage points lower and upper, which are converted into real values and
the limit of standard parameters. They may be of a symmetric, if their values are the same,
or asymmetric, if different. Determining lower or higher ranges of parameters, such as in the
design automation of the ship may be comfortable in a situation where the designer to adopt
a tolerance for technical parameters is looking for solutions to the most profitable from an
economic point of view, namely to the lowest price (with possible discounts and rebates) or
shortest time of delivery.
The similarity of the resulting parameter is obtained as a weighted similarity of this
parameter. The process of calculating the weighted similarities of each parameter is
terminated after taking into account all the input parameters of the ship, and their weighted
sum is a partial similarity of the MP. The sum of the similarities of partial similarity is the
weighted aggregate of the whole ship, under which ships are searched on.
Based on sample data, the proposed board and the data contained in the database of ships
built, as the ship is similar, the ship was named B500. The partial similarity of some ships
from the database are contained in Table 1.
Ship General sim MP sim EPP sim INST sim
Weighted
sum sim
B191 0,62 0,74 0,50 0,55 0,60
B222 0,15 0,33
0,70 0,75
0,48
B369 0,17 0,60 0,48 0,68 0,48
B500
0,90 0,78
0,55 0,73
0,74
B501 0,10 0,25 0,67 0,51 0,38
B683 0,13 0,56 0,68 0,50 0,47
B684 0,13 0,59 0,49 0,61 0,45
Table 1. The partial similarity of some ships
The partial similarity of the ship were calculated similar to the values of weights for each
group of parameters, which was adopted by the arbitrary decisions of the designer on the
basis of his experience (Table 2).
Hybrid System for Ship-Aided Design Automation
267
Kind of similarity
Weight of the
parameter
Weighted value
of the similarity
GENERAL SIM 0,1 0,09
MP SIM 0,4 0,312
EPP SIM 0,3 0,165
INST SIM 0,2 0,146
Table 2. Partial similarities of the similar ship
Partial similarity of the greatest value from a variety of ships (B500, B222) are shown in
Table 3.
Kind of similarity Ship Weighted value of the similarity
GENERAL SIM B500 0,09
MP SIM B500 0,312
EPP SIM B222 0,21
INST SIM B222 0,15
SUM SIM B500 0,76
Table 3. The biggest partial similarity
4. Application of selected methods for calculating the similarity
4.1 In the expert system and database application
Detailed analysis of selected methods for calculating the similarity between the ships was
limited to the example of MP computer-aided design as an element of partial whole system,
from which depends largely on ship engine room automation design.
The primary function of the system is developed to search a database of similar ships, which
number may be quite varied and range from one up to several dozen ships. This is based on
the applied similarity function, as well as the size and content of the database and assumed
design parameters, such as ranges and thresholds of similarity functions. These parameters
are determined by the designer before starting the search process similar ships. Next, data
are required for the proposed ship. Then begins the process of calculating the similarity
between the various parameters, including power and speed of the ME, then the similarity
of the functions of the threshold. This process can be launched by the designer at any time
and anywhere via the form shown in Figure 5.
MP partial similarity is calculated based on the similarity of number fields ME and non-
numerical creating similar comprehensive MP. At this stage the table is created with the
data of both source and calculated the similarities in the database application for Exsys
(click for Exsys), on the basis of which similarities are calculated fuzzy.
In addition to calculating the similarity of ME in the database using the method of fuzzy
logic in the expert Exsys system. This method was used to calculate the similarity between
the parameters of the proposed board and the same parameters of individual ships built, as
well as the similarity of other parameters of a numerical transferred from the database.
Application of fuzzy logic analysis of several examples (P1-P5) of design capacity and speed
of the ME, and the results (weighted) for the calculation of similarity and prediction similar
ships Exsys by the system shown in Table 4. In the case of a database of many ships of the
same value of similarity in the table was placed first found a similar ship.
Expert Systems for Human, Materials and Automation
268
Fig. 5. Menu for calculating the similarity of ships on the example of the control system ME
Exemple
Designed
power
Designed
speed (rpm)
Number of
similar
ships
Values of
maximal
similarity
Similar
ship
power
Similar
ship speed
P1
16200 107 3 0,6286 18160 110
P2
11400 110 20 0,6286 10800 118
P3 6600 150 1 0,8 6650 154
P4 11000 120 38 0,6286 13050 124
P5 17000 500 3 0,45 17400 530
Table 4. The results obtained in the similarity of MP Exsys system
Some examples have been found one (P3) or three (P1, P5) ships with a maximum similarity
weighted summary, but sometimes also the number of ships with the same value of
similarity is very high, eg in the P4 - 38, and P2 – 20.
For example, P2 analyzed the results concerning the maximum similarities ships Exsys
calculated in the system using fuzzy logic, and calculated by using various functions in the
database application using the sample (different) value deviations. Results for the three
variants of border and standard deviations, respectively: [20.10] [40.20] [40.30] is shown in
Table 5.
If the function of the lower bound and fuzzy logic in all three variants are the same values
for the number of ships and the maximum value of similarity. For a rectangular function
of deviations are negligible. For the triangular function is important to limit slippages
value only because, by definition, the value of standard deviation is zero. For the
Gaussian function increases in value and standard deviation limits search results more
similar ships.
Hybrid System for Ship-Aided Design Automation
269
Table 5. The number of ships with the highest value of similarity according to particular
functions in the database application and Exsys system
Trapezoidal function
Gaussian function
Triangular function
Function with lower
limit
Exsys
Fuzzy logic
∆P
D
i
∆P
G
%
∆O
D
i
∆O
G
%
Number of
ships with
maximal
similarity
Value
weighted
similarity
Number of
ships with
maximal
similarity
Value
weighted
similarity
Number of
ships with
maximal
similarity
Value
weighted
similarity
Number of
ships with
maximal
similarity
Value
weighted
similarity
Number of
ships with
maximal
similarity
Value
w
eighted
similarity.
20
10
10
0,50
2
0,36
3
0,37
40
20
33
0,50
3
0,46
40
30
54
0,50
6
0,48
5
0,43
3
0,48
20
0,63
Expert Systems for Human, Materials and Automation
270
In the case of trapezoidal function with increasing values of deviation limits (lower and
upper) and standard deviations of a growing number of ships, the most similar, with a
maximum value of similarity is not changed, and for the analyzed case is 0.50. Keystone
function in this respect is similar to fuzzy logic.
The number of ships of similar products using fuzzy logic is, in some cases very large, for
example in Example P4 fuzzy logic method has been found up to 38 ships with a maximum
value of similarity. Such a large number of similar ships is recognized in the membership
function, which may involve some ranges of a large number of ships included in the
database, while others will be limited to just one or several ships. Is dependent on the
contents of a database - the types of ships in it are stored.
Mostly due to the use of fuzzy logic will be found to be a lot of ships with the highest value
of similarity to the design ship. This method can therefore be applied to the initial
classification of ships in the first stage of their search. Reduction of an excessive number of
search ships may provide placement in a database or limit your search to the ships of the
same type, for example, only the container [5].
4.2 In the neural network
The similarity of MP ships calculated in the application database and expert system can also
be verified using the neural network with back-propagation of error, which was
implemented in Visual Basic for Access, and can be used for any number of input and
output parameters in the form fields database table [6]. In applications of neural networks is
required to have numerous possible training set. Research results presented below are based
on a set of hundreds of ships constructed. In studies that sought power dependencies, and
then the engine speed from the main input parameters such as load capacity, length and
width of the ship, its immersion and speed.
The calculations used a two-layer network with continuous unipolar activation function and
the classical backward error propagation algorithm for weight change. The collection ships
were divided into two subsets: learning and testing. To a set of testing randomly selected
25% of ships. All parameters of ships before the calculations were normalized to the range
[0,1]. In this case, a computational cycle consisted of an introduction to the network input
parameters of all the ships in succession from the training set. Completion of the network
training followed when the mean square error in the cycle ec received less than the desired
value. This error is related to the difference between the actual power of the ME and the
power calculated by the network for the same ship.
The developed algorithm with the backward propagation of errors used for the selection
of power and speed of the ME, is essential to select the database and table from which the
field adopted as parameters for the network, resulting in a recall of relevant data for
review.
After determining the number of cycles and the initial error value, as well as learning rates
η
1
and correction
η
2
is started learning network. The results obtained with the neural
network are stored in a separate box “Calculate” the source table.
The values of all parameters of the network learning algorithm are introduced via the form
shown in Figure 6.
In the process of network learning, consider the following problems:
1.
selection of training set of sufficient size,
Hybrid System for Ship-Aided Design Automation
271
2. determination coefficients
η
1
as the learning rate and
η
2
as a correction factor weights,
3.
definition of learning time.
Power
Count
Count
Fig. 6. Form to enter parameters of neural network
It is important to the skilful selection of learning rate
η
1
[14], which has a huge impact on the
stability and speed the process.
η
2
coefficient is multiplied by a back propagated error and
is responsible for the speed of learning. Too little value for this parameter makes the
learning and convergence of networks is very slow, taking too much of its value the process
of searching the optimal weight vector is divergent and the algorithm may become unstable
[16].
η
2
coefficient is multiplied by the rate of change of weights in the previous step,
“smoothing” too abrupt jumps connection weights.
η
2
values should be selected on the basis
of a compromise, so that further increases in weight accounted for a small portion of their
current values (eg, several percent).
Selected examples of the use of neural network algorithm developed in the selection by the
ME, based on size, load and speed of the ship shown in Table 6.
Research on selection of power ME on the basis of other design parameters, mainly the
dimensions of the ship was carried out for example the number of cycles in the 100 - 30000,
50000 and even at the values of coefficients
η
1
and
η
2
equal 0.9 and 0.6 respectively and the
values in the range 3 - 0.1 and 1 – 1.
In most cases, adopted the option of reducing the value of learning rates, which resulted in
obtaining an average error within the limits: 0.034 - 0.06. In other cases, they applied the
same values of coefficients, which contributed to the growth of average error, with a small
number of cycles up to a value equal to 0.1. In one case, used to increase the value of
coefficients, and the resulting average error does not differ from previous values.
Power
Calculate
Integer
Integer
Integer
Expert Systems for Human, Materials and Automation
272
The values of coefficients
Output
parameters
Number
of cycles
Number of
input
parameters
η
1
η
2
Learning
time
[min]
Average
error
1000
5
0,9 0,6 1 0,06
10000
5
0,9 0,6 7 0,04
30000
5
0,9 0,6 13 0,037
50000
5
0,9 0,6 20 0,034
1000
5
0,1 0,1 0.5 0,1
2000
5
1 0,1 1 0,05
Power of
ME
4000
5
0,1 0,1 2 0,05
Table 6. The results of neural network algorithm developed
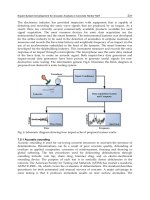
Results of neural network for the number of cycles = 30000 are shown in Figure 7.
0,00
5 000,00
10 000,00
15 000,00
20 000,00
25 000,00
1 1019283746556473 8291100109118127136
Numbers of ships
kW
Pow e r
Calculated pow er
30000 cycles
average error = 0,037
Fig. 7. Results of neural network for the number of cycles equal to 30,000
For comparison of these results was a test for the selection of neural network by ME,
performed on a set of ships with a capacity of ME >13,000 kW and < 25,000 kW, as shown in
Figure 8.
3000 cycles
0
5000
10000
15000
20000
25000
30000
1 6 11 16 21 26 31 36 41 46 51 56 61 66 71
Numbers of ships
kW
Power
Calculated
power
Fig. 8. The results of network training for a selected set of ships
Hybrid System for Ship-Aided Design Automation
273
The results of developed methods for calculating the similarity to support preliminary
design of the ships used for the selection of main engine power, are summarized in Table 7.
When searched the database under the ME value of ships for various functions for
calculating the similarity is identical to the draft national (case 2, 3, 4, 6) - Tab. 7. results
obtained with neural networks are worse. There is therefore no need to verification by the
network, which is applicable in case you did not find enough similar vessels using the
methods of calculating the similarity in the database application (cases 1 and 5) - Tab. 7.
Then there is the process of verifying these results using neural network.
ME Power of a similar ship
ME power
design ship
with the lower
bound
method
with the
Gaussian
function method
with the function
of the trapezoidal
method
with a
triangular
function
neural
network
4350 4350 4350 4350 4350 2503
5500 5500 5500 5500 5500 5043
7400 7400 7400 7400 7400 7250
8043 4800 8048 8048 8048 6537
11100 13050 13050 12960 13050 11191
12000 10800 10800 10800 10800 11153
13050 13050 13050 12960 13050 12900
13700 13700 13700 13700 12960 13500
Table 7. Values of main engine power of ships like those obtained by using various
functions
Comparison of sample results obtained on ships built in - the power values of the largest
ships ME similarity in table 7 presents a chart (Figure 9).
Co mpari son of si m i l a r shi ps ME
0
2000
4000
6000
8000
10000
12000
14000
16000
0 2000 4000 6000 8000 10000 12000 14000 16000
The resulting power
low er bound method
Gaussian method
trapezoidal method
triangular function
neural netw ork
the
proposed
power
Fig. 9. Graphical comparison of ME under similar ships built according to different methods
of calculating the similarity
Expert Systems for Human, Materials and Automation
274
From the presented examples show that various methods of calculation obtained similar
values under the most similar ships are not always close to the power set of the proposed
ship. This follows from the fact that similar ships are searched on the basis of similarities
summary of all input parameters. An important role is played to determine the appropriate
weight values of parameters, as well as test the limits of the ranges and their deviations.
Similarity analysis was based on different types of ships built. We analyzed the results in the
selection by the ME derived from the neural network. Differences similarities obtained
using the various functions may be due the following reasons:
•
highly diversified structure of the test set of ships in the database (different types,
dimensions, purpose),
•
too small a collection of ships in the database, which affects the results obtained with
neural network.
5. Summary
The design engine room automation is often used similar design features of ships, since it
constitutes the final design phase, in which there is a need to consider a wide range of
information by the designer of automation in a relatively short time. Hence, the developed
computer-aided design system, engine room automation was considered purposeful use of
the CBR methodology, based on the similarity of the cases we present in detail the example
of computer-aided design of the main propulsion.
Design automation system developed in the engine room can be implemented in various
forms:
•
Based on the partial similarities: general, main propulsion, power stations, selected
installations (fuel and bilge) and the similarity of the entire ship as a weighted sum of
partial similarities are searched in a database similar ships. Searching is done using the
methods of calculating the similarity in the application database and fuzzy logic, which
was used to calculate the similarity of the selected parameters of the ship, as well as
partial similarities computed in the database.
•
In the absence of similar arrangements in ships constructed for the possibility of self-
design by a designer using the model elements of subject, which can serve both to
adaptation and self-realization of the project by the designer of a similar ship.
•
Multi-criteria optimization for the selection of automation based on a hierarchy of
similarity: the whole power, its systems and objects, in case you find other similar ships,
or arbitrary decision of the designer.
The developed hybrid system allows you to convert knowledge into formal rules,
contributing to significant improvements in the efficiency of the design process engine room
automation. Along with the application of the database is a tool to assist in the design
process much automation in the most labor-intensive activities, it allows even the number of
times (from several weeks to several days) to shorten the process of selecting the elements of
automatic control and measurement points in the statement of apparatus, which has been
confirmed by Experts in the practical implementation of this project document on the
example chosen ship built. The application was created using Access database management
system in collaboration with Exsys expert system, it also performs a complementary role for
the expert system, providing the designer with the details and elements of the automation
systems used on ships constructed, as well as directory information about these systems.
Hybrid System for Ship-Aided Design Automation
275
Usefulness and effectiveness of the search algorithm developed similar ships was confirmed
in the developed computer-aided design system, engine room automation, which provides
for the implementation of the multilevel structure of the automation.
Used, the system developed, the methodology for determining similarity of ships for the
purpose of design provides a better measure of similarity, giving the designer a choice of
similarity function according to the requirements and nature of the analyzed parameter.
These features, functioning as a filter, help to increase flexibility in design automation,
where often the technical parameters are accepted more or less tolerant because of the
economic criteria of the project, as applied multi objective optimization algorithm, in case
you find other similar ships on the basis of parameters general fitness, looking for a ship
with a high density of automation possible with a relatively small cost of using a fuzzy
criterion of optimization.
6. References
AAMODT A., PLAZA E.: Case-Based Reasoning, Foundation issues, methodological
variations, and system approaches. Artificial Intelligence Communications, 1994,
Vol, 7, No, 1, 39-59.
BOSE A., GINI M., RILEY D.: A case-based approach to planar linkage design, Artificial
Intelligence in Engineering 1997, No 2, Vol 11.
BROUWER R.K.: A feed-forward network for input that is both categorical and quantitative,
Neural Networks 2002, No 15.
CALLAHAN E.: MS Access 2002. Visual Basic, Microsoft Press, Warsaw 2000.
CLAUSEN H.B., LUTZEN M., FRIIS-HANSEN A., BJORNEBOE N.: Bayesian and neural
networks for preliminary ship design, Marine Technology 2001, No, 4.
DOBSON R.: Programming MS Access 2000, Microsoft Press, Warszawa 2000.
DONGKON LEE, KYUNG – HO LEE. An approach to case-based system for conceptual
ship design assistant, Expert Systems with Applications 16, 1999.
HEIAT A.: Comparison of artificial neural network and regression models for estimatingh
software development effort, Information and software Technology, vol, 44, 2002,
911-922.
KORBICZ J., OBUCHOWICZ A., UCIŃSKI D.: Artificial Neural Network, Fundamentals
and applications, Academic Publishing House, Warsaw 1994,
KOWALSKI Z., MELER-KAPCIA M., ZIELIŃSKI S., DREWKA M.: CBR methodology
application in an expert system for aided design ship’s engine room automation,
Expert Systems with Applications 29, 2005, 256-263.
LEE D., LEE K., H.: An approach to case-based system for conceptual ship design assistant.
Expert Systems with Applications,16 (1999).
MELER-KAPCIA M., ZIELIŃSKI S., KOWALSKI Z.: On application of some artificial
intelligence methods in ship design. Polish Maritime Research 2005 no 1.
MELER-KAPCIA M. Algorithm for searching out similar ships within expert system of
computer aided preliminary design of ship Power plant. Polish Maritime Research
2008 no 3.
RUTKOWSKA D., PILIŃSKI M., RUTKOWSKI L. Neural networks, genetic algorithms and
fuzzy systems, WN-T, Warsaw 1999.
TADEUSIEWICZ R.: Neural networks. Academic Publishing House, Warsaw 1993,
Expert Systems for Human, Materials and Automation
276
USER MANUAL EXSYS Professional - Expert System Development Software,
MULTILOGIC, May 1997.
ZAKARIAN V.L., KAISER M.J.: An embedded hybrid neural network and expert system in
an computer- aided design system. Expert Systems with Applications, Vol 16, 1999.
15
An Expert System Structured in Paraconsistent
Annotated Logic for Analysis and Monitoring
of the Level of Sea Water Pollutants
João Inácio Da Silva Filho, Maurício C. Mário, Camilo D. Seabra Pereira,
Ana Carolina Angari, Luis Fernando P. Ferrara,
Odair Pitoli Jr. and Dorotéa Vilanova Garcia
Santa Cecília University,
Group of Research in Applied Paraconsistent Logic,
Brazil
1. Introduction
This chapter presents the development of a Expert System which was elaborated based on
the Fundamentals of Paraconsistent Annotated Logic and aimed to help in the process of
detection of physiological stress in organisms exposed to water pollution. The
Paraconsistent Logic is a non-classical logic present as their main characteristics the
acceptance of the contradiction in their structure. It is presented in this study the algorithms
extracted from a type of Paraconsistent Logic nominated Paraconsistent Annotated Logic
with annotation of two values PAL2v that are capable of simulating the applied
methodology in Biology known as a neutral red retention assay. This method of biomarkers
prepared with specific procedures has the goal of finding rates of exposure to marine
pollution through the manipulation and study of cells from mussels. It was built a
configuration of Paraconsistent Artificial Neural Network (PANN) composed of algorithms
based on the principals of Paraconsistent Logic to compose the Expert System with the goal
of simulating the biological method and help in the presentation of the cellular response.
The process of analysis elaborated by the software consists of making a comparison with
pre-established patterns through the Paraconsistent Network by biochemical/biological
processes consolidated in the biology area and defined in the scope on the mussels cells’
measures that presented determined behavior and biochemical reactions, as it is the
biomarker of exposure and effect of marine pollution in the site of the samples collection.
With this new approach of results, besides complete, they are presented as being more
efficient by decreasing the points of uncertainty given by simple human observation. This
way this work opens new fields for research of application of Artificial Intelligence
techniques in the analysis and monitoring of the Marine Pollution.
2. The pollution problem
Used as man’s source of food, raw material source and, afterwards, as a means of
transportation, the oceans occupy practically 71% of the earth surface [NASCIMENTO et al
2002]. Nowadays, half of the world population is located in cities by the coast or in nearby
Expert Systems for Human, Materials and Automation
278
regions. As a consequence of this, the marine environment, mainly coastal, ends up being
affected by the debris of the human population, bringing up the difficult problem of marine
pollution. In Brazil, there are two types of prior actions of pollution that reach more than 8
thousand kilometers of coast [NASCIMENTO et al 2002]. The first type is the marine and
coast contamination from sewage and garbage, whose environmental and social
consequences are felt instantly. Besides that, there is the sediment discharge in rivers
coming from the deforestation and bad usage of the soil that also contributes to the increase
of contamination in coastal areas. The second type involves the contamination from
chemical polluents, mainly hydrocarbonates of petroleum and other persistent organic
components and trace metals.
2.1 Polluents
It is known that the problem with pollution is associated to the characteristics of toxicity,
persistency and bioaccumulation of substances linked to matters of social and economical costs
[SOS TERRA VIDA 2005]. Among the groups of potentially damaging substances to the
marine environment there are the ones classified as domestic sewage, petroleum and
derivatives, trace metals, radioactive and organochloride materials. Among these, the domestic
sewage is the biggest problem worldwide, being a volume of polluent material as well as
related to concrete problems that cause public health damage. Relating to petroleum and
derivatives, which are a basic energetic resource for our civilization, the pollution is a
consequence of the huge volume transported and produced annually. They are stable and
persistent and they cannot be degraded or destroyed by any biological or chemical process.
The insertion of heavy metals in the oceans is mainly due to the industrial effluents in coastal
areas. The radioactive materials, that are also a polluent source in the marine environment, are
a consequence of decades of radioactive dejects that were settled or stocked in an inadequate
way when produced by the nuclear industry. The organochlorides are very stable organic
components, not much soluble in water, but very soluble or associate in lipids; therefore, they
are easily bioaccumulated in organic structures. These components are widely disseminated in
the ecosystems and their toxic effects may cause hepatic disturbance and affect the
immunological and reproductive system of aquatic organisms.
2.2 The biomarkers for environmental diagnosis
The cell structures can be biochemically affected in the presence of sub lethal polluent
concentrations, non stabilizing the internal balance of the cell [NICHOLSON, 2001]. These
biological effects cause organic damage in species that act in a lasting and persistent way
because the mechanisms of adaptation to the modified environment suffer from exhaustion
and cannot stimulate the perfect functioning of the systems anymore, which leads the
organic structures to death.
Through the usage of sensible biomarkers, a previous detection of stress in sub lethal levels
in aquatic organic structures may help in the evaluation and environmental diagnosis before
several changes reach the ecosystem. Some efficient and practical techniques that are
already adapted to the local sensible organic structures are available for application in the
monitoring of marine pollution.
3. Evaluation techniques for marine pollution
One of the biological procedures that employ biomarkers to assess marine pollution through
de determination of physiological stress in by evaluating the integrity of lysosomal
An Expert System Structured in Paraconsistent Annotated Logic
for Analysis and Monitoring of the Level of Sea Water Pollutants
279
membrane is named Neutral Red Retention Assay [NICHOLSON, 2001]. This method
consists in evaluating the environmental conditions and the bioavailability and effects of
contaminants through the analysis of the biochemical and cellular answers of the local
species before the animals suffer effects physiologically irreversible, reaching populations or
even ecosystems. It can be verified that the toxicity of industrial effluents, the quality of the
water and sediment in coastal ecosystems, the level of stress suffered by organic structures
due to alterations in environmental conditions and the effect of substances or mixtures
(synergism, addiction or antagonisms) having as variable the concentrations or time of
exposure of these components.
3.1 Organism- test
The mussel used in the neutral red test for this procedure is the Perna perna, an organism of
easy collection, with a bentonic habit that, for being sedentary and filter-feeding, it is
potentially more subject to the action of toxic agents. Besides, these bivalves are tolerant for
polluted environments; therefore, they accumulate in their tissues toxic substances that can
be harmful to their own survival [KING, 2000].
The haemocytes of Perna perna showed the ability of discriminating impacted and non
impacted areas through the integrity test of lysosomal membranes being able to be used as a
quick and sensible biomarker in the detection of stress of beings as it is possible to have a
correlation with chronic sub lethal effects.
3.2 Method of Neutral Red retention
The method used for analysis of time of retention of the neutral red dye [NICHOLSON,
2001] in haemocytes lysossome is described by Lowe [LOWE et al, 1995] as follows:
Using a hypodermic syringe of 2ml having 0,5ml of physiological solution, it is collected 0,5
ml of haemolymph of the posterior adductor muscle of the mussel. The content of the
syringe is transferred to tubes of micro centrifuge of 2ml where it will be smoothly
homogenized. 40 μl of this solution is put on a tube (haemolymph + physiological solution)
over the surface of a slide treated previously with poly- L-lysine. These slides are incubated
for 15 minutes in a dark and humid chamber. After the time of incubation, it is put over the
slides 40 μl of solution of Neutral Red (NR). It is necessary 15 minutes more of incubation in
the dark and humid chamber before starting the observations. In the first hour, the slides are
examined every 15 minutes and in the second hour they are examined every 30 minutes.
The final observation is performed after 180 minutes of exposure.
The NR retention time is obtained by the estimative of the proportion of cells showing
liberation of dye for citosol and/or showing abnormalities in size, shape and color of
lysosomes. At each time, the conditions are written down on a chart. It is important to
point out that the slides must be observed on the microscope in the shortest time possible.
This is to assure the consistency in the exam and because the neutral red is photosensitive.
Once the lysosomes are responsible for the cellular digestion and gather a high
concentration of contaminants, the destabilization of the lysosomal membrane in
haemocytes exposed to expect environmental contaminants are affected faster by the toxin
of the dye than healthy cells. Therefore, the necessary time to happen extravasations of
Neutral Red dye for the citosol may reflect on the state of integrity on lysosomal
membrane and this can be used as an indicator of exposure to conditions of
environmental contamination [KING, 2000].
Expert Systems for Human, Materials and Automation
280
3.3 Presentation of results of the method of Neutral Red retention
The healthy haemocytes are bigger and present an irregular shape and once exposed to
Neutral Red, the lysosomes can be seen as pink tinted small dots joined and the nucleus can
be seen as a colorless sphere as the citosol [KING, 2000]. Stressed haemocytes tend to be
spherical and smaller having bigger and darker lysosomes and citosol may be pink tinted
because of the dye contained in the lysosomes. So, the criteria analyzed when observing the
slides would be:
Criteria Healthy Cells Stressed Cells
Cells shapes
irregular rounded
Cells sizes
large smaller
Number of lysosomes
many few
Size of lysosomes
small Enlarged/ increased
Color of lysosomes
Pale red/ pink Red or dark pink, orange, brown
Pseudopodes
Non visible visible
Dye leak from cells
Non visible visible
Table 1. Criteria evaluated
When more than 50% observed cells do not present sign of stress, it is used positive sign + in
the table field according to the animal examined. When the cells present some sign of stress,
the sign +/- can be used. The analysis finish when 50% of the cells or more show abnormal
structure or dye leak for citosol and the negative sign – is used on the table [KING, 2000].
Time(minute)
Organic Structures
15 30 45 60 90 120
Control + + + + + +
Little stress + + ± ± - -
A lot of stress ± - - - - -
Table 2. Table of results
4. Application of Paraconsistent Logics in the simulation of the technique of
the method of neutral red retention
As shown on tables 1 and 2 in the method of neutral red retention, the procedure of
identification of cells that present or not signals of stress is performed through systematic
observations on the slides in an objective way and totally dependent on the Observer. This
way of collecting data is subject to a high level of uncertainty to the biological method
described. This way, it can be used techniques for the treatment of uncertainty with the goal
of getting better results of efficiency of the method.
Recently, multiple theories and techniques of treatment of uncertain signs are being
developed in Artificial Intelligence applying non-classic logics in the most varied areas
[ABE, 1992] [DA COSTA et al, 1991]. The Paraconsistent Logic is a non-classic logic that has
an important characteristic of presenting as a main advantage the capacity of treating
appropriately contradictory information and, in some cases, there are significant advantages
relating to the binary classic logic [DA SILVA FILHO et al, 2010]. In this work is used some
An Expert System Structured in Paraconsistent Annotated Logic
for Analysis and Monitoring of the Level of Sea Water Pollutants
281
Algorithms extracted from Paraconsistent Annotated Logic that are interlinked in a
Network of Paraconsistent Analysis [DA SILVA FILHO, 1999]. Thus, the Expert System uses
the techniques of adequacy of these Networks to detect the level of pollution in the sea
through the information obtained by the biological method that promotes the neutral red
retention assay for the analysis of images in blood cells of mussels. There is a brief
description of Paraconsistent Annotated Logic below and the algorithms that will be used in
the Expert System.
4.1 Paraconsistent Annotated Logics
The Paraconsistent Annotated Logics are classes of Paraconsistent Logics that have a lattice
associate and were introduced for the first time in programming logic by Subrahmanian
[SUBRAHMANIAN, 1987]. The methods for treatment of uncertainty here presented use the
fundamentals of an extension of Paraconsistent Annotated Logics named Paraconsistent
Annotated Logic with annotations of two values (PAL2v) [DA SILVA FILHO, 1999] in
which the principals are presented as follows.
4.2 The lattice associated to Paraconsistent Annotated Logic with annotation of two
values
In Paraconsistent Annotated Logics PAL the proposed formulas come with annotations.
Each annotation, belonging to a finite lattice
τ
, attributes values to its propositional
corresponding formula [DA SILVA FILHO, 1999]. To obtain a bigger Power of
representation about the annotations, or evidences, it is expressed the knowledge about a
proposition, it is used a lattice formed by ordered pairs, such as:
τ = {(μ, λ)| μ, λ 0, 1 }.∈⊂ℜ
⎡⎤
⎣⎦
In which case, it is fixed an operator ~: |τ| → |τ| where; ~ has the “meaning” of logic
symbol of negation ¬ from the system that will be considered.
If
P is a basic formula, the operator ~ : |
τ
| → |
τ
| is defined as:
~ [(
μ
,
λ)]
= (λ
,
μ)
where, μ
,
λ
∈ [0, 1] ⊂ ℜ.
It is considered then:
(μ
,
λ): An annotation of P.
P
(
μ
, λ)
: P where the levels of favorable and unfavorable Evidence compose an Annotation
that attributes a logical connotation to Proposition
P.
This way the association of one annotation (
μ, λ) to a proposition P means that the Degree of
Evidence
favorable in P is μ, while the unfavorable Degree of Evidence, or contrary, is λ.
Intuitively, in such lattice we have:
P
(
μ
, λ)
= P
(1, 0)
: indicating ‘existence of total favorable evidence and null unfavorable
evidence’, attributing a connotation of
Truth to P proposition.
P
(
μ
, λ)
= P
(0, 1)
: indicating ‘existence of null favorable evidence and total unfavorable
evidence’, attributing a connotation of Falseness
to P proposition.
P
(
μ
, λ)
= P
(1, 1)
: indicating ‘existence of total favorable evidence and total unfavorable
evidence’ attributing a connotation of Inconsistency to
P proposition.
P
(
μ
, λ)
= P
(0, 0)
: indicating ‘existence of null favorable evidence and null unfavorable
evidence’, attributing a connotation of Indetermination to
P proposition.
Expert Systems for Human, Materials and Automation
282
Fig. 1. Lattice associated to Paraconsistent Annotated Logics of annotation with two values
PAL2v.
Through linear transformation in an unitary Square in a Cartesian Plan and the lattice
represented by PAL2v we can reach the transformation [DA SILVA FILHO et al, 2010]:
(x,
y
)( , 1)Txyxy=− +− (1)
Relating the components of the transformation
T(x, y) according to the usual terminology of
PAL2v, as:
x =
μ
favorable Evidence Degree
y = λ unfavorable Evidence Degree
The first term obtained in the ordered pair of the equation of transformation (1) is:
xy
μ
λ
−=−
which we name Certainty Degree
D
C
. So, the degree of certainty is obtained by:
C
D
μ
λ
=−
(2)
And its values, that belong to the set
ℜ, vary in a closed interval +1 and -1 and are in the
horizontal axle of the lattice, which is named “Axle of the Degrees of Certainty”. When
D
C
result in +1 it means that the logic state resulting in the Paraconsistent analysis is True t, and
when
D
C
result in -1 it means that the logic state result in the analysis is False F.
The second term obtained in the ordered pair of the equation of transformation that is:
11xy
μλ
+−= +−
which is named Contradiction Degree
D
ct
. So, the Degree of Contradiction is obtained by:
1
ct
D
μ
λ
=+− (3)
And its values, that belong to the set
ℜ, vary in the closed interval +1 e -1 and are in the
vertical axle vertical of the lattice, which is named “Axle of the Degrees of Contradiction”.
When D
ct
result in +1 means the logic state of analysis is the Inconsistent F, and when D
ct
result in -1 meaning that the logic state resulting in the analysis is Indeterminate ⊥.
In practice the values of the Degrees of Evidence μ and λ they are obtained of sources of
information of the physical world through Interval of Interest, or Universe of Discourse,
with units of physical greatness of normalized values. As the Degrees of Evidence are
An Expert System Structured in Paraconsistent Annotated Logic
for Analysis and Monitoring of the Level of Sea Water Pollutants
283
independent, and whose values belong to the Set of the Real numbers, where they can vary
in the interval between 0 and 1, then infinites logical states ε
τ
are formed in the Lattice of
LPA2v. The Paraconsistent Logical states are presented as:
()
,
Cct
DD
τ
ε
=
The result related to the Degree of Certainty D
C
can be normalized becoming a Degree of
Evidence that allows to be used as input for other LPA2v Algorithms. In that way, several
propositions P1, P2, can be analyzed through a a Network of Paraconsistent Analyses. The
transformation of the Degree of Certainty in Degree of Evidence is made by the equation:
()1
2
R
μλ
μ
−+
=
(4)
Were:
μ
R
Resulting Evidence Degree
μ
Favorable Evidence Degree
λ Unfavorable Evidence Degree
As example is considered the situation in that the measures made in the physical world
present the following results:
μ = 0.89 and λ=0.28
Then the Degrees of Certainty and of Contradiction they are calculated by the equations (2)
and (3), respectively:
D
C
= 0.89-0.28 = 0.61
D
ct
= 0.89+0.28 -1 = 0.17
The Resulting Evidence Degree is calculated by the equation (4):
µ
R
=0.805
Fig. 2. Paraconsistent logical state ε
τ
in the Lattice associated of the PAL2v.
Expert Systems for Human, Materials and Automation
284
In practice the value of the Degree it can return in the equation that established the Interval
of Interest of the physical greatness for the decision making. The figure 2 shows a
Paraconsistent logical state ε
τ
that is constituted by the pair (D
C
, D
ct
) formed starting from
the two degrees of evidence
μ and λ given as example.
4.3 Artificial Paraconsistent neural cells
In the Paraconsistent analysis the main objective is to know the value, or degree of certainty,
it can be assured that the proposition is False or True. So, it is considered as a result only the
analysis of the value of certainty D
C
. The value of degree of contradiction D
ct
is an indicator
that informs the measure of inconsistency about the information signals. If there is a low
value of certainty or much inconsistency the result is undefined [DA SILVA FILHO et al,
2010]. In practice it is used values limits that help in the conclusions after the analysis of the
proposition P. The Algorithm of the PAL2v Logic using values external limits is described to
proceed.
4.3.1 Algorithm of the Paraconsistent Annotated Logic with annotation of two values
The Algorithm makes a paraconsistent analysis using only the equations obtained (2) e (3) of
the lattice associated to PAL2v compared to the external limits:
*/ Input Variables */ μ, λ
The values for external limits:
V
icc,
Limit value for inferior certainty,
such as: -1 ≤ V
icc
≤ 0
V
scc,,
Limit value for superior certainty, such as: 0 ≤ V
scc
≤ 1
V
icct,
Limit value for inferior contradiction,
such as: -1 ≤ V
icct
≤ 0
V
scct, ,
Limit value for superior certainty, such as: 0 ≤ V
scct
≤ 1
*/Output Variables*
Output Digital = S
1
Output Analogical = S
2a
Output Analogical = S
2b
*/Mathematics expressions */ as :
C
D μλ=−
1
ct
D μλ=+−
*/determination of the extreme logic states */
If D
C
≥
V
scc
then S
1
= t
If D
C
≤
V
icc
then S
1
= F
If D
ct
≥
V
scct
then S
1
= T
If D
ct
≤
V
icct
then S
1
= ⊥
Otherwise S
1
= I Non definition
D
ct
= S
2a
and D
C
= S
2b
*/ End */
The values for externally adjusted control are limits that will serve as reference for
analysis.
This LPA2v algorithm can be represented as a block that we name the Basic Paraconsistent
Artificial Neural Cell- bPANC. The Paraconsistent Neural cells (PANCs) comprise the basic
elements of the Artificial Neural Paraconsistent Networks [DA SILVA et al, 2010]. To
compose it, it is used a basic Paraconsistent Artificial Cell a (bPANC).
An Expert System Structured in Paraconsistent Annotated Logic
for Analysis and Monitoring of the Level of Sea Water Pollutants
285
Fig. 3. The Basic Paraconsistent Artificial Neural Cell bPANC.
4.4 The learning Paraconsistent Neural Artificial cell for - lPANC
The cells for learning are used in Paraconsistent Neural Network as units of memory and
pattern sensors in primary layers [DA SILVA FILHO, 2001]. For instance, an lPANC can be
trained to learn a pattern using the method of Paraconsistent analysis applied through an
LPA2v algorithm. In the process of learning where it is used as pattern the real values
between 0 and 1 it is considered an equation to calculate the results of the successive values
of degrees of belief
μ
r(k)
until it reaches value 1. So, for an initial value of degree μ
r (k)
, they
obtain values
μ
r (k+1)
until the μ
r (k+1)
=1.
Considering a process of learning of the pattern of True, therefore, the value of start 1, the
equation for learning is:
{
}
1 E(K)C F
E(K+1)
μ - (μ )1
μ
2
l +
= (4)
where:
μ
E(k)C
= 1- μ
E(k)
being l
F
= learning Factor 0 ≤ l
F
≤ 1
And for the process of learning of the pattern of Falseness, therefore, value of start 0, the
equation is:
{
}
1C E(K)C F
E(K+1)
μ - (μ )1
μ
2
l +
= (5)
where:
μ
1c
= 1- μ
1
being l
F
= learning Factor 0 ≤ l
F
≤ 1
For the two cases it is considered the cell that is completely trained when: μ
E(k+1)
= 1.
The learning Factor l
F
is a real value, equal or higher than 0, got arbitrarily through external
adjustments. The higher the value of l
F
higher is the learning process of the cell. If l
F
=1 we
say that the cell has a natural capacity for learning. The natural capacity decreases as the l
F
adjustment gets closer to 0.