Expert Systems for Human Materials and Automation Part 11 pot
Bạn đang xem bản rút gọn của tài liệu. Xem và tải ngay bản đầy đủ của tài liệu tại đây (2.41 MB, 30 trang )
An Expert System Structured in Paraconsistent Annotated Logic
for Analysis and Monitoring of the Level of Sea Water Pollutants
291
5.2 Dada collection and separation in sets
The first steps of the process of development of the Paraconsistent Artificial Neural Network
refer to the data collection related to the problem and its separation into a set of training and
a set of tests. Following this there are the procedures of the parameters of the biological
method for building the sets that were the same used in biology, such as, coloration and size
of cells, time of reaction to the dye and quantity of stressed cells.
5.3 Detailed process for obtaining of the evidence degrees
The learning process links to a pattern of values of the Degrees of Evidence obtained
starting from an analysis accomplished with mollusks from non polluted areas. The
determination of the physiological stress will base on the amount and in the time of reaction
of the cells in the presence of the Neutral Red Dye.
The pattern generates a vector that can be approximate to a straight line, without there are
losses of information. As it was seen, the first observation of the analysis begins to the 15
minutes and it presents the minimum percentage of stressed cells. And the observation
concludes when 50% of the cells of the sample present stress signs. Therefore, in order to
normalize the evidence degree of pollution for counting of cells in relation to the time of
analysis, it was obtained a straight line equation to make possible the analysis through the
concepts of the Paraconsistent Annotated Logic. In that way, the equation can be elaborated
with base in the example of the graph 1 (figure 9), obtained of the existent literature, where
the time of 15 minutes is interpreted as evidence degree equal at one (µ = 1), and the time of
180 minutes as evidence degree equal at zero (µ = 0).
Percentage of
anomalous cells
(%) Pattern generating Vector
60
50
40
30
20
0
0 15 30 45 60 75 90 105 120 135 150 165 180 195
Time (minutes)
Fig. 9. Graph demonstrating example of a pattern of reference of an area no polluted.
This way, the mathematical equation that represents the pattern in function of the time of
occurrence for 50% of stressed cells will have the form:
()
f
xaxb=+.
Expert Systems for Human, Materials and Automation
292
115ab=+
beginning of the analysis
0 180ab=+ end of the analysis
Of the mathematical system, be obtained the values for:
1 /165a =− and b 180 /165= resulting in the function:
1 180
()
165 165
fx x
−
=+
It is verified that this function will return the value of the evidence degree normalized in
function of the final time of the test, and in relation to the pattern of an area no polluted.
The conversion in degree of evidence of the amount of cells for the analysis is also
necessary. For that it is related to the degree of total evidence the total amount of cells and
the percentage of cells stressed in the beginning (10%), and at the end of the test (50%).
10.5xUda b=+ end of the analysis
00.1xUda b=+ beginning of the analysis
With the resolution of the mathematical system, it is had:
(1/4)aUd=
and 0.25b =− and
the equation in the following way:
1
( ) 0.25
0.4x
fx x
Ud
=−
Therefore, x represents the number of cells stressed in relation to the Universe of Discourse
(Ud) of the cells analyzed during this analysis. With the due information, we will obtain the
favorable evidence degree, one of the inputs of the Paraconsistent Neural network. After the
processing of the information of the analyses with the obtaining of the evidence degrees, the
data will go by a Lattice denominated of the Paraconsistent Classifier, which will
accomplish a separation in groups, according to table 3 to proceed.
EVIDENCE DEGREE (µ) GROUP
0 ≤ µ ≤ 0.25 G
1
0.26 ≤ µ ≤ 0.50 G
2
0.51 ≤ µ ≤ 0,75 G
3
0.76 ≤ µ ≤ 1 G
4
Table 3. Table of separation of groups in agreement with the evidence degree.
To adapt the values the degrees of evidences of each level they will be multiplied by a
factor: m/n, where m = number of samples of the group and n = total number of samples. In
other words, the group that to possess larger number of samples will present a degree of
larger evidence.
Only after this process it is that the resulting evidence degrees of each group will be the
input data for the Paraconsistent Artificial Neurall Cells. After a processing, the net will
obtain as answer a degree of final evidence related at the standard time, which will
demonstrate the correlation to the pollution level and a degree of contrary evidence. In a
visual way the intersection of the Resulting Certainty Degree (Dc) and the Resulting
Contradiction Degree (Dct) it will represent an area into Lattice and it will show the level of
corresponding pollution.
An Expert System Structured in Paraconsistent Annotated Logic
for Analysis and Monitoring of the Level of Sea Water Pollutants
293
5.4 Configuration of network
The definition of the network configuration was done in parts. First, it was defined the
parameters of the algorithm of treatment and the way the calculation of the degrees of
reaction of the samples through the mathematics were obtained by a pattern of reference.
After that, it was done a classification and separation in groups using a Paraconsistent
network with cells of detection of equality. These cells that make the network are the ones
for decision, maximization, selection, passage and detection of equality cells. In the end of
the analysis, the network makes a configuration capable of returning the resulting degree of
evidence and a degree of result contradiction, which for the presentation of results will be
related to the Unitary Square in the Cartesian Plan that defines regions obtained through
levels of pollution.
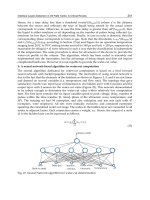
Fig. 10. The Paraconsistent network configuration.
The next figure 11 shows the flow chart with the main steps of the treatment of signals.
Expert Systems for Human, Materials and Automation
294
Standard Signal
Analyses of the waters no polluted
Sample
Parameters of n samples in
the test of the neutral red
colorant
Paraconsistent System
Through a training the system determines
and learns the test pattern
1 180
()
165 165
=− +fx x
Equations
Normalization of data
n Evidence Degrees
n
1
go to the Paraconsistent Classifier
Fig. 11. Paraconsistent treatment of the signals collected through the analysis of the slides.
The figure 12 shows the configuration of the cells for that second stage of treatment of
information signals.
Fig. 12. Second Stage of the Paraconsistent Network - Treatment of the Contradictions.
An Expert System Structured in Paraconsistent Annotated Logic
for Analysis and Monitoring of the Level of Sea Water Pollutants
295
The stage that concludes the analyses is composed of one more network of Paraconsistent
Artificial neural Cells than it promotes the connection, classification through maximization
processes. That whole finalization process is made making an analysis in the contradictions
until that they are obtained the final values for the classification of the level of sea pollution. In
the figure 13 is shown the diagram of blocks with the actions of that final stage of the
Paraconsistent analyses that induce to the result that simulates the method for analysis of the
time of retention of the Neutral Red Colorant through the Paraconsistent Annotated Logic.
Fig. 13. Final Treatment and presentation of the results after classification and analysis of the
Paraconsistent Signals.
5.4 Tests
During this stage, it was performed a set of test using a historical data base, which allowed
determining the performance of the network. On the tests it was verified a good
performance of the network obtaining a good indication for the system of decision of the
Specialist System.
5.5 Results
After the analysis were performed and compared with the traditional method used in the
biology process, we can observe that
the final results are imminent. It was verified that the
bigger differences between the two techniques are where the area is considered non
polluted therefore, mussels were not exposed to pollution because the differences are
Expert Systems for Human, Materials and Automation
296
Fig. 14. Presentation of result of analysis 1 of the pattern of reference done through the
traditional method. Pr = 38min with the positive and negative signs of the observations
made by the human operator.
Fig. 15. Presentation of the result of analysis 1 of the pattern of reference done with the
software elaborated with Paraconsistent Logic. Pr = 27min with the results in the form of
Degrees of Evidence and classification of the tenor of sea pollution.
An Expert System Structured in Paraconsistent Annotated Logic
for Analysis and Monitoring of the Level of Sea Water Pollutants
297
Fig. 16. Presentation of the result of analysis 2 of samples done through the traditional
method. Tr = 10min with the positive and negative signs of the observations made by the
human operator.
Fig. 17. Presentation of the results of analysis 2 of samples done through the software
elaborated with Paraconsistent Logic. Tr= 15min with the results in the form of Degrees of
Evidence and classification of the tenor of sea pollution.
Expert Systems for Human, Materials and Automation
298
outstanding in these conditions due to the pattern process that happens only with an
arithmetic average of the analysis while the Paraconsistent Neural Artificial Network
always takes into consideration the existing contradictions. Later studies are being
performed for the comparison between the two methods of presentation, which can take to a
better comparison of the amount. The following images show the ways of presenting the
two methods, one done the traditional way and the other through the screen of data of the
software of Paraconsistent Logic.
It is verified that the screens of the Software of the Paraconsistent Expert System brings the
values of the Degrees of Evidence obtained and other necessary information for the decision
making. To these values other relevant information are joined capable to aid in the decision
making in a much more contusing way than the traditional system.
5.6 Integration
With the trained and evaluated network, this was integrated into an operational
environment of the application. Aiming a more efficient solution, this system is easy to be
used, as it has a convenient interface and an easy acquisition of the data through electronic
charts and interfaces with units of processing of signals or patterned files.
6. Conclusion
The investigations about different applications of non-classic logic in the treatment of
Uncertainties have originated Expert Systems that contribute in important areas of
Artificial Intelligence. This chapter aimed to show a new approach to the analysis of
exposure and effects of pollution in marine organisms connecting to the technique of
Artificial Intelligence that applies Paraconsistent Annotated Logic to simulate the
biological method that promotes the assay with neutral red. The biological method that
uses a traditional technique through human observation when counting the cells and
empirical calculations presents good results in its end. However, the counting of the
stressed cells through observation of the human being is a source of high degree of
uncertainty and obtaining results can be improved through specific computer programs
that use non-classical logic for interpretation. It was checked in this work that the usage of
a Expert System based in Paraconsistent Logic to get the levels of physiological stress
associated with marine pollution simulating the method of retention of the Neutral Red
dye was shown to be more efficient because it substitutes several points of uncertainty in
the process that may affect the precision of the test. Although the first version of the
Paraconsistent software used presented results which when compared to the traditional
process showed that it has more precision in the counting of cells as well as the
manipulation of contradictory and non consistent data through the neural net, minimizing
the failures the most according to the human observation. This work also shows the
importance of the investigations that search for new theories based in non-classical logic,
such as the Paraconsistent Logic here presented that are capable of being applied in the
usage of the technique of biomarkers. It is important that these new ways of approaching
bring conditions to optimize the elaboration of a computer environment with the objective
of using modern technological ways and this way getting results closer to the reality and
more trustworthy.
An Expert System Structured in Paraconsistent Annotated Logic
for Analysis and Monitoring of the Level of Sea Water Pollutants
299
7. Acknowledgment
Our gratefulness to the Eng. Alessadro da Silva Cavalcante for the aid in the implementation
and tests of the Paraconsistent Algorithms in the Expert System.
8. References
ABE, J. M [1992] “Fundamentos da Lógica Anotada” (Foundations of Annotated Logics), in
Portuguese, Ph D thesis, University of São Paulo, FFLCH/USP - São Paulo, 1992.
BISHOP, C.M. [1995] Neural Networks for Pattern Recognition. 1.ed. Oxford University
Press, 1995.
BLAIR[1988] Blair H.A. and Subrahmanian, V.S. Paraconsistent Foundations for Logic
Programming, Journal of Non-Classical Logic, 5,2, 45-43,1988
DA COSTA et al [1991] “Remarks on Annotated Logic” Zeitschrift fur Mathematische Logik
und Grundlagen der Mathematik, Vol.37, 561-570, 1991.
DA SILVA FILHO et al [2010] Da Silva Filho, J. I., Lambert-Torres, G., Abe, J. M. Uncertainty
Treatment Using Paraconsistent Logic - Introducing Paraconsistent Artificial Neural
Networks. IOS Press, p.328 pp Volume 211 Frontiers in Artificial Intelligence and
Applications ISBN 978-1-60750-557-0 (print) ISBN 978-1-60750-558-7 (online) Library of
Congress Control Number: 2010926677 doi: 10.3233/978-1-60750-558-7-i, Amsterdam,
Netherlands, 2010.
DA SILVA FILHO [1999] Da Silva Filho, J.I., Métodos de interpretação da Lógica
Paraconsistente Anotada com anotação com dois valores LPA2v com construção de
Algoritmo e implementação de Circuitos Eletrônicos, EPUSP, in Portuguese, Ph D
thesis, São Paulo, 1999. 185 p.
DA SILVA FILHO et al[2006] Da Silva Filho, J.I., Rocco, A, Mario, M.C. Ferrara, L.F.P.
“Annotated Paraconsistent logic applied to an expert System Dedicated for supporting in
an Electric Power Transmission Systems Re-Establishment” IEEE Power Engineering
Society - PSC 2006 Power System Conference and Exposition pp. 2212-2220, ISBN-
1- 4244-0178-X – Atlanta USA - 2006.
FERRARA et al[2005] Ferrara, L.F.P., Yamanaka, K., Da Silva Filho. A system of recognition
of characters based on Paraconsistent artificial neural network/. Advances in Logic
Based Intelligent Systems. IOS Press. pp. 127-134, vol.132, 2005.
HALLIDAY [1973] halliday, J.S., The Characterization of Vector cardiograms for Pattern
Recognition – Master Thesis, MIT, Cambridge, 1973.
LOWE et al [1995] Lowe, D. M. et al Contaminant – induced lysosomal membrane damage
in blood cells of mussels Mytilus galloprovincialis from Venice lagoon: an in vitro
study. Mar. Ecol. Prog. Ser., 1995. 196 p.
NASCIMENTO et al [2002] Nascimento,I.A, Métodos em Ecotoxologia Marinha Aplicações
no Brasil, in portuguese, Editora: Artes Gráficas e Indústrias Ltda, 2002.262 p.
NICHOLSON [2001] Nicholson, S. Ecocytological and toxicological responses to cooper in
Perna viridis (L.) (Bivalvia: Mytilidae) haemocyte lysosomal membranes,
Chemosphere, 2001, 45 (4-5): 407 p.
HEBB [1949] Hebb, D. O. The Organization of Behavior, Wiley, New York, 1949.
Expert Systems for Human, Materials and Automation
300
SOS TERRA VIDA [2005] - Organização não governamental SOS Terra Vida. Poluição
Marinha, 15 fev. 2005. in portuguese, available in:
Access in 25 abr. 2008.
KING [2000] King, R, Rapid assessments of marine pollution – Biological techniques.
Plymouth Environmental Research Center, University of Plymouth, UK, 2000. 37 p.
16
Expert System Based Network Testing
Vlatko Lipovac
University of Dubrovnik,
Croatia
1. Introduction
Networks today are not isolated entities as local-area networks (LAN) are often connected
across campuses, cities, states, countries, or even continents by wide-area networks
(WAN) that are just as diverse in their hardware interfaces and software protocols as
LANs and may consist of multiple technologies including, too. Protocols are implemented
in combinations of software, firmware, and hardware on each end of a connection. The
state-of-the-art networking environment usually consists of several network operating
systems and protocol stacks executing. A particular protocol stack from any manufacturer
should inter-operate with the same kind of protocol stack from any other manufacturer
because there are protocol standards that the manufacturers must follow. For example,
the Microsoft Windows® TCP/IP stack should inter-operate with a Linux TCP/IP stack.
Connections can be peer to peer, client to server, or the communications between the
network components that create or facilitate connections such as routers, hubs, and
bridges [1].
As converged IP networks become widespread, increasing network services demand
more intelligent control over bandwidth usage and more efficient application
development practices to be implemented, such as traffic shaping, quality-of-service
(QoS) techniques etc. So, there is a growing need for efficient test tools and methodologies
that deal with application performance degradation and faults. Network professionals
need to quickly isolate and repair complex and often intermittent performance problems
in their network and effectively hand over problems that are outside the network domain
to the appropriate internal group or external vendor. Among the key technologies that are
used for a variety of critical communication applications, we face a rapid growth of
network managers’ concerns, as sometimes they find their networks difficult to maintain
due to high speed operation, emerging and escalating problems in real time and in a very
complex environment such as: incorrect device configuration, poorly architectured
networks, defective cabling or connections, hardware failures etc. On the other hand,
some problems do not cause hard failures, but instead may degrade network performance
and go undetected.
In particular, network management in such a diverse environment encompasses
processes, methods and techniques designed to establish and maintain network integrity.
In addition to its most important constituent - fault management, network management
includes other activities as well, such as configuration management of overall system
hardware and software components, whose parameters must be maintained and updated
on regular basis.
Expert Systems for Human, Materials and Automation
302
On the other hand, performance management involves monitoring system hardware and
software components’ performance by various means. In addition, these tasks include
monitoring network efficiency, too.
Finally, security management is gaining importance as both servers and fundamental
network elements, such as bridges, routers, gateways and firewalls, need to be strictly
administered in terms of authentication and authorization, network addresses delivery, as
well as monitored for activities of a profile, other than expected.
Consequently, integrated network management is a continuum where multiple tools and
technologies are needed for effective monitoring and control.
There are two fundamentally different approaches to network management: reactive and
proactive. The reactive approach is the one most of us use most of time. In a purely reactive
mode, the troubleshooter simply responds to each problem as it is reported by
endeavouring to isolate the fault and restore service as quickly as possible. Without a doubt,
there will always be some element of the reactive approach in the life of every network
troubleshooter. Therefore, in the first phase - reactive management, IT department aims to
increase network availability, where the required management features focus on
determining where faults occur and instigating fast recovery.
N
E
T
W
O
R
K
C
O
N
T
R
O
L
NETWORK MANAGEMENT APPROACHES AND GOALS
REACTIVE
(
INCREASING
AVAILABILITY)
PROACTIVE
(IMPROVING
PERFORMANCE)
OPTIMIZING
(PLANNING FOR
GROWTH)
COMITTING QoS
(PROVIDING SLA)
Fig. 1. Network management requirements escalation
The next phase towards increasing the network control, Fig. 1, is proactive management,
which seeks to improve network performance. This requires the ability to monitor devices,
systems and network traffic for performance problems, and to take control and
appropriately respond to them before they affect network availability.
Optimization is the third phase that includes justifying changes to the network either to
improve performance or maintain current performance, while adding new services. Trend
analysis and network modeling are the key capabilities needed for optimization.
Expert System Based Network Testing
303
Finally, guaranteed service delivery phase involves gaining control of the criteria on
which the IT organization is judged. Actually, modern network management should be
primarily based on a service level agreement (SLA) that specifies precise quality
characteristics for guaranteed services, stating the goals for service quality parameters
that the network manager's critical responsibility is to achieve in terms of: average and
minimum availability, average and maximum response time, as well as average
throughput.
Nevertheless, in what follows, we will mostly be focusing troubleshooting. Analysts have
determined that a single hour of network downtime for the major worldwide companies is
valuated at multiple hundreds of thousands of dollars in lost revenue, and as much as about
5% of their market capitalization, while the average cost per hour of application outage
across all industries, is approaching hundred thousand dollars, and is still rising. For
industries such as financial services, the financial impact per hour can exceed several
millions of dollars.
With this respect, the question that comes up here is whether the troubleshooting must be
reactive?
Not necessarily, as the concept of proactive troubleshooting goes beyond the classic reactive
approach, presuming that active monitoring and managing network health on an on-
going basis should proceed even during the state of the network when it appears to be
operating normally. By this way, the network manager is able to anticipate some
problems before they occur, and is so better prepared to deal with those problems that
cannot be anticipated.
Being proactive means being in control. Certainly, no one would argue against being in
control. But exactly what does it take to be proactive? First of all, it takes investment of time
it takes to actively monitor network health, to understand the data observed, to evaluate its
significance and to store it away for future reference. Secondly, the right tools are needed,
i.e. the test equipment that is capable of making the measurements necessary to thoroughly
evaluate the network health. The test equipment should be able to accurately monitor
network data, even during times of peak traffic load (in fact, especially then!), and
intelligently and automatically analyze the acquired data.
1.1 Network management tools
There exists a wide range of appropriate test solutions for design, installation, deployment
and operation of networks and services. Their scope stretches from portable troubleshooting
test equipment to centralized network management platforms, where each tool plays a vital
role by providing a window into a specific problem area, and is so designed for a specific
purpose. However, no tool is the magic answer to all network fault management issues and
does not everything a network manager typically needs to do.
Network management tools can be compared in many different dimensions. In Fig. 2, they
are rated in terms of their strength in isolating and managing network faults, as well as in
terms of breadth [2], [3]. With this respect, tools range from inexpensive handheld test sets
aimed at physical level installation and maintenance, through built-in network diagnostic
programs, portable protocol analyzers, distributed monitoring systems for multi-segment
monitoring, and finally, to enterprise-wide network management systems. Many of the tools
are complementary, but there is also quite a bit of overlap in capability.
Expert Systems for Human, Materials and Automation
304
SINGLE SEGMENT
MULTIPLE SEGMENTS
HANDHELD
TESTERS
PROTOCOL
ANALYZER
DISTRIBUTED
MONITORING
SYSTEMS
T
R
O
U
B
L
E
S
H
O
O
T
I
N
G
C
A
P
A
B
I
L
I
T
Y
Fig. 2. Tools for fault isolation and analysis
Precise measurement of physical transmission characteristics is essential mostly for WAN
testing, where tactical test instruments include interface testers and BER testers. Interface
testers, also known as breakout boxes, display activity on individual signal lines, and are
often used to perform quick checks on interface operating states at the first sign of trouble.
They feature high-impedance inputs, so a signal under test is not affected by the testing
activity and measurements can be made without interrupting network operation. In
addition to simple go/no-go test panel indicator red and green LED lights, many interface
testers have a built-in wiring block. This feature allows the operator to temporarily modify
individual signal lines for test purposes.
Logic analyzers, oscilloscopes, or spectrum analyzers are sometimes required as well to
make measurements that complement BER and interface testers and are helpful to
determine the source of transmission problems. Other specialized line testing instruments,
available for WAN troubleshooting, include optical time-domain reflectometers (OTDR) for
fiber-optic links, and signal level meters for copper cables.
Protocol analyzers and handheld testers each view network traffic one segment at a time.
Simple tools provide protocol decodes, packet filtering and basic network utilization, as well
as error count statistics. More powerful tools include more extensive and higher level
statistical measurements (keeping track of routing traffic, protocol distribution by TCP port
number, etc ), and use expert systems technology to automatically point out problems on
the particular network segment of interest.
On the other hand, distributed monitoring systems dramatically reduce mean-time-to-repair
(MTTR) by eliminating unnecessary truck rolls for most network problems. These are
designed to monitor multiple network segments simultaneously, using multiple data
collectors – either software agents or even dedicated LAN or WAN hardware probes,
generally semi-permanently installed on mission-critical or other high-valued LAN/WAN
segments, to collect network performance data, typically following the format of the Remote
PROTOCOL
ANALYZERS
Expert System Based Network Testing
305
Monitoring (RMON) protocol [2], [3], which allows continuous monitoring of network
traffic, enabling observation of decodes and keeping statistics on traffic that is present on the
medium. The so acquired data are then communicated to a central network management
analytical application, by means of in-band messages (including alarms when certain
thresholds are exceeded), according to a certain protocol, mostly the Simple Network
Management Protocol (SNMP), so that the software agents that reside on each of the
managed nodes, allow the management console to see information specific to that node
(e.g., the number of octets that have transited through a certain interface), or about a
particular segment (e.g., utilization on a particular Ethernet bus segment), and control
certain features of that device (e.g., administratively shutting down an interface).
For network troubleshooters, understanding how tool selection changes with the progress
through troubleshooting process, is critical to being efficient and effective.
Strong correlation exists between a diagnostic tool being distributed or not, and whether the
tool is used to isolate or to analyze network and system problems. In this sense, generally,
strategic distributed monitoring tools are preferable for isolating faults, however, as
compared to protocol analyzers, distributed monitoring systems (and handheld
troubleshooting tools, too) typically provide only simple troubleshooting capability, while
localized tactical tools - protocol analyzers usually come equipped with very detailed fault
isolation capability, and are so preferable for investigating the problem cause in a local
environment of interest [2], [3].
1.1.1 Protocol analysis
A simplified schematic diagram of data communications network is shown on Fig. 3, where
traffic protocol data units (PDU) flow in between the user side (represented by the Data
Terminal Equipment – DTE), and the network side (represented by the Data Communications
Terminating Equipment - DCE). A protocol analyzer is considered as a device capable of
passive monitoring of traffic and analyzing it either in real time, or in post-processing mode.
PROTOCOL
ANALYZER
DTE
DCE
Fig. 3. Data communications network with a protocol analyzer attached in non-intrusive
monitoring mode
The very essential measurement of any protocol analyzer is decoding, which is interpreting
various PDU fields of interest, as needed e.g. for discovering and/or verification of network
signalling incompatibility and interoperability problems. So, e.g. the decoding measurement
of a protocol analyzer, presented on Fig. 4., displays in near real-time, the contents of frames
and packets in three inter-related sections: a summary line, a detailed English description of
each field, and a hex dump of the frame bytes, also including the precise timestamps of PDU
(frame or packet) arrivals - crucial information that was used in the exemplar tests and
analysis (characterizing congestion window) to follow in the next chapter [4].
Expert Systems for Human, Materials and Automation
306
Fig. 4. Decoding of PDUs, with precise time stamping (100 ns resolution)
Specifically, the primary application of portable protocol analyzers is in-depth, detailed
troubleshooting. But it would be wrong to automatically classify these powerful
troubleshooting tools as appropriate only for top network protocols specialists, as state-of-
the-art protocol analyzers provide powerful statistical measurements and expert systems
capabilities which make these tools extremely easy to use, even for to less trained network
staff.
In this sense, advanced state-of-the-art statistical analysis of traffic for a selected test station
of interest often includes mutually correlated identification and characterisation of active
nodes, their associated protocols and connected nodes, so providing an insight into the
overall network activity of interest. So, for each active protocol stack and each active
connection, line utilization and throughput (average, minimum or maximum), frame length
and the number of bad frame-check-sequence (FCS) errors, will be indicated by these
statistics measurements.
From the hardware platform point of view, there are several classes of portable protocol
analyzers as well. However, the best type of analyzer to select depends on the size,
complexity, and topology of the network involved.
Simple and inexpensive software-only applications run on standard network interface cards
(NIC) and decode protocol frames, adding only rudimentary statistics measurements, while
being capable of keeping up with network traffic only on low and moderately loaded
networks. With limited data filtering or triggering, such products are moderately priced,
and typically consume the host PC resources when running.
Expert System Based Network Testing
307
However, in high-speed networks, such as e.g. 1/10/100 Gbit/s LANs, higher-performance
interface adapters and fast PC systems must be used in order to cope with high data
volumes to be expected. Since standard NICs cannot accept all PDUs if their number
exceeds a certain limit, some of them might be dropped (among them likely to be the ones
most relevant for troubleshooting). In this sense, a very fast PC CPU is needed to be able to
not only accept and process PDUs, but also ensure that filtering and triggering functions are
performing in real time. On top of that, receive and transmit capture buffers must be deep
enough, preferably with direct memory access (DMA), so to not share memory with other
tasks of PC applications (among them the protocol analysis software). The NIC must have
the option to switch off the local-only mode of operation (when, apart from the incoming
PDUs bearing its own address, it would have seen only broadcasts), and so be able to
forward all traffic it sees to the protocol analysis software.
On the other side, top high-performance protocol analyzers, Fig. 5, may also be built on a PC
platform, but include special buffer memories, typically 256 Mbytes or more deep, which
can be written to at very high speed, so insuring 100% data capture even under extreme
traffic loads. The PDUs from such a dedicated capture buffer are processed by a RISC-based
CPU, optimized for speed and accuracy, which feeds the information to protocol analysis
application, running on the PC.
CPU
LOCAL
RAM
LOCAL
RAM
CPU
FILTER/
COUNTER
P
C
I
B
U
S
ETHER.
MGMT
PORT
SERIAL
REMOTE
ACCESS
FILTER/
COUNTER
CAPTURE
BUFFER
CAPTURE
BUFFER
INTERFACE
MODULE
INTERFACE
MODULE
100/1000 ETHERNET,
E1, STM-1,
V-SERIES…
Fig. 5. Architecture of a dual-port HW protocol analyzer [4]
Such portable analyzers with dedicated hardware-based data acquisition, definitely provide
much better capture performance than their software-based counterparts, as not only can
they analyze and record all network traffic (time-stamped with great precision due to the
high-resolution internal clock), but also generate network test traffic at wire speed (even in
high-speed networks such as e.g. 10 Gb/s Ethernet). With such dedicated hardware,
filtering can be accomplished in real time, regardless of filtering criteria (based on protocol,
nodes and/or frame content) and instantaneous network utilization (whose peaks are most
likely to coincide with eventual problems, and so are most needed to get captured and
Expert Systems for Human, Materials and Automation
308
forwarded to the analysis). In addition, some real-time trigger actions (such as e.g. event-
driven stops of data acquisition) can be associated to filtering. Furthermore, hardware-based
protocol analyzers usually support simultaneous multi-port measurements and so enable
performance testing on multiple LAN and WAN interfaces, e.g. on both sides of network
components such as routers and bridges.
2. Expert network protocol analysis
As it was already mentioned, state-of-the-art high-end protocol analyzers often contain very
powerful measurement sets providing much more information than just protocol decodes.
This always includes statistical analysis of traffic, and, finally, the expert analysis, where the
system compares network problems that occur to information in its knowledge database,
and if any error scenario is found in the database that matches the discovered situation, the
system suggests possible diagnoses and troubleshooting tips, so enabling automatic fault
isolation [4].
This has become more and more necessary to adequately address the diversity of potential
complex network problems that definitely deserve more comprehensive approach than just
using traditional network troubleshooting, which is typically based on passive network
measurements by means of a classic protocol analyzer, combined with a variety of ad hoc
tests. Such methodology was satisfactory when network topologies were simple and faults
resulted mostly from configuration or hardware and wiring failures, i.e. when the majority
of network problems were in the physical layer of the protocol stack. Nowadays, with more
intelligent network devices (e.g. integrated layer 2 switching and layer 3 routing),
application/server load balancing (i.e. layer 4 - 7 switching and routing), more sophisticated
security policies and devices, as well as QoS technologies, most network problems have
crept up the stack. Consequently, unlike before, a rising percentage of network performance
problems, faced by network managers, are attributed to higher OSI layers, namely 3, 4
through 7, rather than hard failures. These can include network software bugs, too many
users trying to use the network at once and/or soak up the available network bandwidth,
interoperability problems between protocol stacks because of different interpretations and
implementations of standards, breached network security or software and hardware
updates with unexpected results etc. Moreover, as deploying state-of-the-art complex,
multi-services and multi-technology high-speed networks, including data, voice and
streaming media applications, has become reality, delivering high-availability
communication infrastructures for mission critical applications, and contracted QoS, as well
as maintaining fast growing of sophisticated networks, imply that network downtime is not
an affordable option at all. On top of that, dramatically rising network problems complexity
also implies longer Mean-Time–To-Repair (MTTR), even without taking into account that
quite often network managers rely on limited skill personnel.
Specifically, even a protocol analyzer that is equipped with the best data acquisition
hardware and application-level decodes, as well as advanced statistical analysis (that
identifies how busy is the network, who is connected to it and is using most network
bandwidth, which protocols are the most active stations using, when they are using it, for
what, and whether the network is reaching its capacity, etc.), in many instances, will not
itself timely isolate complex problems on the network and diagnose who is causing them, if
still the fault management process is mostly manual and so very time-consuming, requiring
a great deal of expertise in many aspects of network technology.
Expert System Based Network Testing
309
This in turn means that, in order to keep up with the next-generation-network (NGN)
challenges, troubleshooting methods have to change, as well to better address the rising need
for more sophisticated test tools that will make the process more efficient by providing
automated means for continuous higher-level identification of problems, with less human
intervention, so making decisions on how to best manage the network, justified and so easier.
With this respect, state-of-the art protocol analysis often incorporates some sort of an expert
system that offers a beneficial solution to these problems by continuous monitoring a network
for performance degradation and faults in all 7 OSI layers, logging the results and then looking
up its knowledge database, searching for eventual similarities with the currently identified
network problems. Thus, the expert system capability of a protocol analyzer essentially not
only takes advantage of but goes well beyond passive protocol following and statistical
performance measurements, thus making fault diagnosis much more comprehensive. The
intelligent protocol decodes automatically report on errors or deviations from the expected
protocol, so reducing thousands of captured data frames to a short list of significant network
events, and interpreting the significance of these events. This way, appropriately reported,
such expert-analysis-isolated network abnormalities and inefficiencies significantly reduce the
scope of potential causes of the problem (if not self-sufficiently pinpoint what it most likely
might be), suggesting possible solutions that the network manager can consider to figure out
what is wrong from the visible symptoms, so greatly speeding up the troubleshooting process.
In other words, hand-in-hand with the proactive troubleshooting process is another
methodology called intelligent analysis, which refers to the use of state-of-the-art data reduction
tools available on today's test equipment, which facilitate rapid fault isolation, as a way to
avoid network troubleshooting in (purely) reactive chaos.
Better yet, this way, network managers can even predict the possibility of network failures
and take actions to avoid the conditions that may lead to problems.
2.1 Expert protocol analysis system basic components
A typical rule-based expert system consists of five components: knowledge base, inference
engine, blackboard, user interface, and explanation facility, Fig. 6.
INFERENCE
ENGINE
USER
INTERFACE
BLACKBOARD
KNOWLEDGE
BASE
DIAGNOSTIC
MEASUREMENTS
EXPLANATION
FACILITY
NETWORK
UNDER TEST
Fig. 6. Typical rule-based network expert system components
Expert Systems for Human, Materials and Automation
310
The knowledge base is a collection of data that contains the domain-specific knowledge
about the problems being solved. The inference engine performs the reasoning function. It is
the component of the inference engine that controls the expert system by selecting the rules
from the knowledge base to access, execute and decide when a solution has been found.
After performing measurements and observing the network for significant events, pending
measurement results that satisfy the rules’ preconditions are posted to the blackboard. The
blackboard is a communication facility that serves as a clearinghouse for all information in
the system, while the user interface allows the user to input information, control the
reasoning process and display results. The explanation facility interprets the results by
describing the conclusions that were drawn, explaining the reasoning process used, and
suggesting corrective action.
An expert system used for network troubleshooting must have access to diagnostic
functions to actively confirm the existence of faults and to gather information from other
devices and network management systems on the network. It must generate alarms and log
all pertinent information in a data base. Automated operation must be available so that
human intervention is not required, and audit trails should be provided so that a network
manager can later track problems.
An expert system must also be able to proactively obtain information about the state of the
network to prove (or disprove) hypothesized problems. This is performed by the rules
requesting information (via the inference engine) from the blackboard. The results of the
measurements are posted to the blackboard to allow the inference engine to continue and
eventually prove (or disprove) the hypothesized problem.
Often, real-time demands of troubleshooting a network exceed the performance capabilities of
a conventional rule-based expert system. However, intelligent measurements can greatly
improve the performance of a rule-based expert system. Measurements are considered to be
intelligent if they actually interpret the information on the network, instead of simply
reporting low level events such as frame arrivals. An example of an intelligent measurement
would be one that monitors the network and provides a high-level commentary on significant
network events and conversations between nodes by following the state of network
transactions. It would indicate if a connection was established properly, ensure that the traffic
level between nodes did not exceed a maximum limit, and identify new mappings between
physical layer addresses and network addresses. The process of managing networks includes
fault detection and isolation. Network faults refer to problems in areas such as physical media,
traffic and routing, connection establishment, configuration and performance.
In what follows it will be briefly described how an expert system, embedded in a protocol
analyzer, addresses the areas of fault detection and isolation, specifically in solving common
faults in a complex network environment.
2.2 Network baselining and benchmarking
Understanding how the network under test operates is crucial in managing it proactively, so
without it, a network manager will not have the information needed to make sound
decisions concerning how his network is managed.
Does he have misconfigured servers and nodes that are sending extra data onto the network?
Is the network overloaded? Is it time to upgrade hardware or software? Has that recent
department relocation had an adverse affect on the network? How much growth has occurred
on the network over the past year? Can it sustain that growth level for another year?
Two key processes need to be implemented to proactively manage the network: first, and
most important, the network manager must baseline the network, so to get understanding
Expert System Based Network Testing
311
who is using it and how it is being used. Essentially, a baseline is a set of statistical
measurements made over a period of time, which characterizes network performance, Fig. 7.
It is a snapshot of the characteristics of the network of interest.
N
E
T
W
O
R
K
U
T
I
L
I
Z
A
T
I
O
N
TIME [s]
[
%
]
Fig. 7. An example of network baseline
Measurement results from recorded baselines describe normal operating conditions of the
network, and so can provide points of reference - thresholds for future advanced statistical
analysis and expert measurements, thus enabling discovery of eventual departures of
multiple measurements results from their belonging thresholds, by reporting them as
significant events (e.g. for TCP/IP or XoIP protocols), should anything go wrong sometime
later. With properly set thresholds, e.g. such as the ones in Fig. 8, significant changes will be
neither missed, nor unnecessarily interpreted as routine events.
Some of the so detected high-level ordered significant protocol events may indicate normal
and desirable activity, while others might indicate the presence of potentially serious
problems that should be present only in very rare instances. Following this classification are
the “normal”, “warning”, and “alert” events, enabled in the configuration window of the
above example, sorted by the order of their severity in indication that the identified
problems could lead to network performance degradation or network failure [4].
By this way, baselining uncovers any network problems or inefficiencies so that they can be
fixed before their major affect on users, which also enables better planning for growth. By
looking at successive baselines, taken regularly over a long period of time, one will be able
to observe trends and, based on them, plan for future, in terms of capacity growth and
investments. Moreover, benchmarking applications and components before they are
installed on the network provides the information needed to understand and predict their
effect.
Thus, using the tactics of baselining to first understand the normal network operation and,
when problems arise, perform another baseline and compare the results, problems can be
quickly identified and/or inefficiencies in network operation exposed. This provides
immediate opportunities for improving network performance by observing trends and
recognizing changes, and so being able to anticipate and resolve problems before they
become apparent to network users.
Expert Systems for Human, Materials and Automation
312
Fig. 8. Example of selected TCP/IP significant events for the related expert protocol analyzer
measurements, and setup of baseline thresholds, to match particular network conditions
There are three main steps in performing a network baseline: collecting the data, creating
the report and interpreting the results. First, the data must be collected either using a
protocol analyzer, or a distributed network monitoring system agent, connected directly to
the network segment of interest, such as the backbone and server ones, or the segments
interconnecting separate networks (WAN interconnections first). The data should be
collected for a fixed period of time, at similar time periods and at regular intervals,
especially before and after large network adds, moves, or changes.
Before beginning the data collection process, one will first have to choose a sample period,
which is the total period of time over which baseline measurements are made. The sample
interval is the period of time over which each individual statistics is sampled and averaged,
i.e. it is the amount of time between data points in the baseline data - the time resolution
used to collect the data samples, Fig. 9.
As the sample interval gets larger, it will be less possible to resolve rapid changes in
measured characteristics, as they will be averaged out. So, small sample intervals and small
measurement periods should be used when fine resolution is required, which is usually
appropriate for fault isolation or to obtain an instantaneous characterization of network
health. On contrary, longer sample intervals and longer overall measurement periods are
recommended when baselining for long-term trends, or gaining an overall picture of
network health.
Typically, most appropriate sample intervals are e.g. 1 second samples for periods up to 2
hours, 1 minute samples for periods up to 24 hours, or 10 minutes to 1 hour samples, for
periods of two or more days.
Expert System Based Network Testing
313
TIME
S A M P L E P E R I O D
SAMPLE
INTERVAL
Fig. 9. Baseline sample interval and sample period
Both portable protocol analyzers and distributed monitoring systems provide the
information necessary to baseline and benchmark the network, but, as it was already
pointed out, each of them has its unique capabilities that can help troubleshoot problems or
monitor network performance, respectively. Whatever devices are used as data collectors,
enough data must be provided, with enough accuracy to provide the real insight into the
network operational characteristics. Each network segment of interest should be baselined,
as e.g. a computer-aided engineering (CAE) segment will have quite different characteristics
than a segment running just business applications.
Collecting the data is important; however, if they are not presented in a clear and
meaningful way, it will be very difficult to interpret them, as finally the network manager
needs to look for abnormalities (such as e.g. high levels of network utilization, low average
data packet size, high level of errored frames, or a file transfer protocol (FTP) with average
data size of 100 bytes –indicating that the client or server could be configured incorrectly or
overloaded etc.), trying to learn what is normal for his network over time, and comparing
successive baselines to question any significant changes in traffic patterns or error levels.
The baseline reports can also be used to set thresholds to be used as input to a rule-based
automatic expert system that will review the baseline instead of a human network
troubleshooter, and look for abnormal symptoms, to identify and question unusual traffic
patterns for multiple protocol suites of interest. This will not only help in understanding
how the network operates, but also to predict future changes in the network behaviour,
before they actually occur (with potentially troublesome consequences).
2.3 Practical expert protocol analysis
The expert analysis must be executed on a truly multitasking machine, able to simultaneously
and automatically run several measurements, comparing the measured values with their
corresponding thresholds and so “feeding” the decision algorithm with input data. With such
an arrangement in protocol analysis, PDUs are decoded nearly real-time, where the only
reason for not fully real-time decoding is that other simultaneous processes can slow it down a
Expert Systems for Human, Materials and Automation
314
bit. Intelligent expert system-based protocol decodes automatically follow each conversation,
and report on errors or deviations from the expected protocol.
However, this usually comes integrated with a number of other powerful intelligent tools –
mostly high-level protocol and node statistical analysis, which provide automatic node and
protocol events discovery, and even complete network health audit. These intelligent analysis
tools do much of the problem analysis work automatically, by separating the significant few
events from thousands and millions of PDUs passing through the analyzer every second,
where examining the details in individual PDUs for each protocol stack running only makes
sense after real-time narrowing the focus (by the intelligent tools) just to significant events,
such as connection resets, router misconfigurations, too slow file transfers, inefficient window
sizes, and a number of other problems that might occur. Created this way, a short list of
significant network events with their belonging interpretations and classifications, could
suggest most likely network faults, so enabling quick high-level identifying network problems,
i.e. the trade-in between the time to identify a problem, and the (so extended) time to solve it,
thus greatly increasing the productivity by automating this process.
Most manufacturers call this capability an expert system or expert protocol commentator [2],
[3], [4].
An illustrating example of a typical expert analysis top-level result is presented on Fig. 10,
where too many retransmissions at TCP layer have been reported, slowing down the network.
Fig. 10. An example of expert analysis based detection, isolation and classification of
excessive TCP transmissions
As it can be seen from the display, the related event is classified as “warning”, showing the
node and connection information in one view, properly time-stamped, as well as possible
causes (most likely noisy lines and/or inadequate IP Time-To-Live (TTL) setting). The
alternative might be searching through decodes of thousands of captured frames to
Expert System Based Network Testing
315
eventually figure it out. This hypothesis can be further investigated and verified through
examining the frames with bad cyclic redundancy check (FCS), as well as through active
out-of-service bit-error-ratio (BER) tests. (In general, some network faults just cannot be
isolated without such stimulus/response testing. For example, observing Ethernet frames
with the same IP address and different MAC addresses might indicate a duplicate IP
address problem - but it might also be just a consequence of a complex router topology.
However, ARPing the stations for their addresses will resolve the dilemma in seconds).
Other common examples of expert troubleshooter findings include e.g. router
misconfigurations, slow file transfers, inefficient window sizes (that was used in congestion
window analysis example to follow), TCP connection resets, protocol anomalies and mis-
sequencing, inefficiently configured subnets (so enabling too much cross-subnet traffic and a
router busier than it is necessary), utilization too high, too many broadcasts/multicasts or
too much management traffic (both using considerable bandwidth), one or more computers
transmitting errors, and many more.
On top of the advanced statistical analysis of active connections, stations and nodes
involved, as well as expert classifications of significant events, often a sort of network
“health” figure is estimated, based on the number of identified more or less severe events,
whom the appropriate weighting factors are assigned to subtract the adequate amount (per
each such identified event) from the value of 100%, as presented in Fig. 11, where from the
top level display of the network health, more detailed investigations can be opened by
drilling down into the related embedded expert or statistical analyses [4].
Fig. 11. Network health