Heat Analysis and Thermodynamic Effects Part 9 pptx
Bạn đang xem bản rút gọn của tài liệu. Xem và tải ngay bản đầy đủ của tài liệu tại đây (1.52 MB, 30 trang )
Gas-Solid Flow Applications for Powder Handling in Industrial Furnaces Operations
229
collect is send to a cement plant reducing the consumption of charcoal in the cement’s
process.
Fig. 16. Dust discharging at Albras bake furnace, implemented solution in the left side, in
the center discharge of dust in big bags, free falling of dust in truck in the right - source:
Albras Alumínio Brasileiro SA.
Fig. 17. Computer screen of a pneumatic conveying system in dilute phase at Albras
aluminum smelter – source: (Vasconcelos & Mesquita, 2003).
8. Air fluidized conveyor
It was developed a non-conventional air slide called air fluidized conveyor to be of low
weight, non-electrical conductor, heat resistant, easy to install, maintain and also operates
at a very low cost compared with the conventional air slides. Figure 18 shows in the left a
conventional air slide with rectangular shape, with one inlet and one outlet and in the right
the round air fluidized conveyor with possibility to have multiples outlets.
Heat Analysis and Thermodynamic Effects
230
Fig. 18. The Albras aluminum smelter air fluidized conveyor and a conventional air slide in
the left.
8.1 Predict and experimental results of the air fluidized conveyor for fluoride alumina
The properties calculated and obtained from experiments with alumina fluoride used at
Albras aluminum smelter are summarized in table 2.
Material property value
Specific gravity 3.5
Non- aerated/vibrated bulk density -
3
k
g
m
1000
Aerated bulk density at ( 0.5
m
f
V ) -
3
k
g
m
999.66
Aerated bulk density at ( 0.75
m
f
V ) -
3
k
g
m
999.66
Aerated bulk density at ( 0.875
m
f
V
) -
3
k
g
m
999.66
Aerated bulk density at ( 1.0
m
f
V ) -
3
k
g
m
990.86
Aerated bulk density at ( 1.5
m
f
V ) -
3
k
g
m
868.47
Aerated bulk density at ( 2.0
m
f
V
) -
3
k
g
m
786.86
Aerated bulk density at ( 2.5
m
f
V ) -
3
k
g
m
726.77
Minimum fluidization velocity by Ergun equation (cm/s)
1.83
Minimum fluidization velocity - experimental (cm/s) 1.77
Mean particle diameter - m
99.44
Non- aerated angle of repose - ° 35
Non- aerated angle of internal friction - ° 70
Normal packed porosity (-) 0.71428
Geldart classification according figure 4 – group B
Table 2. Properties of the alumina fluoride.
Figure 19 shows the pictures of the permeameters used to determine experimentally the
minimum fluidization velocity of alumina fluoride.
Gas-Solid Flow Applications for Powder Handling in Industrial Furnaces Operations
231
Fig. 19. Permeameters used at Albras laboratory to survey the minimum fluidization
velocity of the powders used in the primary aluminum industry - source: Albras Alumínio
Brasileiro SA.
8.2 Predict and experimental results of the air fluidized conveyor for alumina fluoride
Two air-fluidized conveyors using the equation 62 were developed as result of a thesis for
doctorate. The results for the conveyor with diameter of 3 inches and 1.5 m long showed in
figure 20 are summarized in table 3.
Fig. 20. Air-fluidized conveyor of 1.5 m long with three outlets.
Table 3. Predicted solid mass flow rate of a 3”-1.5 m air-fluidized conveyor based on
equation 62.
Heat Analysis and Thermodynamic Effects
232
The experimental results for the air-fluidized conveyor showed in figure 20 are summarized
in table 4.
Table 4. Experimental results from the tests runs at Albras Aluminum smelter laboratory.
Figure 21 shows the other air-fluidized conveyor of 3 inches diameter and 9.3 m long
designed using equation 62, which will be used as prototype to feed continuously the
electrolyte furnace with alumina fluoride.
Fig. 21. a) The nonmetallic fluidized pipe during tests in electrolytic aluminum cell; b)
Sketch of the nonmetallic fluidized pipe for performance test at the fluidization laboratory.
The equation 62 predicts a mass solid flow rate of 7.29 t/h for that conveyor, but observed
was a mass solid flow rate of 6.6 t/h at 1.5
m
f
V and a downward inclination of 0.5° was used
during the test run depicted in figure 22.
Fig. 22. Test rig to measure the mass solid flow rate of a, 9.3 m long 3 inches diameter air-
fluidized conveyor at Albras aluminum smelter.
Gas-Solid Flow Applications for Powder Handling in Industrial Furnaces Operations
233
9. Conclusion
The objective of this chapter is to contribute with readers responsible for the design and
operation of industrial furnaces.
Focused on the project of powder handling at high velocity, such as the two cases studies
concerning pneumatic conveying in dilute phase applied at Albras aluminum smelter. The
last case study regarding powder handling at very low velocity such is illustrated in figure 5
is used in several industrial applications and the intention in this case is to help project
engineers to design air slides of low energy consumption. Based on the desired solid mass
flow rate of the process using equation 62 is possible to design the conveyor, knowing the
rheology of the powder that will be conveyed. In the application of Albras aluminum
smelter the experiments results for the small conveyor the values obtained in the
experiments was higher than that predict for horizontal and upward inclination in velocities
less than the minimum fluidization velocity, because the equation doesn’t take in to account
the height of material in the feeding bin according (Jones, 1965) equation. In the case of the
larger conveyor we have better results, because the conveyor is fed by a fluidized hose as
can be seen in figure 21b. So in the next steps of the research it will be necessary to include
the column H of the feeding bin in equation 62.
10. Acknowledgment
The authors would like to thanks the LORD GOD for this opportunity, Albras Alumínio
Brasileiro SA for the authorization to public this chapter, the Federal University of Pará for
my doctorate in fluidization engineering and to inTech - Open Access Publisher for the
virtuous circle created to share knowledge between readers and authors.
11. References
Ergun, S. Fluid Flow through Packed Columns, Chem. Engrg. Progress, Vol. 48, No. 2, pp.
89 – 94 (1952).
Geldart, D. Types of Gas Fluidization Powder Technology, 7, 285 – 292 (1972 – 1973).
Jones, D. R. M. Liquid analogies for Fluidized Beds, Ph.D. Thesis, Cambridge, 1965.
Klinzing, G. E.; Marcus, R. D.; Risk, F. & Leung, L. S. Pneumatic Conveying of Solids –
A Theoretical and Practical Approach, second edition, Chapman Hall.
(1997).
Kozin, V. E.; Baskakov, A. & Vuzov, P., Izv., Neft 1 Gas 91 (2) (1996).
Kunii, D. & Levenspiel O. Fluidization Engineering, second edition, Butterworth-
Heinemann, Boston (1991).
Mills, D. Pneumatic Conveying Design Guide, Butterworths, London, (1990).
Schulze, D. Powder and Bulk Solids, Behavior, Characterization, Storages and Flow, Spriger
Heidelberg, New York (2007).
Vasconcelos, P.D. Improvements in the Albras Bake Furnaces Packing and Unpacking
System – Light Metals 2000, pp. 493 – 497.
Vasconcelos, P.D & Mesquita, A. L. Exhaustion Pneumatic Conveyor and Storage of
Carbonaceous Waste Materials - Light Metals 2003, pp. 583-588.
Heat Analysis and Thermodynamic Effects
234
Yang, W. C. A mathematical definition of choking phenomenon and a mathematical model
for predicting choking velocity and choking voidage, AIChE J., Vol. 21, 1013
(1978).
11
Equivalent Oxidation Exposure - Time for Low
Temperature Spontaneous Combustion of Coal
Kyuro Sasaki and Yuichi Sugai
Department of Earth Resources Engineering, Kyushu University
Japan
1. Introduction
Coal is a combustible material applicable to a variety of oxidation scenarios with conditions
ranging from atmospheric temperature to ignition temperature. One of the most frequent
and serious causes of coal fires is self-heating or spontaneous combustion. Opening an
underground coal seam to mine ventilation air, such as long-wall gob and goaf areas and
coal stockpiles, creates a risk of spontaneous combustion or self-heating. Careful
management and handling of coal stocks are required to prevent fires. Furthermore, the
spontaneous combustion of coal also creates a problem for transportations on sea or land.
Generally, the self-heating of coal has been explained using the imbalance between the heat
transfer rate from a boundary surface to the atmosphere and heat generation via oxidation
reaction in the stock. The oxidation reaction depends on temperature and the concentrations
of unreacted and reacted oxygen. When carbon monoxide exceeds a range of 100 to 200 ppm
in the air around the coal and its temperature exceeds 50 to 55°C, the coal is in a pre-stage of
spontaneous combustion. Thus, comprehensive studies of the mechanisms and processes of
oxidation and temperature increase at low temperature (less than 50 to 55°C) have been
investigated for long years.
Measurement of the heat generation rate using crushed coal samples versus constant
temperature have been reported to evaluate its potential for spontaneous combustion.
Miyakoshi et al.(1984) proposed an equation guiding heat generation in crushed coal via
oxygen adsorption based on a micro calorimeter. Kaji et al. (1987) measured heat generation
rate and oxygen consumption rate of three types of crushed coal at constant temperatures.
They presented an equation to estimate heat generation rate against elapsed time. However,
their time was defined under a constant temperature of coal, thus it is not able to be applied
for the process with changing temperature of coal.
According to our observations of surface coal mines, the spontaneous combustion of coal
initiates at coal seam surfaces as "hot spots," which have temperatures ranging from around
400 to 600 °C. Generally, the hot spot has a root located at a deeper zone from the outside
surface of the coal seam or stock that is exposed to air. When the hot spot is observed on the
surface, it is smoldering because of the low oxygen concentration. The heat generation rate
from coal in the high temperature range (over 60°C) follows the Arrhenius equation, which
is based on a chemical reaction rate that accelerates self-heating. Brooks and Glasser (1986)
presented a simplified model of the spontaneous combustion of coal stock using the
Arrhenius equation to estimate heat generation rate. They used a natural convection model
Heat Analysis and Thermodynamic Effects
236
to serve as a reactant transport mechanism. Carresl & Saghafil (1998) have presented a
numerical model to predict spoil pile self heating that is due mainly to the interaction of coal
and carbonaceous spoil materials with oxygen and water. The effects of the moisture content
in the coal on the heat generation rate and temperature are not considered in this chapter.
However, Sasaki et al. (1992) presented some physical modeling of these effects on coal
temperature.
Yuan and Smith (2007) presented CFD modeling of spontaneous heating in long-wall gob
areas and reported that the heat has a corresponding critical velocity. However, when the
Arrhenius equation is used for a small coal lump, the calculation does not show a return to
atmospheric temperatures. This can be seen from the data shown in Fig. 1. The reason, that
the results cannot be applied to small amounts of coal stock, may be a type of ageing effect.
Nordon (1979) proposed this as a possible explanation using the Elovich equation that has
been used in adsorption kinetics based on the adsorption capacity. He also presented a
model for the self-heating reaction of coal and identified two steady-state temperature
conditions one less than and one over 17°C. He also commented that the transport processes
of diffusion and convection take the mobile reactant, oxygen, from the boundary to the
distributed reaction where heat energy is released, and then convey the latter back to the
boundary. However, his concept is difficult to apply to numerical models.
In this chapter, a model is presented for spontaneous combustions of coal seam and coal
stock. It is based on time difference between thermal diffusion and oxygen diffusion.
Furthermore, the concept of “Equivalent Oxidation Exposure Time (EOE time)” is
presented. Also, we compared the aging time to the oxidation quantity to verify the
mechanism presented. Numerical simulations matching both the thermal behaviors of large
stocks and small lumps of coal were performed.
Lar
ge
S
iz
e
Small size
0
Temperatur
e
, θ
Elapsed time from start of oxidation, t
Numerical Result
s
with Arrhenius Equation
Actual Temperature Curv
e
Lump Coal
Fig. 1. Difference of temperature change between a numerical simulation result by
Arrhenius equation and actual process for small and large amounts of coal stock
2. Mechanism of temperature rise in a large amount of coal stock
Coal exposed to air is oxidized via adsorbed oxygen in temperature ranges. It has a different
time dependence than that expressed by the Arrhenius equation, which guides this behavior
in the high temperature range. The adsorption rate of oxygen decreases with increasing time
for a constant temperature, because coal has a limit of oxygen consumption.
A schematic showing the process of spontaneous combustion is shown in Fig. 2. Assume a
coal stock has all but its bottom surface exposed to air of oxygen concentration, C
0 and
and
Equivalent Oxidation Exposure-Time for Low Temperature Spontaneous Combustion of Coal
237
temperature, θ
0
. Oxidation heat is generated in the coal is started from outside surface of the
stock, because oxygen is supplied from the atmosphere. Some heat is lost to the atmosphere,
but some also diffuse to inward to the center of the stock. The outer part of the stock returns
to the atmospheric temperature, θ
0
, after enough time. However, the oxygen concentration
of the inside stock is kept at a relatively low concentration, because oxygen does diffuse to
the inner zone via the oxidation zone. When coal at the center of the stock is preheated
slowly without oxygen, a high temperature spot at the center is generated.
The oxidation and heat generation zone gradually moves from the stock surface to
the center while shrinking and rising in temperature. Finally a hot spot is formed at the
center (see Fig. 2 (a) to (c)). Oxygen diffuses to center region after formation of the hot
spot. This time delay of oxygen diffusion allows the coal temperature to rise exponentially
in the center by long preheating and inducing smaller EOE time (see 3.3). Thus, of the
greater the volume in the coal stock, the more delay between preheating and oxygen
diffusion.
After formation of the hot spot in the center, the coal begins to burn slowly without flames
and projects toward the outer surface through paths with relatively high effective
diffusivity, which has greater oxygen concentration than the surrounding coal. Finally,
the hot spot appears on the outside surface of the stock, which marks the start of
spontaneous.
Projection of
Hot Spot to
Surface
(d)
Oxidation and
Heat Generating Zone
Low Ox
yg
en
Concentration
Zone
Low Temperature
Zone returned to θ
0
(
a
)
(b)
(
c
)
Heat Transfer
& Radiation
Heat Transfer
& Radiation
Preheated
& Low C
0
Zone
θ
0,
C
0
θ
0,
C
0
θ
0,
C
0
θ
0,
C
0
Hot S
p
ot Formation
Preheated
Zone
Heat Transfer
& Radiation
Fig. 2. Schematic process showing spontaneous combustion of large amount of coal stock,
(a), (b) and (c): Hot spot forming process with accumulating heat and shrinking zone of
oxidation and preheating zone, (d): Projection growth of hot spot toward to stock surface
through high permeable path
Heat Analysis and Thermodynamic Effects
238
3. EOE time and heat generation rate of coal
3.1 Heat generation rate from coal
In the present model, coal oxidation reaction includes physical adsorption and chemical
adsorption via oxygen reaction at low temperatures. Measurements of the heat generation
rate at the early stages of the process that show an exponential decrease have been reported
by many experiments, such Kaji et al. (1987), shown in Fig. 3, and Miyakoshi et al.(1984).
Based on their measurement results, the heat generation rate per unit mass of coal at
temperature θ (°C), q (W/g or kW/kg), can be expressed with a function of elapsed time
after being first exposed to air, τ (s):
()
γτACq −⋅= exp
(1)
where, A (kW/kg) is heat generating constant, C is molar fraction of oxygen, and γ (s
-1
) is
the decay power constant. The initial order of heat generating rate of coal for exposing air is
q(0) ≈ 0.01 to 0.001 kW/kg.
10
-5
10
-4
10
-3
10
-2
0 5000 10000 15000 20000 25000
Ex
p
osure time, τ
(
s
)
Heat generating rate , q(kW/kg·coal)
60 °C
40 °C
20 °C
Ka
j
i et al. (1987)
Australian bituminous coal
Measurements; 23.8 to 53.3 °C
Models for
J
apanese
bituminous coals by
Miyakoshi et al. (1984)
(cf. Tables 1 and 2)
C = 0.21
Fig. 3. Models of heat generating rate of coal vs. exposure time for constant temperatures
3.2 Arrhenius equation for coal oxidation
Kaji et al. (1987) measured rates of oxygen consumption due to coal oxidation in the
temperature range 20 to 170 °C using coals ranging from sub-bituminous to anthracite coal.
They reported that heat generated per unit mole of oxygen at steady state is h = 314 to 377
(kJ/mole), and their results of the Arrhenius plots, the oxygen consumption rate versus
inverse of absolute temperature T
-1
(K
-1
), shows the Arrhenius equation. Thus, the higher the
coal temperature; the faster the oxidation or adsorption rate is given. When the heat
generation rate is proportional to oxygen consumption rate, the heat generated, A, can be
estimated using the following equation,
−⋅=
RT
E
AA exp
0
(2)
Equivalent Oxidation Exposure-Time for Low Temperature Spontaneous Combustion of Coal
239
where, A
0
(kW/kg) is pre-exponential factor for A, E (J/mole) is the activation energy, R is
gas constant
(J/mol/K), and T (=273+θ) (K) is absolute temperature. Kaji et al.(1987) has
reported that the coals have almost the same activation energy of around E=50 kJ/mole for
temperature range of 20 to 170 °C. On the other hand, Miyakoshi et al. (1984) reported as E ≈
20 kJ/mole for Japanese coals in temperature range lower than 50 °C based on
measurements of oxygen adsorption heat using with a micro-calorimeter.
The activation energy of fresh coal is expected as much lower than that of exposed coal in
the air, because fresh coal adsorbs oxygen physically at an initial stage of self-heating.
Average activation energy and decay power constant,
presented by Miyakoshi et al. for
Japanese bituminous coals
(see Tables 1 and 2), were used for present numerical
simulations.
3.3 Equivalent oxidation exposure time
The heat generating rate, q, is expressed as a function of θ, C, and τ. Equations (1) and (2) can
be used to calculate q for a constant temperature. However, they are not applicable for the
calculation of the normal coal temperature change versus elapsed time. Its concept is partly
similar to Elovich equation, but it provide a scheme to estimate q follows change of
temperature of coal and EOE time.
For an example, assume a coal lump is placed in an environment in which C = 0.1 and
θ=45°C, for elapsed time; τ=1 h, and then is stored in other one of C =0.2 and θ= 70°C for
another 1 h period. It is not possible to reconstruct this situation by adding the former and
later times with different oxidation rates. A new model of the elapsed time that considers
the aging degree of the coal is required to overcome this difficulty. The cumulative
generated heat of the coal, Q
m
' (J/g) from elapsed time 0 to t, is defined as,
=
t
m
dttCθqQ
0
')',','(''
(3)
where, the actual heat generation rate, q'(θ',C', t'), θ’ and C' are changing with the elapsed
time, t'. However, the cumulative heat, Q
m
, for constant θ and C, can be derived using
Equations (1) and (2) from time 0 to τ*:
()
m
τ
m
Qγτ
γ
CA
dttCθqQ =−−==
)exp(1')',,('
*
*
0
(4)
If the amounts of accumulated heat, Q'
m
and Q
m
, defined in Equations (3) and (4), are equal,
τ* in Eq. (4) expresses the aging time of the coal for constant temperature; θ = θ'(t) and
constant concentration; C=C'(t), for the actual elapsed time (t'=t). In this paper, τ* is defined
as the EOE time (see Fig. 4). It is calculated based on a summation of generated heat q'(θ',C',
t')·Δt' over a numerical calculation interval time, Δt'. It is expressed by the following single-
calculation equation:
⋅−⋅−=∴
i
ii
tq
CA
γ
γ
τ 'Δ'1ln
1
*
(5)
Heat Analysis and Thermodynamic Effects
240
=
t
m
dttCθqQ
0
')',','(''
t
0 τ
*
Heat Generating Rate, q’(W/g)
Elapsed time/ EOE time
t’
q’(θ’, C’,t’)
(actual)
q(θ’, C’, t’)
(model)
θ, C
=
*
0
')',,(
τ
m
dttCθqQ
Fig. 4. Schematic definition of EOE-time of coal to estimate heat generating rate by matching
total heat generations
The most important characteristic of the EOE is that if a part of coal releasing heat to its
surrounding, its EOE time is increased. It means that receiving heat makes smaller EOE time
due to temperature increasing. Using the EOE time, the actual heat generating rate of coal at
t can be obtained by substituting τ* instead of τ into Eq. (1).
0
/
() () exp exp( *)
273 ( )
ER
qt Ct A
t
γ
τ
θ
=⋅⋅ − −
+
(6)
Assuming the reaction heat of unit volume of oxygen is ΔH, the oxygen consumption rate,
v', and the accumulated consuming oxygen, V', are given by:
()
q
vt
H
=
Δ
(7)
*
0
( ) '( ', ', ') 'Vt v C t dt
τ
θ
=
(8)
The reaction heat of unit volume of oxygen was evaluated as ΔH ≈ 16 (J/cm
3
O
2
) based on
the experimental results of heat generation rate by Kaji et al.(1987) and Miyakoshi et
al.(1984) shown in Fig. 3. The oxygen consumption rate is used in the oxygen diffusion
equation for its concentration.
3.4 Thermal conduction and diffusivity of coal stock consisting porous media
For a case of coal stock, thermal characteristics are required for a porous media consisting
lump coals and air. Thermal conductivity of a porous media is dependent on the porosity or
void fraction, ε, and specific internal surface area in it. Kunii & Smith (1960) have presented
the equations predicting an effect of porosity and thermal conductivities of solid and fluid
on the heat transfer properties. They have presented effective thermal conductivity of
porous media versus porosity, ε. In present model of a coal stock, effective thermal
conductivity can be estimated by a following equation revised from the Kunii & Smith’s
equation by omitting term of the thermal radiation effects due to low temperature range,
Equivalent Oxidation Exposure-Time for Low Temperature Spontaneous Combustion of Coal
241
0.
0.2
0.4
0.6
0.8
1.0
0. 0.2 0.4 0.6 0.8 1.0
ε
λ/λcoal
Unconsolidate
Loose Packin
g
Close
Packing
Fluid: Air
λ
coal
/λ
air
= 13.3
Kunii & Smith (1960)
Linear parallel Model
λ = λ
coal
(1- ε)+ ελ
air
Consolidated
Fig. 5. Effective thermal conductivity vs. porosity of coal stock in the air evaluated by Kunii
& Smith’s equation(1960) (a case for λ
coal
/λ
air
= 13.3)
3
2
Φ
1
+
−
+=
air
coal
coal
air
coal
λ
λ
ε
λ
λ
ε
λ
λ
(9)
where λ is effective thermal conductivity of coal stock, λ
coal
is thermal conductivity of lump
coal, λ
air
is thermal conductivity of air, and Φ is a ratio of effective thickness of air film over
coal lump diameter given against ε that is classified into three regime of ε≥0.476 (loose
packing/unconsolidated), 0.476>ε≥0.260 and ε<0.260 (close packing/consolidated) adapted
by Kunii & Smith (1960). Volumetric heat capacity, ρC
p
(J/kg), and thermal diffusivity of the
coal stock,
α (m
2
/s) are derived from following equations,
coal
Pcoal
air
PairP
CρεCερCρ )1( −+=
(10)
p
A
C
λ
ρ
=
(11)
Suppose λ
coal
/λ
air
= 13.3 or , λ
coal
= 0.36 W/m/°C for a typical thermal conductivity of coal, the
effective thermal conductivity, λ, calculated by Eq. (9) is shown in Fig. 5 with thermal
conductivity of linear parallel model; λ = λ
coal
(1- ε)+ ελ
air
. The effective thermal conductivity
is lower than that of the linear parallel model, because air in coal stock gives a thermal
resistance around coal lumps because of low thermal conductivity of air.
Coal Density
Specific Heat of
Coal
Thermal
diffusivity of Coal
Diffusion
Coefficient
ρ
coal
C
p
α D
1291 kg/m
3
1210 J/kg/°C 6.8×10
-8
m
2
/s 7.1×10
-6
m
2
/s
Table 1. Thermal properties of coal for present numerical simulations
Heat Analysis and Thermodynamic Effects
242
Decay power constant Pre-exponential factor Activation energy
γ
A
0
E
3.0×10
-4
s
-1
2.9×10
4
W/kg/kg 2.0×10
4
J/mol
Table 2. Heat generating properties of coal for present numerical simulations
r
θ
(r),
C(r)
θ
0
= 25 ºC
C
0
= 0.2
O
2
Molecular Diffusion;
D = 7.1×10
-6
m
2
/s
Porosity; ε = 0.01
d
o
= 2r
o
Fig. 6. Model definition of a sphere lump coal exposed to atmospheric air
4. Numerical simulation results and discussion
In this section, numerical simulations for three kinds of coal stock model carried out by
authors are introduced to show the effectiveness of the EOE time simulating self-heating
process of the coal stocks. Those were done using the finite difference method to solve the
equations on heat transfer and oxygen advection and diffusion. Number of blocks used in
the simulation was 100 for one-dimensional model and 10000 for two-dimensional model.
Time interval of the numerical simulations was adapted as 20s to satisfy enough accuracy.
4.1 Sphere lump coal exposed to atmospheric air
The simulations on coal lump were carried out for simple one-dimensional sphere model as
shown in Fig. 6. Its outer surface is open to air with constant temperature and constant O
2
concentration. Thus, oxygen is provided by molecular diffusion expressed as;
p
C
q
r
θ
r
θ
r
a
t
θ
+
∂
+
∂
=
2
2
2
∂
∂∂
∂
(12)
vρ
r
C
r
C
r
D
t
C
ε −
∂
+=
2
2
2
∂
∂
∂
∂
∂
(13)
o
rrat
CC
θθ
=
=
=
0
0
(14)
The thermal and heat generating properties of the coal seam used in the simulations are
listed in Tables 1 and 2. Gas permeability, K, and diffusion coefficient, D, of lump coal and
Equivalent Oxidation Exposure-Time for Low Temperature Spontaneous Combustion of Coal
243
close packing of crushed coal were measured, and the correlated equations have been
presented by Sasaki et al.(1987). The boundary conditions of temperature and oxygen
concentration at the outer surface were fixed with constants expressed by Eq.(14).
Coal Lump
Sphere Model
20
30
40
50
60
70
80
90
100
0.001 0.01 0.1 1 10 100 1000
Elapsed Time, t (da
y
)
Temperature at Center, θ(°C)
Initial
d
o
=4
m
d
o
=10m
d
o
=2m
d
o
=1
m
d
o
=0.3m
d
o
=0.5
m
d
o
Fig. 7. Temperature at sphere center
vs. elapsed time for different diameter
Coa
l
Lum
p
Sphere Model
0
4
8
1
2
16
2
0
0.001
0
.01 0.1
1
10 100 1000
Elapsed Time,
t
(day)
O
2
Concentration at Center, C(0), %
d
o
=4
m
d
o
=10
m
d
o
=2
m
d
o
=1
m
d
o
=0.5m
d
o
=0.3m
d
o
Fig. 8. Oxygen concentration at sphere center vs. elapsed time for different diameter
Heat Analysis and Thermodynamic Effects
244
Coal Lump
Sphere Model
0.0
0.2
0.4
0.6
0.8
1.0
1.2
1.4
1.6
1.8
2.0
0.001 0.01 0.1 1 10 100 1000
Ela
p
sed Time, t
(
da
y)
EOE-Time / Elapsed Time, τ
*
/t
1
d
o
=10m
d
o
=4m
d
o
=2m
d
o
=1m
d
o
=0.5m
d
o
=0.3m
d
o
Fig. 9. Ratio of EOE time over elapsed time at sphere center of coal lump vs. elapsed time for
different diameter
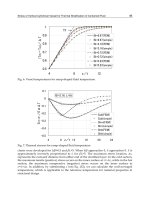
Figures 7 to 9 show the numerical simulation results on temperature, oxygen concentration
and ratio of EOE time over elapsed time at the sphere center versus elapsed time for
different diameter d
0
= 0.3 to 10m . The temperature at center of the stock is increased with
elapsed time, but the cases of d
0
≤ 2 m show the temperature return to atmospheric and
initial temperature
θ
0
=25 ºC. This is because that the EOE time increased by heat transfer to
surrounding air makes reducing heat generation rate of coal lump even if its location is at
the center. However, the case of d
0
≥ 4 m, coal at the sphere center receiving enough heat in
low oxygen concentration before oxygen diffuses into the center, and lower EOE time
induces higher heat generation than that of d
0
≤ 2m before ignition and combustion of coal.
The critical diameter is evaluated roughly as d
0
= 3m for present model, it depends on the
activation energy, E and the decay power constant, γ, of the coal.
4.2 A model of coal seam remained at goaf area in underground mines
In Fig. 10, a simple one-dimensional numerical model for a coal seam remained at goaf area
that is cavity area behind a longwall working in underground coal mines. It is expected to
expose to relatively high temperature air of 45 °C. Its faces are open to air with ventilation
pressure difference in the goaf area, Δp = 10 mmH
2
O= 98Pa. Thus, oxygen is provided by
not only molecular diffusion, but also permeable airflow between two faces. Therefore,
oxygen in the air diffuses from both ends and adsorbs in micro pores of the coal seam as it
diffuses toward the center of the seam.
The thermal and heat generating properties of the coal seam used in the simulations are
listed in Tables 1 and 2. In this study, the effects of the moisture content in the coal on the
heat generation rate and temperature are not considered. However, Sasaki et al. (1992)
presented some physical modeling of these effects on coal temperature.
Equivalent Oxidation Exposure-Time for Low Temperature Spontaneous Combustion of Coal
245
x
Air
θ
0,
C
0
θ
0,
C
0
θ(x)
,
C(x), D, K
0
L
Underground coal mine
Goaf area with
Pressure Difference;
Δp = 10mmH
2
O=98Pa
C
0
= 0.2, θ
0
= 45°C
h
c
= 2m, h
r
= 1m
K
0
= 50 md
D =7.1×10
-6
m
2
/s
coalrrc
coalr
λhλh
λλ
κ
+
=
2/
2
h
r
h
c
h
r
θ
0
θ
0
Fig. 10. Numerical simulation model of a coal seam using one dimensional model
qcp
C
q
θθ
hpC
κ
x
θ
a
t
θ
+
∂
= )(
0
2
2
∂
∂
∂
(15)
vρ
x
C
U
x
C
D
t
C
ε -
∂
∂
-
∂
∂
2
2
∂
=
∂
(16)
Lμ
p
KU
air
Δ
0
=
(17)
Lxat
CC
θθ
,0
0
0
=
=
=
(18)
The coal seam is L= 5.0 m in length, has effective diffusion coefficient of D=7.1×10
-6
m
2
/s,
and permeability of K
0
= 10 to 100 md ≈ 10
-15
to 10
-14
m
2
.
The results showing the temperature distribution are shown in Fig. 11. The zone with rising
temperature and high oxygen consumption gradually moves toward the center and its
maximum temperature also increases. The present results are similar to the simulation
results presented by Nordon (1979), but temperature of the outer layer near the boundary
surface decreases with the decreasing heat generation rate. This drop in the heat generation
rate is due to increasing EOE time in the outer layer. As shown in Fig. 12, the larger the
permeability, the larger the EOE time of the outer layer of the stock.
The thermal and heat generating properties of the coal seam used in the simulations are
listed in Tables 1 and 2. In this study, the effects of the moisture content in the coal on the
heat generation rate and temperature are not considered. However, Sasaki et al. (1992)
presented some physical modeling of these effects on coal temperature.
The results showing the temperature distribution are shown in Fig. 11. The zone with rising
temperature and high oxygen consumption gradually moves toward the center and its
maximum temperature also increases. The present results are similar to the simulation
results presented by Nordon (1979), but temperature of the outer layer near the boundary
surface decreases with the decreasing heat generation rate. This drop in the heat generation
rate is due to increasing EOE time in the outer layer. As shown in Fig. 12, the larger the
permeability, the larger the EOE time of the outer layer of the stock.
Heat Analysis and Thermodynamic Effects
246
Oxygen in the ventilation air diffuses from both faces of the coal seam toward its center
region under the lowest oxygen concentration due to absorption at outer regions as shown
in Fig. 13. It takes much longer time to make higher oxygen concentration in the center
region.
45
50
55
60
65
70
75
80
00.20.4 0.6 0.8 1.0
x/L
Coal Temperatuew, θ (°C).
3.0
11.6
27.0
50.9
100
t = 210 day
0.52
Fig. 11. Transition of temperature distribution of coal seam (L=5m, Initial temperature, θ(0) =
θ(L) = 45°C, outer oxygen concentration, C(0) = C(L) =0.20, permeability K
0
=50 md = 4.9×10
-
14
m
2
, D=7.1×10
-6
m
2
/s)
0
50
100
150
200
250
00.20.40.60.81.0
x/L
K
0
=100md
K
0
=50md
K
0
=10md
t=180 da
y
L=5m
EOE time, τ (day)
Fig. 12. Simulation results of EOE-time for different permeability of coal seam (L=5m, θ(0)
=θ(L) =45°C, t = 180 days, outer oxygen concentration, C(0) = C(L) =0.20)
Equivalent Oxidation Exposure-Time for Low Temperature Spontaneous Combustion of Coal
247
0
0.05
0.10
0.15
0.20
0 0.2 0.4 0.6 0.8 1.0
x
/
L
O
2
Concentration (-)
0.52
3.1
11.6
50.9
t
= 210 da
y
0.06
Fig. 13. Distributions of oxygen concentration in coal seam (L=5m, θ(0) = 45°C, oxygen
concentration, C(0) = C(L) =0.20, permeability K
0
=50 md = 4.9×10
-14
m
2
, D=7.1×10
-6
m
2
/s)
4.3 Two-dimensional coal stock in considering internal natural convection flow
Nield & Bejan (1999) have presented numerical models and applications for convection
flows in a porous media. Spontaneous combustion in a coal seam, that is consolidated
porous media, has been modelled and analyzed by numerical simulations. The simulation
was performed using the finite difference method to solve the equations of heat transfer,
oxygen diffusion and permeable flow via ventilation pressure difference.
The EOE time has been applied to numerical simulations on spontaneous self-heating of
coal stocks. The numerical simulations of the coal stock were performed while accounting
for the natural convection flow and heat transfer in the stock as a porous media with two
dimensional simulation model, which shown in Fig. 14. The right-hand region of width W
and height H (x=0 to W, z = 0 to H) was calculated using its symmetry about x = 0.
By solving equations of stream function, ψ, and boundary condition at outer surface (x=L
and z=H), the natural convection flow velocities (u, w) in horizontal(x) and vertical(z)
directions (x, z) are expressed by numerical analysis with two dimensional equations for
heat transfer and oxygen diffusion for the stock that is expanded from equations in one
dimension described in former sections 4.1 and 4.2 (see Nield & Bejan, 1999). The numerical
simulations were done using with 900 to 1800 blocks for the coal stock models.
0;0 ==
∂
∂
z
z
θ
x
θ
0,
C
0,
ψ=0
θ(x)
,
C(x), ψ
z
H
2L
θ
0
=25ºC
C
0
=0.2
ε =0.4
K= 1.1×10
5
d
D=3.4×10
-4
m
2
/s
Fig. 14. Two-dimensional coal stockyard model with internal natural convection flow
Heat Analysis and Thermodynamic Effects
248
0.1
1
10
100
11010
2
10
3
10
4
Re
N
u
=aδ/λ
Kunii & Smith
(
1960
)
N
u
=1.6Re
1
/
2
Wakao & Ka
g
uei (1984)
Kunii & Suzuki(1967))
δ
λ
air
,μ
air
,υ
air
v
θ
Δq
q
θ
air
Fig. 15. Nusselt number, N
u
vs. Reynolds number, Re=vδ/υ
air
, in porous media consisting
lump coals and air
x
θ
βg
μ
ρK
zx
air
air
∂
∂
∂
∂
∂
∂
=
Ψ
+
Ψ
2
2
2
2
(19)
z
w
x
u
∂
∂
∂
∂
Ψ
;
Ψ
−==
(20)
where K is permeability of coal stock, β is thermal expansion coefficient of air, μ
air
is air
viscosity and g is acceleration of gravity. The boundary conditions at x=0, W and z=0, H are,
Hz
z
z
Wz
x
x
= at 0=
Ψ
;0= at 0=Ψ
= at 0=
Ψ
;0= at 0=Ψ
∂
∂
∂
∂
(21)
A model on heat transfer rate between lump coals or coal matrix and airflow is needed to
simulate internal temperature distribution in the stock. Wakao & Kaguei(1982) reviewed the
effective heat transfer coefficient, a, for unconsolidated porous media. Expressions of
Nusselt number, N
u
(=aδ/
λ
), have been presented by for the interstitial heat transfer
coefficients in porous media as shown in Fig. 15. From the figure, N
u
is roughly proportional
to square root of the Reynolds number, R
e
1/2
, and it matches fairly well with equations
presented by Kunii & Smith(1960), Kunii & Suzuki and Wakao & Kaguei(1982). In present
numerical simulations, an approximated equation on heat transfer per unit volume, Δq ;
air
air
eair
λ
δ
ξθθ
Rξθθaq
)(
6.1)(Δ
2/1
−
=−=
(22)
where θ
air
is air flow temperature, θ is lump coal temperature and ξ is internal surface area in
the unit volume of the coal stock. Δq is used to calculate natural convection air flow
temperature θ
air
and lump coal temperature θ with heat generation rate of coal lump as q+Δq.
Equivalent Oxidation Exposure-Time for Low Temperature Spontaneous Combustion of Coal
249
The coal stock W in width and H in height was simulated with the stock conditions; C
0
=0.2,
θ
0
=30°C, K= 1.1×10
5
d and D=3.4×10
-4
m
2
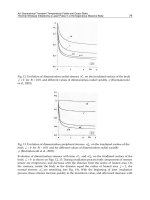
/s. The stock bottom at z = 0 is set as adiabatic and
impermeable boundary. Natural convection airflow in the stock is observed in Fig. 16 as that
flow comes from side walls toward the center of the stock. It controls temperature rise,
cooling, and oxygen supply. High temperature region that was generated at center and
upper in the stock after t≈100 h. But the natural convection flow and distribution of oxygen
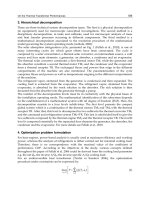
concentration are complicated with rapid changing in early stage; t≈ 0 to 100 h of self-
heating of coal stock (see Fig. 17). The region is also downstream of the convective airflow
with low oxygen concentration but high temperature. The convection flow becomes faster
with rising internal temperature. The mechanisms controlling the temperature rise are
complex and affected by the EOE time. The temperature and convective flow velocity are
affected each other, and coal temperature determines not only the heat generation rate by
supplying oxygen, but also the cooling or heating rate proportional to temperature
difference between air and coal lumps.
A comparison of simulation results for different aspect ratios; W/H = 1 and 2 is shown in
Fig. 18. It is interesting that center region of longer ratio W/H= 2 shows relatively lower
temperature compared with outer region. The reason is the internal natural convection flow
from side walls is coming up to upper surface before closing to center region. Thus, the
temperature distribution of right region is similar even if the aspect ratio is different.
Figure 19 shows the maximum temperature in the stock, θ
max,
versus the elapsed time, t, for
different aspect ratios W/H = 1 and 2. It rises to a temperature between 47 and 52°C in less
than t=100 h, then holds this temperature during t=30 to 300 hours. Finally, the temperature
decreases with time, because of the increasing the EOE time by releasing heat to the
atmosphere. The natural convection airflow provides oxygen, but suppresses the maximum
temperature in the stock by cooling effect and makes heat transfer increasing with the
temperature difference to air temperature in atmosphere.
W
W
0 0
HH
z z
x x
Temp.
34
30
32
33
31
a) Flow stream line in right half b) Temperature distribution in right half,
Fig. 16. Streamlines of internal natural convection flow and temperature distribution at t =
500h in coal stock (2W=10m, H=5m, C
0
=0.2, θ
0
=30°C, K= 1.1×10
5
d, D=3.4×10
-4
m
2
/s)
Finally the simulation was done to get matching with a monitored temperature at a coal
stockyard carried out by Coal Mining Research Center, Japan (CMRCJ, 1983). As shown in
Fig. 20, a model of a coal stockyard is 30m in width and 5m in height with trapezoid shape.
On the other hand, the simulation model is just rectangle shape consists same thermal and
flow characteristics of the coal stock defined in Fig. 14. The temperature at the point in coal
Heat Analysis and Thermodynamic Effects
250
stockyard was compared. It shows fairly well matching with the monitored temperature
data to corresponding position.
z z z z
x x x x
1h 5h 15h 24h
0.20
0.19
0.18
0.17
0.16
0.15
O
2
Fig. 17. Change of oxygen
c
oncentration distribution of two-dimensional coal stock (right
half, 2W=10m, H=5m, K= 1.1×10
5
d, D=3.4×10
-4
m
2
/s) with internal natural convection flow
x 75h x 120h
z z
H = 5m , W = 5m
H = 5m , W = 10m
48
44
36
32
28
Temp.
Fig. 18. Effect of aspect ratio, H/W, on temperature distribution in two-dimensional coal
stock with internal natural convection flow (2W=10m, H=5m, K= 1.1×10
5
d, D=3.4×10
-4
m
2
/s)
An important result of the numerical simulations is that the oxidation of coal in the low
temperature range reduces heat generating rate, because it provides cooling air accelerates
increasing the EOE time. This could be used to ensure that coal stocks are kept within a
safety level that prevents spontaneous combustion. Turnover of coal stocks at regular
intervals works by increasing EOE time and releasing heat from center region of the stock.
0 100 200 300 400 500 600
35
40
45
50
55
θ
max
(°C)
Elapsed time, t (h)
W=15m
H=5m
W=10m
H=5m
W=5m
H=5m
30
C
0
=0.2, θ
0
=30°C
Fig. 19. Numerical simulation results of the maximum temperature transition in coal stock
with three different aspect ratios
Equivalent Oxidation Exposure-Time for Low Temperature Spontaneous Combustion of Coal
251
6m
30 m
6m
30
m
by CMRCJ (1993)
Numerical Model
6m
Monitored
Temperature
Target
Temperature
5m
5m
12m
12m
2
0
3
0
4
0
5
0
6
0
7
0
8
0
0204060 80
Elapsed Time, t (day)
Coal Temperature, θ (°C)
Numerical simulation results (EOE time)
M
easured b
y
CMRCJ (1993)
C
0
=0.2, θ
0
=20 °C
Fig. 20. Comparison of Numerical simulation results on coal temperature in a stockpile with
monitored values by the Coal Mining Research Center, Japan (CMRCJ)
5. Summary
In this chapter, a thermal mechanism of spontaneous combustion of coal seams and stocks
in low temperature has been described. It has been discussed that the reason to enhance self-
heating of coal stocks is the time delay between preheating from thermal diffusion and
oxygen provided via diffusion. Especially, preheating without supplying oxygen makes a
situation with high risk of spontaneous combustion. Another important mechanism
discussed is the formation of a hot spot through the shrinking of the heated oxidation zone
from the outer layer toward into the center region of the coal stock.
Heat generating of coal via the oxidation at low temperature includes complex functions of
temperature and elapsed time. Thus, numerical models using only the Arrhenius equation
to express heat generating of coal bases on its temperature are not able to simulate actual
heat and mass transfer phenomena.
The concept of equivalent oxidation exposure time (EOE time) has been introduced to
express time decay of coal oxidation. We have used this concept to simulate the heat
generation while considering coal aging; that is, the ratio of the cumulative amount of
oxidation to its oxidation capacity. This concept allowed us to consider these factors using
simple calculation procedures following temperature changing of the coal. The physical
model agrees with some experimental measurements with decay rate of heat generating
from coal during exposure to oxygen. It has been successfully applied to simulate the
temperature of rump coal, coal seam and coal stock, which are exposed to ventilated or
atmospheric air. We used the finite difference method to solve the equations of thermal
diffusion, heat transfer, and oxygen diffusion in these models. For the case of the coal stock,
natural convection flow was also considered. The results showed that natural convection
flow provides oxygen, but suppresses the maximum temperature of the stock by convective
heat flow moving to the atmosphere.
Low temperature oxidation of coal with cooling accelerates the increase of the EOE time and
reduces heat generation rate to an inherently safe level. Turnovers of lump coals in the stock
at regular intervals are expected to prevent spontaneous combustion effectively by
increasing the EOE time; not only by releasing heat in the center of the stock.
Heat Analysis and Thermodynamic Effects
252
6. Acknowledgment
The authors would like to thank Prof. Emeritus Dr. Miyakoshi and Mr. K. Sakamoto (Tone
Co., LTD.) for their efforts on present study. We are also grateful to Prof. Ivana Lorkovic for
encouraging me to write this chapter.
7. Nomenclature
a
= effective heat transfer coefficient [W/m
2
/°C]
A = heat generating constant [kW/kg] or [W/g]
A
0
= pre-exponential factor for A [kW/kg] or [W/g]
C
= oxygen concentration or molar fraction [-]
C
0
= oxygen concentration in atmosphere
[-]
Cp
= average specific heat of coal stock [J/kg/°C]
Cp
air
= specific heat of air [J/kg/°C]
Cp
coal
= specific heat of lump coal/coal seam [J/kg/°C]
d
o
= outer diameter of coal lump/stock [m]
D = effective diffusion coefficient [m
2
/s]
E
= activation energy [J/mole]
g = acceleration of gravity [m/s
2
]
H = height of two-dimensional coal stock [m]
h
c
= height of coal seam [m]
h
r
= height of upper and lower rock sediment layers [m]
K = permeability of coal stock [d] or [m
2
] (1 d= 9.8
-13
m
2
/s)
K
0
= permeability of coal seam [md] or [m
2
] (1md= 9.8×10
-16
m
2
/s)
L = width of coal seam [m]
N
u
= Nusselt number [-]
q = heat generation rate of coal [W/g] or [kW/kg]
Q
m
= cumulative generated heat of coal [J/g] or [kJ/kg]
Q
m
' = cumulative generated heat of coal [J/g] or [kJ/kg]
R = gas constant [J/K/mol]
Re = Reynolds number [-]
r = radius from center in coal lump/stock [m]
r
o
= outer radius of coal lump/stock [m]
t = elapsed time [s]
T = absolute temperature of coal [K]
U = permeable flow velocity in a coal seam due to pressure difference [m/s]
u = natural convection flow velocity in x direction [m/s]
V = accumulated consuming volume of oxygen [cm
3
·O
2
/g] or [m
3
O
2
/s·kg]
v = oxygen volume consumption rate [cm
3
O
2
/s·g] or [m
3
O
2
/s·kg]
W = half width of two-dimensional coal stock [m]
w = natural convection flow velocity in z direction [m/s]
x = horizontal axis [m]
z = vertical axis [m]
α
= effective thermal diffusivity of coal seam or coal stock [m
2
/s]
β = thermal expansion coefficient of air [-]
γ = decay power constant [1/s]
Equivalent Oxidation Exposure-Time for Low Temperature Spontaneous Combustion of Coal
253
ΔH = reaction heat of unit volume of oxygen [J/cm
3
O
2
]
∆q = heat transfer per unit volume of coal stock [kW/m
3
] or [W/cm
3
]
δ = average diameter of lump coals in coal stock [m]
ε = porosity or void fraction [-]
Φ = ratio of effective thickness over coal lump diameter [-]
κ = coefficient of heat transmission from coal seam [m
2
/s]
λ = effective thermal conductivity of porous media [W/(m°C)]
λ
air
= thermal conductivity of air [W/(m°C)]
λ
coal
= thermal conductivity of lump coal [W/(m°C)]
λ
r
= thermal conductivity of rock [W/(m°C)]
μ = air viscosity [Pas]
ξ = internal surface area in unit volume of coal stock [m
3
/m
3
] or [cm
3
/cm
3
]
τ = exposure time [s]
τ* = equivalent oxidation exposure (EOE) time [s]
υ
air
= dynamic viscosity coefficient of air [m
2
/s]
ρ
air
= air density [kg/m
3
]
ρ
coal
= density of lump coal or coal seam [kg/m
3
]
θ = temperature of coal lump or coal stock
[°C]
θ
0
= air or atmospheric temperature and initial coal temperature
[°C]
θ
air
= temperature of internal natural convection air flow in coal stock
[°C]
ψ = stream function of two dimensional natural convection flow
[m
2
/s]
8. References
Brooks, K. & Glasser, D. (1986). A Simplified Model of Spontaneous Combustion in Coal
Stockpiles, Fuel, Vol. 65 Issue 8, pp. 1035-1041, August 1986, Pages 1035-1041, DOI
10.1016/0016-2361(86)90164-X
Brooks, K., Bradshaw, S. & Glasser, D. (1988). Experiment study of model compound
oxidation on spontaneous combustion of coal, Chemical Engineering Science, Vol.
43, Issue 8, pp. 2139-2145, DOI 10.1016/0009-2509(88)87095-7
Carresl, J.N. & Saghafil, A. (1998). Predicting Spontaneous Combustion in Spoil Piles from
Open Cut Coal Mines, Proceedings of Underground Coal Operators' Conference,
Paper 234, February 18- 20 1998, WoUongong,
Ho, Y. S. (2006). Review of Second-order Models for Adsorption Systems, Journal of
Hazardous Materials, B136 (2006), pp. 681–689, ISSN 0304-3894
Koyata, K., Ono, T., Miyagawa, M., Orimoto, M., Koike, Y. & Ota, S. (1983). Development of
the Coal Spontaneous Combustion Predicting System-Structure and Performance of
Predicting System-, CRIEPI Report 283088, Central Research Institute of Electric
Power Industry, Aug. 1983(in Japanese), ISSN 1340-6078
Kevin Brooks, Steven Bradshaw, David Glasser (1988) Experiment study of model
compound oxidation on spontaneous combustion of coal, Chemical Engineering
Science, Vol. 43, Issue 8, pp. 2139-2145, DOI 10.1016/0009-2509(88)87095-7
Kaji, R., Hishinuma, Y. & Nakamura, Y. (1987). Low Temperature Oxidation of Coals-A
Calorimetric Study, Fuel, Vol. 66, Issue 2, February 1987, pp. 154-157, DOI
10.1016/0016-2361(87)90233-X
Kunii, D. & Smith, J.M. (1960). Heat Transfer Characteristics of Porous Rocks, A.1.Ch.E.
Journal, Vol. 6-1 (March 1960), pp.71-78, DOI 10.1002/aic.690060115