Heat Analysis and Thermodynamic Effects Part 3 docx
Bạn đang xem bản rút gọn của tài liệu. Xem và tải ngay bản đầy đủ của tài liệu tại đây (630.41 KB, 30 trang )
Stress of Vertical Cylindrical Vessel for Thermal Stratification of Contained Fluid
49
0.5
0.6
0.7
0.8
0.9
1
4812z/t
(Tm-To)/ΔT
Bi=6.97(FEM)
Bi=6.97(simple)
Bi=2.16(FEM)
Bi=2.16(simple)
Bi=0.72(FEM)
Bi=0.72(simple)
Bi=0.23(FEM)
Bi=0.23(simple)
Tf →
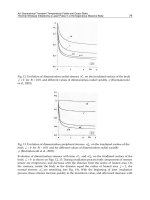
Fig. 6. Vessel temperatures for ramp-shaped fluid temperature
-0.5
-0.4
-0.3
-0.2
-0.1
0
0.1
4 8 12 16 20 24
z/t
S=σ/EαΔT
Szb(FEM)
Szb(simple)
Shm(FEM)
Shm(simple)
Shb(FEM)
Shb(simple)
Bi=2.16, L=8t
Fig. 7. Thermal stresses for ramp-shaped fluid temperature
charts were developed for b/β>0.5 and βL<5. When b/β approaches 0, S approaches 0. S is
approximately inversely proportional to L for βL>5. The maximum stress location, Δz,
represents the outward distance from either end of the stratified layer. In the cold section,
the maximum tensile (positive) stress occurs on the inner surface at z=-Δz, while in the hot
section, the maximum compressive (negative) stress occurs on the inner surface at
z=L+Δz. In addition, by substituting z into Eq. (32), we can calculate the wall-averaged
temperature, which is applicable to the reference temperature for material properties in
structural design.
Heat Analysis and Thermodynamic Effects
50
0
0.1
0.2
0.3
012345
βL
Szb,max
b/β=0.5 b/β=1
1.5 2
3 4
5 6
8 b/β=10
b/β>20
S∝1/L
for βL>5
Fig. 8. The maximum bending stress
0
0.5
1
1.5
012345
βL
βΔZ
0.5
b/β=1
1.5
2
3
4
5
6
8
b/β=10
b/β>20
Location of Szb,max
Fig. 9. Location of the maximum bending stress
Stress of Vertical Cylindrical Vessel for Thermal Stratification of Contained Fluid
51
0
0.1
0.2
0.3
0.4
0.5
012345
βL
Shm,max
b/β=0.5 b/β=1
1.5 2
3 4
5 6
8 b/β=10
20 30
50 100
b/β=∞
S∝1/L
for βL>5
Fig. 10. The maximum membrane stress
0
0.2
0.4
0.6
0.8
0123
βL
βΔZ
0.5
b/β=1
1.5
2
3
4
5
6
8
b/β=10
20
30
50
100
b/β=∞
Location of Shm,max
Fig. 11. Location of the maximum membrane stress
Heat Analysis and Thermodynamic Effects
52
The maximum bending stress, S
zb,max
and its generating location, βΔz, is shown in Fig.8 and
Fig.9, respectively. The maximum membrane stress, S
hm,max
and its generating location, βΔz,
is shown in Fig.10 and Fig.11, respectively. The maximum stress intensity, S
n,max
(=σ
SI,max
/EαΔT) and its generating location, βΔz, is shown in Fig.12 and Fig.13, respectively.
The stress intensity (Tresca's stress σ
SI
) becomes the maximum value at the outer surface,
where σ
z
and σ
h
have opposite signs.
,,
SI z h z h
Max
(40)
A small prominence observed in Fig.13 suggests the transition from the case that S
n,max
occurs near the location of S
hm,max
to the case that S
n,max
occurs near the location of S
zb,max
.
The comparisons of FEM analyses, the proposed charts and the conventional method,
Eq.(38) and (39), for 2 cases, (L=8t, Bi=6.97) and (L=4t, Bi=2.16), are shown in Table 1. The
parameters and S values read out from the charts for the two cases are listed below.
L , Bi , b , β , b/β , βL , S
zb
, S
hm
, S
n
8t, 6.97, 28.96, 2.48 , 11.7 , 0.99 , 0.27 , 0.24 , 0.39
4t, 2.16, 22.41, 2.48 , 9.03 , 0.50 , 0.28 , 0.30 , 0.43
0
0.1
0.2
0.3
0.4
0.5
0.6
012345
βL
Sn,max
b/β=0.5 b/β=1
1.5 2
3 4
5 6
8 b/β=10
20 30
50 b/β>100
S∝1/L
for βL>5
Fig. 12. The maximum stress intensity
It has been demonstrated that the proposed charts are sufficiently accurate. On the other
hand, the conventional method leads to an overestimation. The main error is caused by the
use of the formulas beyond the applicable range, βL>π(
2.5LRt ). The comparison of the
proposed method and the conventional method is shown in S
n
-chart, Fig.14, and the above 2
cases results are plotted on the charts.
Stress of Vertical Cylindrical Vessel for Thermal Stratification of Contained Fluid
53
0
0.5
1
1.5
012345
βL
βΔZ
0.5 b/β=1
1.5 2
3 4
5 6
8 b/β=10
20 30
50 100
b/β=∞
Location of Sn,max
Fig. 13. Location of the maximum stress intensity
We often need to evaluate thermal stresses for observed thermal stratification phenomena in
an engineering field. In most cases, axial temperature profile of interface between stratified
fluid layers can be approximated by exponential curve or parabolic curve as shown in Fig.15
(Moriya et al., 1987; Haifeng et al., 2009; Kimura et al., 2010). We propose the effective width
for such cases as following equation.
0
0.5
1
1.5
012345
βL
Sn,max=σ
SI,max
/(EαΔT)
Conventional method
βL→0, Sn(βL)→∞
Proposed method
Sn(b/β,βL)≦0.508
b/β
Fig. 14. Comparison of the proposed method and the conventional method
Heat Analysis and Thermodynamic Effects
54
Method
Proposed
method
FEM analyses
Conventional
method (38)(39)
Case
Comp
onent
σ
max
(MPa)
Δz
(mm)
σ
max
(MPa)
Δz
(mm)
σ
max
(MPa)
Δz
(mm)
L=8t
Bi=6.97
S
zb
177 149 175 150 300 0
S
hm
157 8 157 10 165 0
S
n
255 28 256 30 375 0
L=4t
Bi=2.16
S
zb
184 234 183 225 600 0
S
hm
196 36 193 35 330 0
S
n
282 73 282 75 750 0
Table 1. Comparison of stress evaluation results
2
12
h
c
T
e
ff f
med
f
T
LTTzdT
T
(41)
L
eff
is nearly equal to the axial width corresponding to 90% of ΔT as shown in Fig.15. It is
found that the thermal stress evaluations using the proposed charts and L
eff
are rather
conservative and good evaluation, through comparisons with the FEM analyses.
z
T
f
T
h
T
c
T
med
0
L
eff
90% of ΔT
observed T
f
data
Fig. 15. Effective width of interface between stratified layers
5. Conclusion
To improve the accuracy of design evaluation methods of thermal stress induced by thermal
stratification, this study have performed the theoretical analyses and FEM ones on steady-state
temperature and thermal stress of cylindrical vessels, and obtained the following results.
1.
The theoretical solution of steady-state temperature profiles of vessels and the
approximate solution of the wall-averaged temperature based on the temperature
profile method have been obtained. The wall-averaged temperature can be estimated
with a high precision using the temperature attenuation coefficient, b.
Stress of Vertical Cylindrical Vessel for Thermal Stratification of Contained Fluid
55
2. The shell theory solution for thermal stress based on the approximate solution of the
wall-averaged temperature has been obtained. It has been demonstrated that the non-
dimensional thermal stress, S=σ/EαΔT exclusively depends on the ratio of coefficients,
b/β, and the non-dimensional interface width between stratified layers, βL.
3.
Easy-to-use charts has been developed to estimate the maximum thermal stress and its
generating location using the characteristic described in (2) above. In addition, a
simplified thermal stress evaluation method has been proposed.
4.
Through comparison with the FEM analysis results, it has been confirmed that the
proposed method is sufficiently accurate to estimate the steady-state temperature and
thermal stress.
5.
It has been demonstrated that the conventional simple evaluation method using the
shell stress solution, which assumes axial temperature profile consisting of a straight
line with the maximum fluid temperature gradient, often leads to an overestimation.
6.
For the convenient application of the proposed method to engineering problems, we
proposed the effective width of interface between stratified layers. The thermal stress
evaluation using the proposed charts with the effective width gives slightly
conservative estimations.
The proposed method enables simple evaluations of steady-state thermal stress induced by
thermal stratification taking the relaxation mechanism of thermal stress into account. This
method would contribute to the reduction of design cost and to the rationalization of design.
6. References
Bieniussa, K.W. and Reck, H. (1996). Piping specific analysis of stresses due to thermal
stratification, Nuclear Engineering and Design, Vol.190, No.1, pp. 239-249, ISSN:0029-
5493.
Carslaw, H.S. and Jeager, J.C. (1959). Conduction of heat in solids, 2
nd
edition, pp. 166-169,
Oxford University Press.
CRC Solutions Corp. & Japan Atomic Energy Agency (2006). FINAS User’s Manual version
18.0, (in Japanese).
Furuhashi, I., Kawasaki, N. and Kasahara, N. (2007). Evaluation Charts of Thermal Stresses
in Cylindrical Vessels Induced by Thermal Stratification of Contained Fluid, (in
Japanese), Transactions of the Japan Society of Mechanical Engineers, Series A, Vol.73,
No.730, pp. 686-693.
Furuhashi, I., Kawasaki, N. and Kasahara, N. (2008). Evaluation Charts of Thermal Stresses
in Cylindrical Vessels Induced by Thermal Stratification of Contained Fluid, Journal
of Computational Science and Technology, Vol.2, No.4, pp. 547-558.
Furuhashi, I. and Watashi, K. (1991). A Simplified Method of Stress Calculation of a Nozzle
Subjected to a Thermal Transient, International Journal of Pressure Vessels and Piping,
Vol.45, pp. 133-162, ISSN:0308-0161.
Haifeng, G. et al. (2009). Experimental Study on the Fluid Stratification Mechanism in the
Density Lock, Journal of NUCLEAR SCIENCE and TECHNOLOGY, Vol.46, No.9, pp.
925- 932, ISSN:0022-3131
Kimura, N. et al. (2010). Experimental Study on Thermal Stratification in a Reactor Vessel of
Innovatic Sodium-Cooled Fast Reactor – Mitigation Approach of Temperature
Gradient across Stratification Interface -, Journal of NUCLEAR SCIENCE and
TECHNOLOGY, Vol.47, No.9, pp. 829- 838, ISSN:0022-3131
Heat Analysis and Thermodynamic Effects
56
Katto, Y. (1964), Conduction of Heat, (in Japanese), (1964), p.38, Yokendo.
Moriya, S. et al. (1987). Effects of Reynolds Number and Richardson Number on Thermal
Stratification in Hot Plenum, Nuclear Engineering and Design, Vol.99, pp. 441-451,
ISSN:0029-5493.
Morse, P.M. and Feshbach, H. (1953). Methods of Theoretical Physics, Part.1, pp. 710-730,
McGraw-Hill.
Timoshenko, S.P. and Woinowsky-Krieger, S. (1959). Theory of plates and shells, 2nd edition,
pp. 466-501, McGraw-Hill.
4
Axi-Symmetrical Transient Temperature Fields
and Quasi-Static Thermal Stresses Initiated by a
Laser Pulse in a Homogeneous Massive Body
Aleksander Yevtushenko
1
, Kazimierz Rozniakowski
2
and Мalgorzata Rozniakowska-Klosinska
3
1
Bialystok University of Technology
Faculty of Mechanical Engineering
2
Technical University of Lodz Faculty of Technical Physics
Information Technology and Applied Mathematics
3
Technical University of Lodz
Poland
1. Introduction
In the present chapter the model of a semi-infinite massive body which is heated through
the outer surface by the precised heat flux, is being under study. This heat flux has the
intensity directly proportional to the equivalent laser irradiation intensity. Heating of
materials due to its surface irradiation by the high-power energy fluxes, which takes place
during working of the laser systems, can be modelled in a specific conditions as the
divided surface heat source of defined power density or heat flux of defined intensity
(Rykalin et al., 1975).
Laser systems are an unusual source of electromagnetic irradiation of unique properties.
These properties differ essentially from the relevant characteristics of irradiation generated
by traditional sources, natural and artificial one. Laser irradiation has specific,
distinguishing features: high level of spatial and time coherence, high level of
monochromaticity, low divergence, high spectral intensity and continuous or impulse
emission process. High level of spatial coherence gives possibility to focusing laser
irradiation on the surfaces of a few to several dozens squared micrometers in a size, which
correspond to very high values of power intensity even 10
8
–10
12
W/m
2
(10
4
–10
18
J/m
2
or
10
23
fotons/cm
2
). Effectivity of local surface heating mentioned above depends on: laser
pulse duration, laser pulse structure (shape) and on irradiation intensity distribution. Three
specific laser pulse structures are usually under consideration: rectangular-shape pulse,
triangular-shape pulse and pulse shape approximated by some defined function. Likewise
to the laser pulse structure, the spatial pulse structure (distribution of laser irradiation in a
plane normal to the beam axis) is also complex and challenging for precised analytical
description. In approximation the spatial distribution of laser irradiation can be described by
the following relations: gaussian distribution (takes place during the working of laser beam
in the single-mode regime), mixed (multi-modal) or uniform distribution. In addition, laser
heat source shape can be changed by the electromagnetic or optical methods. Hence, the
Heat Analysis and Thermodynamic Effects
58
optimization of the source shape problem appears on the basis of various optimisation
criteria as well as the minimal losses on apparatus criterion.
In the former industrial practice, mainly the gaussian or uniform intensity distribution were
applied. Various in nature thermal effects are present during industrial laser materials
processing such as: laser hardening, laser surface modifications of metals and alloys.
Nowadays the most significant role in the technological operations plays such formed laser
beam which maximum power is achieved not in the centre but close to the edge of the
heated zone (Hector & Hetnarski, 1996). That is why, in the emerging process of the new
effective laser technologies, it is strongly reasonable to determine the analytical solutions
and to conduct numerical analysis for the boundary value problem of transient heat
conduction and quasi-static thermal stresses, which are crucial in calculations of:
the effective absorption coefficient,
the specific time point when surface melting occurs due to laser beam heating,
the heating velocity and cooling,
the controlled laser thermo cracking process (Lauriello & Chen, 1973; Yevtushenko et
al., 1997),
the other features of initiated temperature and thermal stresses fields.
2. Influence of intensity spatial distribution of laser beam on a temperature
field in the irradiated massive body (semi-infinite)
2.1 Problem statement
Laser irradiation interaction of
48 2
10 10 W / m power intensity on metals is equivalent to
heating them by heat flux of defined intensity (Rykalin et al., 1975). If the following
conditions are fulfilled:
the power intensity generated by the laser is not sufficient to melt and evaporate the
superficial layer,
the losses because of heat emission and convection from a surface body are negligible
the thermo-physical properties do not depend on temperature,
then the axisymmetrical boundary value problem of heat conduction for semi-infinite body
in cylindrical coordinates system ( ,rz) with the beginning in the centre of heated surface,
can be considered in the form:
22
22
11
TTTT
rr kt
rz
, 0, 0, 0rzt, (1)
(,,0) 0Trz
,
0, 0rz
, (2)
() ( ), 0, 0, 0
s
T
KAqrHttrzt
z
, (3)
22
(,,) 0, , 0Trzt r z t. (4)
The uniform distribution of heat flux intensity in a circle of
a radius, can be described by the
formula:
Axi-Symmetrical Transient Temperature Fields and Quasi-Static
Thermal Stresses Initiated by a Laser Pulse in a Homogeneous Massive Body
59
0
() ( ), 0qr q Ha r r
(5)
and for the mixed distribution – multimodal one, the heat flux intensity can be expressed by
(Hector & Hetnarski, 1996):
2
2
() [ (1 ) ] , 0
c
Kr
fc
qr q f f Kr e r
, (6)
where
c
K – concentration coefficient,
f
q – characteristic value of heat flux intensity q ,
01f – parameter, which characterized the irradiation intensity distribution in a plane
normal to the laser beam axis. For
1f
the normal (gaussian) distribution and for 0f
doughnut – toroidal distribution, is obtained.
Fig. 1. Laser irradiation heating model and area shape visualization of phase transition for
metals
Both distributions of laser irradiation intensity (5) and (6) are related by the following
concentration coefficient (Rykalin et al., 1975)
2
cf
KBa
. (7)
The numerical factor
f
B in the Eq. (7) can be found from the condition below (Hector &
Hetnarski, 1996):
1
1 100% 63.2%
f
Q
Qe
, (8)
where
Q – total irradiation power,
f
Q – irradiation power which arrives to the circle of
a radius and can be easily derived after taking into consideration the distribution (6),
consequently these two values can be substituted into Eq. (8). As the result the non-linear
equation will be received for
f
B in the form:
1
[1 (1 ) ] 0.3678.
f
B
f
fB e e
(11)
A numerical analysis shows that dependence of the
f
B roots of Eq. (11) with respect to the
f
parameter is nearly linear:
0
(1 )
f
BB
ff
, where
0
2.1462B
is the value of
f
B at
Heat Analysis and Thermodynamic Effects
60
0f . At 1f from Eq. (6) is received the obvious result 1
f
B
(Rykalin et al., 1975). By
comparizing the irradiation intensity of uniform distribution (5) with the irradiation
intensity of general case distribution (6) it was found
0
.
ff
q
B
q
(12)
By introducing dimensionless variables and parameters
0
0
22
,, , ,
s
s
qa
kt
rzkt
T
aa K
aa
,
0
T
T
T
, (13)
and using relations (7) and (12) the boundary value heat conductivity problem (1)-(4) can be
rewritten in the form:
22
22
1
TTTT
,
0, 0, 0
, (14)
(,,0) 0T
, 0, 0,
(15)
*
()( )
s
T
Aq H
,
0, 0, 0
, (16)
22
(,,) 0, , 0T
, (17)
where
2
*2
() [ (1 ) ]
f
B
ff
qBf fBe
, (see Fig. 2). (18)
00.
5
11.522.
5
0
0.2
0.4
0.6
0.8
1
q*
Fig. 2. Laser irradiation distribution – a function
*
()q
for three different
f
parameter values
(solid line corresponds to the value of
1f
, dashed line to 0.5f
, dot-dashed line to 0f ).
Axi-Symmetrical Transient Temperature Fields and Quasi-Static
Thermal Stresses Initiated by a Laser Pulse in a Homogeneous Massive Body
61
2.2 Problem solution
The solution of the boundary value heat conduction problem (14)-(17), which is obtained by
applying the integral Hankel transforms with respect to the radial variable
r and Laplace
transform with respect to time
t , has the following form:
(0) (0)
(,,) (,,) () (,, )( ),
ss
TTHT H
0, 0, 0
. (19)
(0)
0
0
(,,) ()(,,) ( )TA Jd
, 0, 0, 0
, (20)
where
2
2
4
*
0
0
1
() () ( ) (1 )1 , 0
24
f
B
f
qJ d f f e
B
(21)
and
1
( , , ) erfc erfc
2
22
ee
. (22)
During transient heating of the massive body, the maximum value of temperature on the
body surface is achieved at the moment
s
tt
(
s
) – switching laser system off, whereas
inside the body at
hs
tt t
(
hs
, where
2
Δkt/a
). When laser system is
switched off, then laser heating source is simply cut off – as a consequence the fast cooling
of the body takes place.
00.511.522.53
0
0.1
0.2
0.3
0.4
0.5
0.6
Fo
T*
Z=0
0.4
Fig. 3. Evolution of dimensionless temperature
*
0
/( )TTAT on the surface in the center of
heated zone (
0, 0
) and inside the body ( 0, 0.4
) at 0.6
s
(Yevtushenko et
al., 2009).
Heat Analysis and Thermodynamic Effects
62
Independently from the heat source intensity distribution, the retardation time t (
) is
increasing fast with the distance from the heated surface. For a fixed value of depth from the
working surface this retardation time t
decreases with the increase of the
f
parameter.
00.
5
11.
5
22.
5
0
0.1
0.2
0.3
0.4
0.5
0.6
T*
Z=0
0.4
Fig. 4. Evolution of dimensionless temperature
*
T along
variable on the body surface
(0)
and inside the body (0.4)
at 0.6
s
(Yevtushenko et al., 2009).
The irradiation intensity distribution in a plane normal to the laser beam axis, see Eq.(18),
affects essentially the character of surface temperature distribution. Maximum value of
temperature for normal distribution of heat flux intensity is attained at the center of heated
zone
0,r and for a doughnut distribution is attained near a boundary of the heated zone
0.6ra (see Fig. 4).
0 0.3 0.6 0.9 1.
2
1.5
0
0.1
0.2
0.3
0.4
0.5
0.6
T*
Z
Fig. 5. Evolution of dimensionless temperature
*
T
along symmetry axis
0
at
0.6
s
(Yevtushenko et al., 2009).
Axi-Symmetrical Transient Temperature Fields and Quasi-Static
Thermal Stresses Initiated by a Laser Pulse in a Homogeneous Massive Body
63
The effective depth of heating (the distance from the boundary body surface for which
temperature value equals 5% of the maximum value of temperature achieved on the surface)
is independent on the form of intensity distribution of the incident heat flux and for
dimensionless retardation time
0.6
s
is equal in approximation 1.5a (see Fig. 5). At work
(Ashcroft & Mermin, 1986) was shown that for laser systems working in the continuous
regime the above quantity does not exceed the 5a value (Matysiak et al., 1998). This
conclusion confirms the results shown in the present chapter thanks to the numerical
calculations done with use of formulas (19)-(22) at
s
and 100
(dimensionless time,
when stationary temperature is achieved).
2.3 Special cases of the obtained solution
At ()
ss
t
from Eq. (19) is received that
(0)
(, ,) (, ,)TT
and formula (20)
corresponds with solution presented in paper (Ready, 1997) for laser operated in the
continuous regime and irradiation of semi-infinite surface. If additionally
()t
,
then from Eq. (22) follows that ( , , ) e
and then stationary temperature can be
derived from the relation:
(0)
0
0
(,,) () ( ) , 0, 0TAeJd
. (23)
By substituting to the Eq. (23) 0
, the stationary temperature on surface for semi-infinite
surface can be found
(0)
0
0
(,0,) ()( ) , 0.TAJd
(24)
Substituting function
()
( 21) under integral and with consideration of integrals:
2
4
0
0
()
f
B
eJ d
and
2
4
2
0
0
()
f
B
eJ d
with use of integrals table (Prudnikov et al., 1998) the solution for stationary temperature on
semi-infinite surface was received in the following form:
2
222
22
2
001
1
(,0, ) 1
222 22
f
B
f
fff
ff
B
BBB
f
Tr A e I B I B I
. (27)
In similar way the distribution of the stationary temperature along axis 0
from the (23)
solution was found:
2
(0)
2
1
(0, , ) (1 ) (1 ) (1 ) erfc( ) .
22 2
f
f
B
f
B
TAfffeB
(28)
Heat Analysis and Thermodynamic Effects
64
From relations (27) and (28) follows, that stationary temperature on the body surface, in the
center of heated zone, reaches the value:
(0)
(1 )
(0,0, )
4
f
f
TAB
. (29)
For normal distribution of irradiation intensity (
1f
,
1
f
B
) from Eq. (29) the following
result is obtained (Bardybahin & Czubarov, 1996) :
(0)
(0,0, ) 0.8862
2
TAA
(30)
and for doughnut mode structure distribution ( 0, 2.1462)
f
fB
(0)
(0,0, ) 0.6492
2
f
B
TA A
. (31)
It should be underlined that maximum of stationary temperature is achieved not for
gaussian irradiation intensity distribution in a plane normal to the laser beam axis (
1f ),
but for “almost gaussian” distribution
(0.93)f
, when
(0)
(0,0, ) 0.8889TA
.
2.4 Time point determination when surface melting occurs due to laser beam heating
On the basis of achieved solutions (19)-(23), the time point determination when surface
melting occurs due to laser beam heating, can be done. It is known that for uniform Eq. (5)
and normal Eq. (6) (for
1f
) distribution of laser heat flux intensity, the maximum
temperature is achieved on the surface in the centre of the heated zone. For laser systems
working in the continuous generation regime, from solutions (20)-(23) at
s
t (
s
) is
derived in general
(0)
0
(0,0, ) ( ) ( )TAerfd
, (32)
In case of uniform distribution (5) the function
1
() ()/J
(Matysiak et al., 1998) and
then (32) formula becomes
0
1
*)0(
)(
)(
),0,0(
derf
J
T
. (33)
By differentiation of (33) solution along
variable, the following is found (Prudnikov
et al., 1998):
22
2
1
(0)*
1
8
11/2
2
0
21
()
8
dT
AJ e d e I
d
. (34)
According to work (Abramowitz & Stegun, 1979):
Axi-Symmetrical Transient Temperature Fields and Quasi-Static
Thermal Stresses Initiated by a Laser Pulse in a Homogeneous Massive Body
65
1/2
2
Ix shx
x
, (35)
then (34) formula can be rewritten in the form
2
1
(0)*
4
2
1
dT
A
e
d
. (36)
By integration (36) formula along
variable with condition consideration
(0)*
(0,0,0) 0T ,
the formula of dimensionless temperature evolution in the centre of the heated zone
(0, 0)
is derived:
1
(0)*
4
1
(0,0, ) 2 1
2
TAeerfc
. (37)
The respective formula for gaussian (normal distribution) laser heat flux intensity got the
form (Aulyn et al., 2002):
(0)*
11
(0,0, )
2
2
TAarctg
(38)
Dimensionless temperatures
(0)*
(0,0, )T
, (37) and (38), increase in monotone mode with
increase of irradiation time and reach the asymptotes respectively: 1 and
/2 0.8862
(see Fig. 6).
Fig. 6. Evolution of dimensionless temperature
(0)*
/TA in the centre of heated zone for
laser systems working in the continuous generation regime (Yevtushenko et al., 2009).
012345
0
0.15
0.3
0.45
0.6
0.75
0.9
T*
Fo
Heat Analysis and Thermodynamic Effects
66
By making assumption that at some moment
, temperature in the centre of the heated
zone reaches the melting temperature of material, then:
(0)*
0
(0,0, ) /
m
TTAT
, (39)
where temperature
(0)*
(0,0, )T
is derived from formula (37) or (38).
The right side of the Eq. (39) includes material characteristic features such as: thermal
conductivity
K and melting temperature
m
T , the laser beam characteristic parameters: heat
flux intensity
0
q , laser beam radius a and effective absorption coefficient A . If all the
values are known then from Eq. (39) the dimensionless boundary time point of melting
beginning can be found. By choosing for a specific material the appropriate laser beam
parameters, the melting start point can be calculated and damage of a surface as a result of
intensive melting can be avoided.
In work (Rozniakowski, 2001), for sample of steel St45:
33.5 /( )KWmK
,
62
15 10 /kms
, 1535
m
TC
,
heated by the Nd:YAG laser beam in system KWANT 15 ( 0.64amm
radius, laser pulse
duration
2
s
tms
),
92
0
0.7 10 /
q
Wm , when effective absorption coefficient is 50%A
(Rozniakowski,
2001),
the below calculation were conducted with use of Eqs. (13), (39) and numerical results on
Fig. 6. From Eq. (13) the
5
0
0,133 10TKwas determined. When the right side of Eq. (39)
reaches the value
0
/( ) 0.2308
m
TAT
, then on Fig. 6 the dimensionless time 0.043
for
the uniform distribution and respectively 0.047
for the normal distribution can be found.
These dimensionless time values have respective real time values: 1.17tms
and
1.28tms .
2.5 Determination of laser irradiation effective absorption coefficient method
It should be underlined that maximum temperature value (19) on the body surface is
achieved at the moment of laser switiching off
s
tt
()
s
(Fig. 3). In order to determine
the monochromatic effective absorption coefficient
A
, the value of the retardation time
t ()
is needed to be known (its value increases quickly with the distance from laser
irradiated surface of the body). Retardation time
t
()
can be determined from the
condition of the maximum temperature reached inside the semi-infinite body in the point of
(,)rz (,)
at
h
tt
()
h
:
(,,)
0
T
h
,
0, 0
. (40)
Differentiating equations (19)-(22) with respect to dimensionless time
we obtain
s
(0) (0)
(,,) (,,) (,, )
() ( )
s
TT T
AH H
, (41)
where
Axi-Symmetrical Transient Temperature Fields and Quasi-Static
Thermal Stresses Initiated by a Laser Pulse in a Homogeneous Massive Body
67
2
2
(0)
4
0
0
(,,)
1
() ( )
T
eJd
. (42)
Taking into account the form of function
()
given by (21), the Eq. (42) can be written as:
2
(0)
4
12
(,,)
[ (,) (1 ) (,)]
2
T
e
fM f M
, (43)
where (Prudnikov et al., 1998)
2
2
1
4
14
10
0
2
(,) ( )
14
MeJde
, (44)
and
)
2
1
22
4
20 1
0
1
(,) 1 ( ) 1 1 (,
41414
MeJd M
. (45)
Substituting functions
(,)
i
M
, 1,2i
(44), (45) into Eq. (43), we got:
2
2
2
(0)
14 4
3
[(1 4 )( 4 ) (1 ) ]
(,,)
(1 4 )
f
f
B
B
ff f f
f
BBfB fB
T
e
B
. (46)
By substituting the partial derivative (46) into Eq. (41), from condition (40) the nonlinear
functional equation with respect to the dimensionless retardation time
is obtained:
22
34
()
3
12
()
CCZ
f
ССDe
, 0, 0Z
, (47)
where
s
1
1
h
C
,
14
2
4
f
s
f
h
B
C
B
,
s
(1 4 )(1 4
3
4
)
f
ff
h
B
C
BB
,
s
4
4
h
C
, (48)
and
14
14
2
2
(1 ) ( )( 4 )
()
(1 ) ( )( 4 )
ff
h
f
h
f
fff
fB B f B
D
fB B f B
. (49)
By applying logarithm on (47) we have the following results:
22 3 1
34 12
ln[ ( )]
f
CC СС D
0, 0
. (50)
Heat Analysis and Thermodynamic Effects
68
Eq. (50) defines the isotherm of maximum temperature for a given values of
s
and
(see
Fig. 7). For the case of normal distribution of irradiation intensity (
1f
, 1
f
B
), the ( )
f
D
function (49) is independent on dimensionless radial variable
and can be expressed by:
(1 4 )
14
2
1
22
2
1
()
h
f
DD
C
, (51)
where
2
C is given by (48). By using relation (51), the Eq. (50) can be rewritten in the form:
22 1
34 12
ln[ ]CC СС
,
0, 0
. (52)
and consequently as:
22
22
1, , 0 ,
(53)
where
2
12
3
ln( )
,
CC
C
2
12
4
ln( )CC
C
. (54)
By analysing the Eqs. (53), (54) it can be found that the isotherm of maximum dimensionless
temperature for the normal (gaussian) distribution of irradiation intensity has the form of
half-ellipse (see Fig. 7) with the axes given by (53) –
h
ra
,
h
za
. In case of the toroidal
(ring) distribution of the heat flux, the isotherm takes the form of curve with maximum
shifted from axial axis. On symmetry axis 0
, the Eq. (52) has form:
21
412
ln[ ]CCC
. (55)
00.511.522.5
0.5
0.4
0.3
0.2
0.1
0
Z
Fig. 7. Isotherms of maximum dimensionless temperature
max
T
at 0.672
s
and 0.0054
(Yevtushenko et al., 2009).
Axi-Symmetrical Transient Temperature Fields and Quasi-Static
Thermal Stresses Initiated by a Laser Pulse in a Homogeneous Massive Body
69
By substituting in Eq. (55) the coefficients
1
C ,
2
C and
4
C respectively (50), the following is
derived:
1/2
1
4( )
14
ln
14( )
s
h
ss s
. (56)
From (56) equation, when retardation time
and heating time
s
are known, the
maximum dimensionless layer depth
h
in irradiated material, where phase transitions
occur, can be found. In the contrary case, when maximum dimensionless layer depth
h
in
irradiated material is known (the temperature
T exceeded some critical value
h
T and phase
transition took place), then from Eq. (56) the dimensionless retardation time
can be
found, too. From condition
(,, )
hh
Trzt T
, where T is given from solution (19)-(22), the
following formula for determination of the effective absorption coefficient, is obtained:
*
0
h
T
AA
T
, (57)
where
1
*
0
0
()[(,,) (,, )]( )
hs h h
AJd
, (58)
and coordinates
(,)
hh
fulfill the Eq. (53).
2.6 Experimental results
Some results of steel 45 type hardening by laser irradiation can be found in work
(Rozniakowski, 2001). The application of determination of effective absorption coefficient
method is also there included on the basis of effective reflection coefficient
R ( 1AR ).
Characteristic features of mentioned above material and laser system applied in the
experiment are gathered in Table 1. The steel 45 type sample had rounded shape of 20mm
diameter and 6mm in thickness, the percentage of other elements had following
distribution: C–0.42
0,50%, Mn–0.5
0,8%, Si–0.17
0.37%, P–0.040%, S–0.045%. Laser
system was working in free generation regime (Nd:YAG laser type,
1.06μm
, 1.5J
i
E
and laser pulse time duration
2ms
s
t
).
parameters
material
K ,
[Wm
1
K
1
]
5
10k ,
[m
2
s
1
]
h
T ,
[K]
h
z
,
[μm]
steel 45 33.50 1.50 1123 40
Table 1. Characteristic features of steel 45 type.
Steel sample was heated locally by laser irradiation beam in 10 different points with
changing irradiation intensity. Subsequently, the metalographic cross-section were done for
Heat Analysis and Thermodynamic Effects
70
the irradiated areas. By using the EPITYP-2 metalographic microscope and SEM TESLA
BS300 the maximum hardened layer depth
h
z were measured (see Fig. 8).
Fig. 8. Metalographic cross-section of laser irradiated steel sample.
The diameters of hardened depths were much larger than
h
z
, it was also observed the
melting point starts when
82
0
8.5 10 W/mq
where:
0
2
i
s
E
q
at
. (59)
Moreover, it was found that for
82
0
5.8 10 W/mq
, the hardened layer depth
h
z
equals
40μm . By using Eq. (59) the radius of irradiated area can be found as 0.64mma
and
consequently the dimensionless irradiation time
s
. Hence from Eq. (56) at /
hh
za
the
dimensionless retardation time
, was obtained (see Table 2). For such dimensionless
coordinates values
(0,)
hh
and dimensionless time values (, )
s
, from Eq. (58) the
parameter
4.5A
was calculated, and from Eq.(57) the real effective absorption coefficient
A was found, see comparison of the experimental and analytical values gathered in Table 2,
(Rozniakowski, 2001).
parameters
material
5
0
10T
,
[K
1
]
h
,
[-]
s
,
[-]
3
10
[-]
A
experimental
A
from Eq. (57)
steel 45
0.111
0.062
0.073
0.33
30%
50%
41.8%
Table 2. Comparison of the experimental and analytical values of the effective absorption
coefficient
A
.
3. Quasi-static thermal stresses caused by laser irradiation heating
3.1 Non-stationary temperature field
By using variables and parameters (13), the axisymmetrical boundary value problem of
transient heat conduction for semi-infinite body can be considered as:
22
22
1
TTTT
,
0, 0, 0
, (60)
(,,0) 0T
,
0, 0,
(61)
Axi-Symmetrical Transient Temperature Fields and Quasi-Static
Thermal Stresses Initiated by a Laser Pulse in a Homogeneous Massive Body
71
*
()()
T
BiT q H
, 0, 0, 0
, (62)
22
(,,) 0, , 0T
, (63)
where from Eq. (18) for
1f
following is given
2
*
()
q
e
,
0
. (64)
By applying the Hankel integral transformation along the radial
(Sneddon, 1972)
0
0
,, ,,TTJd
, (65)
to the boundary heat conduction problem (60)-(63) then it is denoted
2
2
2
TT
T
, (66)
,,0 0T
, (67)
,, 0T
, (68)
,0
T
BiT
Z
, (69)
where after consideration of Eq. (64)
2
2
4
0
0
1
2
eJ d e
. (70)
When applying Fourier integral transformation with generalized trigonometric kernel along
variable to the boundary value problem (66)-(69) (Sneddon, 1972) then
0
2
(,,) (, ,) (, )TTNd
, (,) cos( ) sin( )NBi
. (71)
As a result of transformation the Cauchy problem is obtained in the form:
22
2
() (),0
dT
T
d
, (72)
(,,0) 0T
. (73)
Solution of the ordinary differential equation (72) with initial condition (73) has form
Heat Analysis and Thermodynamic Effects
72
0
(,,) () (, ,)T
, (74)
where
22
()
0
22
2
(, ,) 1
e
. (75)
By applying to the solutions (74), (75) below listed Fourier and Hankel inverted integral
transformations (Sneddon, 1972):
22
0
(,)
2
(, ,) (, ,)
N
TTd
Bi
, (76)
0
0
(, ,) (, ,) ( )TTJd
, (77)
the following will be obtained
0
0
,, ,,TJd
, 0, 0, 0
, (78)
where
22
22
1
, , erfc erfc
2
22
erfc
2
Bi
Bi
ee
Bi Bi
Bi e
eBi
Bi
. (79)
It should be underlined that at Bi
, function (, ,)
(79) equals
1
,, erfc
4
2
Bi
Bi e Bi
Bi
. (80)
In case, when convection cooling does not occur on the semi-infinite surface of the body
(0Bi ), function
(, ,)
(79) gets form (81). At
from solution (78), (79) the
stationary temperature in the centre of heated zone 0
, 0
, is obtained:
2
4
max
0
0,0,
22
Bi e
Td
Bi
. (81)
From solution (81) at 0Bi the maximum temperature value without convection heat
exchange, can be found (89).
3.2 Quasi-static thermal stresses
Non-uniform temperature distribution (78), (79) initiates in the semi-infinite surface of the
body a field of thermal stresses. Thermal displacement
i
u which occurs in the elastic body
Axi-Symmetrical Transient Temperature Fields and Quasi-Static
Thermal Stresses Initiated by a Laser Pulse in a Homogeneous Massive Body
73
as the result of temperature field interaction, without mass forces, can be found from
differential equations system in partial differentials (Nowacki, 1986; Timoshenko & Goodier,
1970):
,, ,
12(1)
12 12
i
jj j j
iti
uu T
. (82)
By introducing thermoelastic potential
),,(
with use of formulae (Nowacki, 1986):
11
,
rz
uu
aa
, (83)
then equations system (82) can be rewritten in the form of equivalent Poisson equation:
22
0
t
aTT
, (84)
where
1
1
tt
, and dimensionless temperature ( , , )T
is given by (78), (79).
In case, when thermoelastic potential
),,(
is known, then respective thermal stresses
can be derived from formulae (Nowacki, 1986):
2 22
222
22 2 22 2
22122
,,,.
rr zz rz
aaaa
(86)
Solution of the Poisson equation (84) obtained with the use of Hankel integral
transformations of zero order and Laplace integral transformations, which fulfilled the
boundary condtions:
0
zz
2
2
2
0
, 0,
0
, 0
,
0
rz
2
0
, 0,
0
, 0
, (87), (88)
0
r
u
0
, 0,
0
, 0
,
0
r
u 0
, 0
z
u 0
,
22
. (89), (90)
has form
00
0
,, ,,
t
TJd
, (91)
where
