Heat and Mass Transfer Modeling and Simulation Part 3 pot
Bạn đang xem bản rút gọn của tài liệu. Xem và tải ngay bản đầy đủ của tài liệu tại đây (449.67 KB, 20 trang )
The Gas Diffusion Layer in High Temperature Polymer Electrolyte Membrane Fuel Cells
31
0.10.20.30.40.50.60.70.80.91.01.1
0.0
0.1
0.2
0.3
0.4
0.5
0.6
0.7
0.8
0.9
without MPL
10% Teflon in the MPL
20% Teflon in the MPL
40% Teflon in the MPL
60% Teflon in the MPL
-Z'' / ohm cm
2
Z' / ohm cm
2
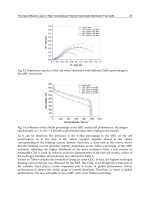
Fig. 13. Impedance spectra of the cell when electrodes with different Teflon percentage in
the MPL were used
0 200 400 600 800 1000 1200
0
100
200
300
400
500
600
700
800
900
without MPL
10% Teflon in the MPL
20% Teflon in the MPL
40% Teflon in the MPL
60% Teflon in the MPL
Cell voltage / mV
Current density / mA cm
-2
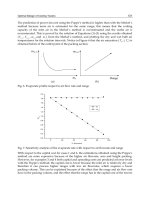
Fig. 14. Influence of the Teflon percentage in the MPL on the cell performance. Hydrogen
stoichometry at 1 A cm
-2
= 1 (Points: experimental data; lines: fitting to the model)
As it can be observed, the influence of the Teflon percentage in the MPL on the cell
performance, as in the case of the carbon support, appears almost at the values
corresponding to the limiting current density. However, a close look at the curves shows
that the limiting current densities slightly diminishes as the Teflon percentage in the MPL
increases, reflecting the higher limitation of the mass transport when a less porous or
permeable GDL is used. In order to assist for interpretation of the fuel cell results, values of
the hydrogen limiting current density are collected in Table 6.
Values in Table 6 display the benefits of using an open GDL. In fact, the highest hydrogen
limiting current density was obtained for the MPL free GDL, even though the protection of
the catalytic layer plays a more important role in terms of global performance (lower
performance in almost the whole range of current densities). Therefore, in terms of global
performance, it is also advisable to use a MPL with a low Teflon percentage.
Heat and Mass Transfer – Modeling and Simulation
32
PTFE content / % j
HL,h
y
dro
g
en
/ mA cm
-2
Without MPL 1.000,8
10 1,000.4
20 990.2
40 980.9
60 964.9
Table 6. Limiting current density for the hydrogen oxidation for the different Teflon
percentages of the MPL
3.2.2 Influence of the carbon content in the microporous layer
For this study, microporous layers with a Teflon percentage of 10% were prepared, on a
total weight base, varying the carbon loading (0.5, 1, 2 and 4 mg cm
-2
).
a) Physical characterisation
Figure 15 shows the pore size distribution of the gas diffusion layer for the different carbon
loadings in the MPL, along with the carbon support. Results are shown focusing on the
macroporous and microporous regions.
10 30 50 70 90
0
1
2
3
4
5
6
without MPL
0.5 mg C / cm
2
1 mg C / cm
2
2 mg C / cm
2
4 mg C / cm
2
Specific pore volume /
ml g
-1
m
-1
Pore size/ m
0.01 0.1 1
0.0
0.1
0.2
0.3
0.4
0.5
0.6
Specific pore volume /
ml g
-1
m
-1
Pore size / m
(a) (b)
Fig. 15. Specific pore volume for the GDLs with different carbon loadings in the MPL in: (a)
the macroporous region, and (b) in the microporous layer (Lobato et al., 2010, with
permission of Wiley Interscience)
As it can be observed, the macroporosity of the GDL diminishes with the addition of more
carbon to the MPL. As previously commented for the Teflon percentage, part of the MPL
will penetrate inside the macroporous carbon support, and therefore, will occlude part of
the macropores. Macroporosity decreases until a carbon loading of 2 mg cm
-2
. Above this
value, no more MPL carbon particles seem to penetrate into the carbon support, and
therefore, the MPL is fully fulfilling its protective role since it is expected that no catalytic
particle will penetrate inside the carbon support. Contrarily, the microporous region
increases with the carbon content of the MPL. Logically, more microporosity is introduced
in the system the higher is the carbon content (Park et al., 2006).
Overall porosity, mean pore size and tortuosity of the GDL with different carbon loading in the
MPL can be estimated from the pore size distribution. The corresponding values are
collected in Table 7.
The Gas Diffusion Layer in High Temperature Polymer Electrolyte Membrane Fuel Cells
33
Carbon loading / mg cm
-2
Porosity / %
Mean pore diameter /
m
Tortuosity
Without MPL 73.9 36.69 3.363
0.5 72.2 34.32 3.502
1 72.2 33.23 3.717
2 69.2 32.10 4.152
4 67 30.50 4.620
Table 7. Values of the overall porosity, mean pore size diameter and tortuosity for the GDLs
with different carbon loadings MPL
As it can be seen, the overall porosity and the mean pore size of the GDL decrease with the
carbon loading. The diminution of the macroporosity and the increase of the microporosity
of the GDL explain the reduction of the overall porosity and mean pore size. In the case of
the tortuosity, the higher is the carbon loading, the thicker the MPL layer becomes, making
more difficult the access of the gases to the catalytic layer.
Gases/water vapour permeability for the GDLs with different carbon loading in the MPL are
shown in Figure 16.
0.0 0.5 1.0 1.5 2.0 2.5 3.0 3.5 4.0 4.5
0
2
4
6
8
10
12
10
12
permeability / m
2
Carbon loading in the MPL / mg cm
-2
H2
O2
Air
Water vapour
Fig. 16. Gases and water vapour permeability of the GDLs with different carbon loadings in
the MPL (horizontal lines represent the carbon support permeability)
As it can be seen, gases/water vapour permeability decreases with the carbon loading in the
GDL. This is an effect of the reduction of the macroporosity, and the increase in the
microporosity, which makes more difficult the transport of the gases reactant, and the water
vapour through the GDL (Wang et al., 2006). On the other hand, the decay in the
permeability becomes less noticeable the higher is the carbon loading in the MPL. This
agrees with the previously mentioned fact that a lower amount of carbon particles from the
MPL penetrates in the carbon support, so that the results reflect the effect of the increase in
the microporosity. As in the previous cases, the molecular size of the gases determines the
values of the gas permeability, except for the case of the extensively commented water
vapour.
As in the case of the influence of the Teflon percentage in the MPL, the simplest GDL,
without microporous layer, seems to be the most adequate disposition in terms of mass
Heat and Mass Transfer – Modeling and Simulation
34
transport. However, in terms of fuel cell performance, other factors, as next shown, have to
be taken into account. As it has been commented throughout this chapter, the MPL fulfils a
very important protective role of the catalytic layer.
b) Electrochemical behaviour
b.i) The carbon loading in the cathodic MPL
Figure 17 shows the variation of the cell performance for the GDLs with different carbon
loadings in the MPL. Points correspond to the experimental data, whereas lines show the
fitting of these data to the semi-empirical model.
(a) (b)
0 300 600 900 1200 1500
0
100
200
300
400
500
600
700
800
900
without MPL
0.5 mg cm
-2
C in the MPL
1 mg cm
-2
C in the MPL
2 mg cm
-2
C in the MPL
4 mg cm
-2
C in the MPL
Cell voltage / mV
Current density / mA cm
-2
0 200 400 600 800 1000 1200
0
100
200
300
400
500
600
700
800
900
Cell voltage / mV
Current density / mA cm
-2
Fig. 17. Cell performance of the electrodes prepared with different carbon loading in the
MPL, (a) Oxygen stoichometry at 1 A cm
-2
= 1,5, (b) Air stoichometry at 1 A cm
-2
= 4 (Lobato
et al., 2010b, with permission of Wiley Interscience)
The beneficial influence of the inclusion of the MPL in the electrode structure can be more
clearly seen in these results. Cell performance increases with the addition of a larger carbon
amount, due to the greater protection of the MPL, until a value of 2 mg cm
-2
. At this value,
the MPL avoids the complete penetration of catalyst particles inside the carbon support.
This results is coincident with the pore size distribution ones, in which macroporosity does
not decrease above 2 mg cm
-2
. On the other hand, when the carbon loading is too excessive,
a drop in the cell performance can be observed. This can be ascribed to the increase in the
MPL thickness, with the consequent increase in the mass transport limitations. Table 8
collects the values of the limiting current density arisen from the fitting of the experimental
data to the semi-empirical model.
Values of the oxygen limiting current densities show the suitability of the 2 mg cm
-2
carbon loading, despite the most limited mass transport characteristics of this GDL
compared to lower carbon loaded ones. This again points up that the important role that
plays the microporous layer in terms of protection of the catalytic layer, contributing to a
global enhancement of the cell performance. Nonetheless, limiting current density values
decreases for the 4 mg cm
-2
carbon loading, due to more prominent mass transfer
limitation when excessively thick GDL are used. Figure 18 shows the corresponding
impedance spectra at 300 mV when the cell was operated with air. Values of the mass
transfer resistance after fitting the experimental data to the equivalent circuit are collected
in Table 8.
The Gas Diffusion Layer in High Temperature Polymer Electrolyte Membrane Fuel Cells
35
0.1 0.2 0.3 0.4 0.5 0.6 0.7 0.8 0.9 1.0 1.1
0.0
0.1
0.2
0.3
0.4
0.5
0.6
0.7
0.8
0.9
without MPL
10% Teflon in the MPL
20% Teflon in the MPL
40% Teflon in the MPL
60% Teflon in the MPL
-Z'' / ohm cm
2
Z' / ohm cm
2
Fig. 18. Impedance spectra of the cell when electrodes with different carbon loading in the
MPL were used (Lobato et al., 2010b, with permission of Wiley Interscience)
Carbon loading / mg cm
-2
j
OL,ox
yg
en
/ mA cm
-2
j
OL,air
/ mA cm
-2
R
m
t
/ ohm cm
2
Without MPL 1,418.9 952.8 0.744
0.5 1,431.3 1,092.3 0.621
1 1,477.6 1.115.4 0.430
2 1,479.2 1.118.3 0.408
4 1,300.4 980.3 0.565
Table 8. Limiting current densities for oxygen and air operation, and the mass transfer
resistance for the different Teflon percentage in the MPL
Impedance spectra confirm the suitability of the inclusion of the MPL, and the particular
loading to use in order to obtain a good protection of the catalytic layer. Global cell
resistance decreases with the carbon loading until a minimum value corresponding to 2 mg
cm
-2
of carbon. If a higher carbon loading is applied, mass transfer resistance notably
increases, showing more limitations in terms of gases/vapour transport, due to the
excessive amount of carbon present in the MPL.
The influence of the carbon loading has demonstrated the importance of the addition of the
MPL to the electrode design. Protection of the catalytic layer is fundamental in order to
maximize the cell performance, and indeed, and according to the experimental results, it
plays even a more important role than mass transfer characteristics of the GDL. However, if
an excessive amount of carbon is added to the MPL, significant mass transport limitations
appear, leading to an optimum carbon loading of 2 mg cm
-2
.
b.ii) The Teflon percentage in the anodic MPL
Figure 19 shows the influence of the Teflon percentage of the MPL in different GDLs.
As it can be observed, the influence of the carbon loading in the anodic MPL is more
notorious than in the case of the cathode. However, it is visible the beneficial effect of the
inclusion of the MPL, despite being at the anode. The carbon loading, in this case, slightly
improves the global cell performance with an increase of the carbon loading, showing the
best performances for 1 and 2 mg cm
-2
, and a decrease when the carbon loading was
Heat and Mass Transfer – Modeling and Simulation
36
4 mg cm
-2
. Table 9 collects the values of the hydrogen limiting current density for the
different carbon loaded MPL in the gas diffusion layer.
0 200 400 600 800 1000 1200
0
100
200
300
400
500
600
700
800
900
without MPL
0.5 mg cm
-2
C in the MPL
1 mg cm
-2
C in the MPL
2 mg cm
-2
C in the MPL
4 mg cm
-2
C in the MPL
Cell voltage / mV
Current density / mA cm
-2
Fig. 19. Influence of the carbon loading in the MPL on the cell performance. Hydrogen
stoichometry at 1 A cm
-2
= 1 (Points: experimental data; lines: fitting to the model) (Lobato et
al., 2010b, with permission of Wiley Interscience)
Values of the limiting current density are very similar for GDL without MPL, and with low
loadings of carbon, demonstrating the suitability of these gas diffusion layers in terms of
mass transport. Nevertheless, in the case of the carbon loading of 2 and 4 mg cm
-2
, the
limiting current density decreases, due to the more impeded access of the hydrogen gas.
However, as in the case of the study focused on the cathode, the optimum protective role of
the MPL prescribes the use of a carbon loading of 2 mg cm
-2
, since hydrogen mass transfer
limitations will only appear in case of the use of a very restricted stoichometry.
Carbon loading / mg cm
-2
j
HL,h
y
dro
g
en
/ mA cm
-2
Without MPL 1.000,8
0.5 1,000.1
1 1,000.4
2 990.2
4 975.3
Table 9. Limiting current density for the hydrogen oxidation for the different carbon loading
in the MPL
4. Conclusions
The gas diffusion layer plays an important role for High Temperature PBI-based PEMFC in
terms of cell performance. Thus, it is desirable to have a carbonaceous support with a low
Teflon content (10% Teflon), in order to guarantee the mechanical stability of the membrane-
electrode assembly, and have the maximum porosity and permeability, allowing the
reduction of the mass transfer limitations. On the other hand, it is even more important the
inclusion of a microporous layer in the design of the electrodes, since this protects the
The Gas Diffusion Layer in High Temperature Polymer Electrolyte Membrane Fuel Cells
37
catalytic layer for penetrating within the macroporous carbon support, maximizing the
electrochemically active area of the electrode. For this purpose, a carbon loading of 2 mg cm
-2
is an optimum value. Besides, with this loading, the electrode presents the best mass
transfer characteristics. Finally, the amount of polymer binding (Teflon) to add in this layer
must be the minimum possible one (10% Teflon), in order to maximize the cell performance.
5. Acknowledgments
This work was supported by the Ministry of Education and Science of the Spanish
Government through project CTM2004-03817, and by the JCCM (Junta de Comunidades de
Castilla-La Mancha, Spain) through the project PBI-08-0151-2045.
6. Nomenclature
C
R
B
bulk reactant concentration S cross-section
C
P
B
bulk product reactant
concentration
P
pressure different observed
across the carbon support
C
R
S
reactant concentration at the
external surface of the electrode
E cell voltage
C
P
S
product concentration at the
external surface of the electrode
E
0
open circuit voltage
C
R
C
reactant concentration at the
catalytic layer
b Tafel slope
C
P
C
product concentration at the
catalytic layer
j experimental current density
C
R
cat
reactant concentration in the
platinum active sites
R ohmic resistance of the system
D
eff
effective diffusion coefficient j
OL
limiting cathode current density
D diffusion coefficient j
HL
limiting anode current density
porosity R
pol
lineal polarization resistance of
the hydrogen oxidation reaction
tortuosity
R
ohmic resistance from
impedance measurement
K permeability R
ct
resistance for the charge
transfer process
Q flow of gas (CPE)
ct
constant phase element for the
charge transfer process
µ gas viscosity R
mt
resistance for the mass transfer
process
L thickness of the porous medium (CPE)
mt
constant phase element for the
mass transfer process
7. References
Antolini, E.; Passos, R.R. & Ticianelli, E.A. (2002). Effects of the cathode gas diffusion layer
characteristics on the performance of polymer electrolyte fuel cells. Journal of The
Applied Electrochemistry, Vol. 32, No. 4, pp. 383-388, ISSN : 0021-891X.
Heat and Mass Transfer – Modeling and Simulation
38
Appleby, A.J. & Foulkes F.R. (1993). Fuel cell handbook, Krieger Publishing Company (Ed.),
ISBN: 0-89464-733-4, Malabar, Florida, United State.
Benziger, J.; Nehlsen, J.; Blackwell, D.; Brennan, T. & Itescu, J. (2005). Water flow in the gas
diffusion layer of PEM fuel cells. Journal of Membrane Science, Vol. 261, No. 1-2,
(September 2005), pp. 98-106, ISSN: 0376-7388.
Bose, S.; Kuila, T.; Hien Nguyen, T.X.; Kim, N.H; Lau, K T. et al. (2011). Polymer membranes
for high temperature proton exchange membrane fuel cell: Recent advances and
challenges. Journal of Power Sources, in press, (January 2011),
doi:10.1016/j.progpolymsci.2011.01.003, ISSN: 0378-7753.
Boukamp. B.A. (1986). A package for impedance/admittance data analysis. Solid State Ionics,
Vol. 18-19, Part 1, (January 1986), pp. 136-140, ISSN: 0167-2738
Bultel, Y.; Wiezell, K.; Jaouen, F.; Ozil, P. & Lindbergh G. (2005). Investigation of mass
transport in gas diffusion layer at the air cathode of a PEMFC. Electrochimica Acta, Vol.
51, No. 3, (October 2005), pp. 474-488, ISSN: 0013-4686.
Carrete, L.; Friedrich, K.A. & Stimming, U. (2001). Fuel Cells – Fundamentals and
Applications. Fuel Cells, Vol. 1, No. 1, (May 2001), pp. 5-39, ISSN: 1615-6854.
Cindrella, L. ; Kannan, A.M.; Lin, J.F.; Saminathan K.; Ho Y. et al. (2009). Gas diffusion layer
for proton exchange membrane fuel cells—A review. Journal of Power Sources, Vol.
194, No. 1, (October 2009), pp. 146-160. ISSN: 0378-7753.
Ciureanu, M. & Roberge R. (2001). Electrochemical Impedance Study of PEM Fuel Cells.
Experimental Diagnostics and Modeling of Air Cathodes. Journal of Physical
Chemistry B, Vol. 105, No. 17, (April 2001), pp 3531–3539, ISSN: 1089-5647.
Ciureanu, M.; Mikhailenko, S.D.; Kaliaguine, S. (2003). PEM fuel cells as membrane reactors:
kinetic analysis by impedance spectroscopy. Catalysis Today, Vol. 82, No. 1-4, (July
2003), pp. 105-206, ISSN 0920-5861.
EG&G Technical Services, Inc. (2004). Fuel Cell Handbook (7th Edition), U.S. Department of
Energy Office of Fossil Energy, Morgantown, West Virginia, United State. Available
from
/>ook7.pdf.
Han, M.; Xu, J.H.; Chan, S.H. & Jiang, S.P. (2008). Characterization of gas diffusion layers for
PEMFC.
Electrochimica Acta, Vol. 53, No. 16, (June 2008), pp. 5361-5367, ISSN: 0013-4686.
Jalani, N.H.; Ramani, M.; Ohlsson, K.; Buelte, S.; Pacifico, G. et al. (2006). Performance analysis
and impedance spectral signatures of high temperature PBI–phosphoric acid gel
membrane fuel cells. Journal of Power Sources, Vol. 160, No. 2, (October 2006), pp. 1096-
1103, ISSN: 0378-7753.
Lai, C M.; Lin, J C.; Ting F P.; Chyou, S D. & Hsueh K L. (2008). Contribution of Nafion
loading to the activity of catalysts and the performance of PEMFC. International
Journal of Hydrogen Energy, Vol. 33, No. 15, (August 2008) pp. 4132-4137, ISSN: 0360-
3199.
Li, Q.; He, R.; Jensen, J.O. & Bjerrum, N.J. (2003a). Review Approaches and Recent
Development of Polymer Electrolyte Membranes for Fuel Cells Operating above 100
°C. Chemistry of Materials, Vol. 15, No. 26, (December 2003), pp 4896–4915, ISSN: 0897-
4756.
Li, Q.; He, R.; Gao, J A.; Jensen, J.O. & Bjerrum, N.J. (2003b). The CO Poisoning Effect in
PEMFCs Operational at Temperatures up to 200°C. Journal of The Electrochemical
Society, Vol. 150, No. 12, (November 2003), pp.A1599-A1605, ISSN: 0013-4651.
The Gas Diffusion Layer in High Temperature Polymer Electrolyte Membrane Fuel Cells
39
Li, Q.; He, R.; Jensen, J.O. & Bjerrum, N.J. (2004). PBI-Based Polymer Membranes for High
Temperature Fuel Cells – Preparation, Characterization and Fuel Cell Demonstration.
Fuel Cells, Vol. 4, No. 3, (August 2004), pp. 147–159, ISSN: 1615-6854.
Linares, J.J. (2010). Celdas de combustible de membrana polimérica de alta temperatura
basadas en polibencimidazol impregnado con ácido fosfórico. PhD Thesis Dissertation,
(January 2010), Ciudad Real, Spain.
Liu, Z.; Wainright, J.S.; Litt, M.H. & Savinell R.F. (2006). Study of the oxygen reduction reaction
(ORR) at Pt interfaced with phosphoric acid doped polybenzimidazole at elevated
temperature and low relative humidity. Electrochimica Acta, Vol. 51, No. 19, (May
2006), pp. 3914-3923, ISSN: 0013-4686.
Lobato, J.; Cañizares, P.; Rodrigo, M.A.; Linares, J.J. & Manjavacas G. (2006). Synthesis and
characterisation of poly[2,2-(m-phenylene)-5,5-bibenzimidazole] as polymer
electrolyte membrane for high temperature PEMFCs. Journal of Membrane Science, Vol.
280, No. 1-2, (September 2006), pp. 351-362, ISSN: 0376-7388.
Lobato, J.; Cañizares, P.; Rodrigo, M.A.; Linares, J.J. & López-Vizcáino, R. (2008a). Performance
of a Vapor-Fed Polybenzimidazole (PBI)-Based Direct Methanol Fuel Cell.
Energy&Fuels, Vol. 22, No. 5, (July 2008), pp 3335–3345, ISSN: 0887-0624.
Lobato, J.; Cañizares, P.; Rodrigo M.A.; Ruíz-López, C. & Linares, J.J. (2008b). Influence of the
Teflon loading in the gas diffusion layer of PBI-based PEM fuel cells. Journal of The
Applied Electrochemistry, Vol. 38, No. 6, pp. 793-802, ISSN: 0021-891X
Lobato, J.; Cañizares, P.; Rodrigo, M.A.; Linares, J.J. & Pinar, F.J. (2010a). Study of the influence
of the amount of PBI–H3PO4 in the catalytic layer of a high temperature PEMFC.
International Journal of Hydrogen Energy, Vol. 35, No. 3, (February 2010), pp. 1347-1355,
ISSN: 0360-3199.
Lobato, J.; Cañizares, P.; Rodrigo, M.A; Úbeda, D.; Pinar F.J. et al. (2010b). Optimisation of the
Microporous Layer for a Polybenzimidazole-Based High Temperature PEMFC –
Effect of Carbon Content. Fuel Cells, Vol. Vol. 10, No. 5, (October 2010), pp. 770–777,
ISSN: 1615-6854.
Mamlouk, M. & Scott, K. (2010). The effect of electrode parameters on performance of a
phosphoric acid-doped PBI membrane fuel cell. International Journal of Hydrogen
Energy, Vol. 35, No. 2, (January 2010), pp. 784-793, ISSN: 0360-3199.
Mathias, M.; Roth, J.; Fleming, J. & Lehnert W. (2003). Diffusion media materials and
characterisation, in: Handbook of Fuel Cells, W. Vielstich, A. Lamm, H. A. Gasteiger
(Eds.), John Wiley & Sons Ltd, Ch. 46, Chichester, United Kingdom, ISBN: 0-471-
49926-9
Paganin, V.A.; Oliveira, C.L.F.; Ticianelli, E.A.; Springer, T.E. & González, E.R. (1998).
Modelistic interpretation of the impedance response of a polymer electrolyte fuel cell.
Electrochimica Acta, Vol. 43, No. 24, (August 1998), pp. 3761-3766, ISSN: 0013-4686.
Pan, C.; Li, Q.; Jensen, J.O.; He, R.; Cleeman, L.N. et al. (2007). Preparation and operation of gas
diffusion electrodes for high-temperature proton exchange membrane fuel cells.
Journal of Power Sources, Vol. 172, No. 1, (October 2007), pp. 278-286, ISSN: 0378-7753.
Park, S.; Lee, J W. & Popov, B.N. (2006). Effect of carbon loading in microporous layer on PEM
fuel cell performance. Journal of Power Sources, Vol. 163, No. 1, (December 2006), pp.
357-363, ISSN: 0378-7753.
Park, G G.; Sohn, Y J.; Yang T H.; Yoon, Y G.; Lee, W Y. et al. (2004). Effect of PTFE contents
in the gas diffusion media on the performance of PEMFC. Journal of Power Sources,
Vol. 131, No. 1-2, (May 2004), pp. 182-187, ISSN: 0378-7753.
Heat and Mass Transfer – Modeling and Simulation
40
Prasanna, M.; Ha, H.Y. & Cho, E.A. (2004a). Influence of cathode gas diffusion media on the
performance of the PEMFCs. Journal of Power Sources, Vol. 131, No. 1-2, (May 2004),
pp. 147-154, ISSN: 0378-7753.
Prasanna, M.; Ha, H.Y.; Cho, E.A.; Hong, S A.; Oh, I H. (2004b). Investigation of oxygen gain
in polymer electrolyte membrane fuel cells. Journal of Power Sources, Vol. 137, No. 1,
(October 2004), pp. 1-8, ISSN: 0378-7753.
Quingfeng, L.; Hjuler, H.A. & Bjerrum, N.J. (2000). Oxygen reduction on carbon supported
platinum catalysts in high temperature polymer electrolytes. Electrochimica Acta, Vol.
45, No. 25-26, (August 2000), pp. 4219-4226, ISSN: 0013-4686.
Samms, S.R.; Wasmus, S.; Savinell, R.F. (1996). Thermal Stability of Proton Conducting Acid
Doped Polybenzimidazole in Simulated Fuel Cell Environments. Journal of The
Electrochemical Society, Vol. 143, No. 4, (April 1996), pp. 1225-1232, ISSN: 0013-4651.
Savadogo, O. (2004). Emerging membranes for electrochemical systems: Part II. High
temperature composite membranes for polymer electrolyte fuel cell (PEFC). Journal of
Power Sources, Vol. 127, No. 1-2, (March 2004), pp. 135-161, ISSN: 0378-7753.
Seland, F.; Berning, T.; Børresen, B. & Tunold R. (2006). Improving the performance of high-
temperature PEM fuel cells based on PBI electrolyte. Journal of Power Sources, Vol. 160,
No. 1, (September 2006), pp. 27-36, ISSN: 0378-7753.
Soler, J.; Hontañón, E. & Daza, L. (2003). Electrode permeability and flow-field configuration:
influence on the performance of a PEMFC. Journal of Power Sources, Vol. 118, No. 1-2,
(May 2003), pp. 172-178, ISSN: 0378-7753.
Song, J.M.; Cha, S.Y. & Lee, W.M. (2001). Optimal composition of polymer electrolyte fuel cell
electrodes determined by AC impedance method. Journal of Power Sources, Vol. 94,
No. 1, (February 2001), pp. 78-84, ISSN: 0378-7753.
Springer, T.E.; Zawodzinski, T.A.; Wilson, M.S.; Gottesfeld, S. (1996). Characterization of
Polymer Electrolyte Fuel Cells Using AC Impedance Spectroscopy. Journal of The
Electrochemical Society, Vol. 143, No. 2, (February 1996), pp. 587-599, ISSN: 0013-4651.
Wainright, J.S.; Litt, M.H. & Savinell R.F. (2003). High Temperatures membranes, in: Handbook
of Fuel Cells, W. Vielstich, A. Lamm, H. A. Gasteiger (Eds.), John Wiley & Sons Ltd,
Vol. 3, Chichester, United Kingdom, ISBN: 0-471-49926-9.
Wang, J T.; Wasmus, S. & Savinell, R.F. (1996). Real-Time Mass Spectrometric Study of the
Methanol Crossover in a Direct Methanol Fuel Cell. Journal of The Electrochemical
Society, Vol. 143, No 4, (April 1996), pp. 1233-1239, ISSN: 0013-4651.
Wang, X.L.; Zhang, H.M.; Zhang, J.L.; Xu, H.F.; Tian Z.Q. et al. (2006). Micro-porous layer with
composite carbon black for PEM fuel cells. Journal of Power Sources, Vol. 51, No. 23,
(June 2006), pp. 4909-4915, ISSN: 0378-7753.
Weng, D.; Wainright, J.S.; Landau, U. & Savinell, R.F. (1996). Electro-osmotic Drag Coefficient
of Water and Methanol in Polymer Electrolytes at Elevated Temperatures. Journal of
The Electrochemical Society, Vol. 143, No. 4, (April 1996), pp. 1260-1263, ISSN: 0013-
4651.
Williams, M.V.; Begg, E.; Bonville, L.; Kunz H.R. & Fenton, J.M. (2004). Characterization of Gas
Diffusion Layers for PEMFC. Journal of The Electrochemical Society, Vol. 151, No. 8,
(June 2004), pp. A1173-A1180, ISSN: 0013-4651.
Yuan, X.; Wang, H.; Sun, J.C. & Zhang, J. (2007). AC impedance technique in PEM fuel cell
diagnosis—A review. International Journal of Hydrogen Energy, Vol. 32, No. 17,
(December 2007), pp. 4365-4380, ISSN: 0360-3199.
3
Numerical Analysis of Heat and
Mass Transfer in a Fin-and-Tube
Air Heat Exchanger under Full and
Partial Dehumidification Conditions
Riad Benelmir and Junhua Yang
University Henri Poincaré - Nancy I
France
1. Introduction
Heat exchangers are commonly used in industrial fields such as air conditioning,
petrochemical and agriculture-food industries. The design and utilization of a heat
exchanger should fulfill some conditions of performance, economy and space requirement.
The most widely operated heat exchangers make use of fin-and-tube configuration in
association with the application of heating, ventilating, air-conditioning and refrigeration
systems (Khalfi & Benelmir, 2001). With regard to the fin temperature and dew point
temperature of surrounding air, three situations on a fin surface can be distinguished (Lin &
Jang, 2002, Benelmir et al., 2009). The fin surface is fully dry if the temperature of the whole
fin is higher than the air dew point temperature. It is partially wet when the air dew point
temperature is lower than the fin top temperature and is higher than the fin base
temperature. Finally, the fully wet surface occurs if the temperature of the whole fin is lower
than the dew point temperature. A reliable determination of the fin efficiency must account
for the simultaneous heat and mass transfer on the cooling surface. Many experimental, and
few numerical, studies have been carried out to study the heat and mass transfer
characteristics of the fin-and-tube heat exchangers under dehumidifying conditions. It was
stated by Liang et al. (2000) that the condensation of the moist air along the fin surface
causes reduction of the fin efficiency. They found also that measured fin efficiency was less
than the calculated one assuming a uniform heat transfer coefficient. The calculated results
of Saboya & Sparrow (1974), Chen et al. (2005), Chen & Hsu (2007), and Chen & Chou (2007)
concluded that the heat transfer coefficient was non-uniform under dry conditions. Due to
the difficulty of considering a variable sensible heat transfer coefficient (Choukairi et al.,
2006), this later was often assumed to be uniform by many investigators in the calculation of
fin efficiency. Liang et al. (2000) used one-dimensional and two-dimensional models to
determine the humid fin efficiency of a plate-fin-tube heat exchanger: The results obtained
show comparable efficiencies with both 1-D and 2-D models. Chen (1991) analyses the fin
performance under dehumidifying conditions and shows, through a 2-D model, that the
humid fin efficiency was sensitive to the moist air relative humidity value. As mentioned
earlier, the sensible heat transfer coefficient is often assumed uniform. Thus, the wet fin
efficiency is usually determined under this assumption and by introducing a functional
relation between the relative humidity and the fin temperature [Lin & Jang , 2002, Liang et
Heat and Mass Transfer – Modeling and Simulation
42
al., 2000, Chen, 1991, Lin et al., 2001, Elmahdy & Biggs, 1983, Coney et al., 1989]. The most
proposed relation between “the difference of the air humidity ratio and that evaluated at the
fin temperature” and “the difference of the ambient temperature and fin temperature” used
a factor named the condensation factor. This later was often settled constant. Chen & Wang
(2008) proposed one-dimensional and two-dimensional models based on inverse heat
conduction method and in conjunction with experimental temperature data for predicting the
average overall heat transfer coefficient and wet fin efficiency. In their study the sensible heat
transfer coefficient, the functional relation between the relative humidity and fin temperature,
and the Lewis number are considered to be unknown. Their results show that the estimated fin
efficiency under partially and fully wet conditions is sensitive to the relative humidity. Lin et
al. (2001) mentioned that the effect of the relative humidity on the fully wet fin efficiency of
extended surface was very confused. This work’s aims to estimate the overall heat transfer
coefficient and the fin efficiency as well as the total heat rate exchanged under partially or fully
wet conditions using an appropriate numerical procedure. The airflow pattern is first
determined by solving the mass and momentum balance equations. The heat and mass
balance equations are then solved by a finite volume method after subdividing the fin in
several sub-fin regions. The effect of admission air parameters such as temperature, relative
humidity and velocity as well as the fin base temperature mainly on the overall heat transfer
coefficient and the fin efficiency are investigated.
2. Mathematical model
2.1 Air dehumidification in contact with a cold wall
Cooling and dehumidifying of moist air by a cold surface involves simultaneous heat and
mass transfer (Fig. 1). Within the moist air flow, characterized by the mean dry temperature
Ta and absolute humidity W
a
, along a cold surface at a fixed temperature T
w
, which is lower
than the dew point temperature of the air (T
dew,a
), condensation occurs on the wall. At the
air-condensate interface, the saturated air is characterized by the condensate-film
temperature T
c
and the saturated humidity ratio W
S,c
, at T
c
. The total wall heat flux includes
the sensible part due to convection, spent by cooling air, resulting from the temperature
differences between air and condensate-film, and the latent part due to the vapor phase
transition heat leading to the partially condensation of the vapor contained in the moist air.
Fig. 1. Air dehumidification by a cold wall
T
a
, W
a
Moist air
Inlet
T
a,i
W
a,i
m"
a,dry
Outlet
T
a,o
W
a,o
m"
a,dry
Condensate-film
W
S,c
(T
c
)
T
c
Cold wall T
w
T
a
, W
a
Moist air
Inlet
T
a,i
W
a,i
m"
a,dry
Outlet
T
a,o
W
a,o
m"
a,dry
Condensate-film
W
S,c
(T
c
)
T
c
Cold wall T
w
Numerical Analysis of Heat and Mass Transfer in a Fin-and-Tube
Air Heat Exchanger under Full and Partial Dehumidification Conditions
43
The total heat transfer rate through the wall can be expressed as:
,,,tadryaiao cc
q
mii mi
(1)
Where m
”
c
is the condensate mass flux.
The error induced by neglecting the sensible heat of the condensate m
”
c
i
c
is in the order of
magnitude of 1.3 %. On the other hand, as stated above, the total heat flux results from both
sensitive and latent heat components, thus, the following expression of total heat flux
density yield:
,,, ,t a dry a i a o sen l sen hum a c c v
q
mii
TT mL
(2)
According to the mass transfer law, the mass flux of the condensate is expressed as:
,cma Sc
mWW
(3)
As reported by Lin et al. (2001), most of the investigators applied the Chilton-Colburn
analogy to set a relationship between the mass transfer coefficient and the sensitive heat
transfer coefficient, hence; the following relation is reported and used in our work:
,
2/3
,
.
sen hum
m
p
a
Le c
(4)
Combining equations (2), (3), and (4), the following equation is obtained:
,,
2/3
,
.
tsenhumac a Sc
pa
Lv
qTT WW
Le c
(5)
Moreover, the total heat flux density is related to the overall heat transfer coefficient by the
following relation:
,tOhumac
qTT
(6)
Thus, we obtain the expression bellow for the overall heat transfer coefficient:
,
,,
2/3
,
1
.
aSc
O hum sen hum
ac
pa
WW
Lv
TT
Le c
(7)
2.2 The physical problem
The schematic diagram of the problem is shown in Fig. 2. The rectangular fins are arranged
around tubes lined up or ranked in staggered rows. The refrigerant flows inside tubes and
moist air streams outside. The fin temperature is considered lower than the dew point
temperature of air, which draws away a condensation on the surface of the tube and the fin.
This work will consider the heat and mass transfer for a representative tube and fin
elementary unit.
Heat and Mass Transfer – Modeling and Simulation
44
Fig. 2. Schematic of fins arranged around tubes lined up or ranked in staggered rows
The investigation of heat and mass transfer performance during the cooling of moist air
through an extended surface, associated with dehumidification, should take into account:
the convective heat transfer process between the air-flow and the condensate-film, the
conduction inside the fin and the condensate-film, and the mass transfer process between
the air-flow and the condensate-film (Fig. 3).
Fig. 3. Heat and mass transfer phenomenon around a fin-tube
As the fins spacing is very weak regarding the fins height and length, heat and mass transfer
along with the fin plane’s normal direction (z direction) is neglected. The heat flux
exchanged by the fin is assumed to be identical on both faces. Hence, only one face is
considered in the study of heat and mass transfer by the fin as a result of symmetry
condition applied on the fin median plane. Fig. 4 shows the physical domain of the current
work.
air
fin
tube
P
t
2h
2l
P
l
2h
2l
P
l
P
t
air
fin
tube
P
t
2h
2l
P
l
2h
2l
P
l
P
t
Air flow
Heat flux
Condensate
mass flux
2h
2
r
Condensate-film
fin
2l
tube
Air flow
Heat flux
Condensate
mass flux
2h
2
r
Condensate-film
fin
2l
tube
Numerical Analysis of Heat and Mass Transfer in a Fin-and-Tube
Air Heat Exchanger under Full and Partial Dehumidification Conditions
45
Fig. 4. Physical domain of the present work
The elementary volumes are defined as follow:
ff
V dxdy
;
cc
Vdxd
y
;
afc
V
p
dxd
y
;
tff
V
p
dxd
y
2.3 Governing equations
In this work, we consider the two-dimensional problem of heat transfer through the fin-
surface and condensate-film and the dynamic air-stream according to the (x,y) plane (Fig. 4).
The problem of the vapor mass transfer from air to the fin-tube wall occurs according to the
direction z. The mathematical formulation is accomplished with respect to some basic
assumptions. The air-flow is considered as incompressible and evolving in a laminar steady
state. The thermo-physical properties of air, condensate-film and fin-tube are temperature
dependant. On the other hand, we consider that heat transfer through the condensate-film is
purely conductive and that the radiation transfer mode is always neglected. Furthermore,
the condensate-film is assumed to be thin and uniform and, due to the weak thickness of the
fin, the adiabatic condition is assumed at the fin-end. For convenience of heat and mass
transfer analysis, the following dimensionless parameters are introduced as:
,
*
,,
a
f
b
a
ai
f
b
TT
T
TT
,
*
,,
ff
b
f
ai
f
b
TT
T
TT
(8)
,,
*
,,,
aS
f
b
a
ai S
f
b
WW
W
WW
,,,
*
,,,
Sc S
f
b
c
ai S
f
b
WW
W
WW
(9)
Control volume
Condensate-film
(T
c
, W
S,c
)
2p
f
p
f
δ
c
2δ
f
δ
c
δ
c
δ
f
δ
f
δ
c
air (T
a
, W
a
)
fin
(T
f
,W
S,f
)
fin
(T
f
,W
S,f
)
fin
(T
f
,W
S,f
)
z
x
y
2r
Control volume
Condensate-film
(T
c
, W
S,c
)
2p
f
p
f
δ
c
2δ
f
δ
c
δ
c
δ
f
δ
f
δ
c
air (T
a
, W
a
)
fin
(T
f
,W
S,f
)
fin
(T
f
,W
S,f
)
fin
(T
f
,W
S,f
)
z
x
y
2r
Heat and Mass Transfer – Modeling and Simulation
46
*
x
x
r
*
y
y
r
*
h
h
r
*
l
l
r
*
1
r
r
r
(10)
*
f
P
P
r
*
c
c
r
*
x
x
i
u
u
u
*
y
y
i
u
u
u
(11)
2.3.1 Continuity and momentum equations for air flow
The two-dimensional continuity and momentum equations for air-flow are:
0
y
x
u
u
xy
(12)
22
22
xx xx
xya
uu uu
uu
xy
xy
(13)
22
22
y
yyy
xya
uu uu
uu
xy
xy
(14)
Introducing the dimensionless variables defined above into Eqs. (12) to (14) leads to the
following dimensionless equations:
*
*
**
0
y
x
u
u
xy
(15)
* * 2* 2*
**
* * *2 *2
2
Re
xx xx
xy
D
uu uu
uu
xy xy
(16)
** 2*2*
**
** *2*2
2
Re
y
yyy
xy
D
uu uu
uu
xy xy
(17)
Where Re
D
indicates the Reynolds number based on the internal fin diameter.
Re
ai
D
a
uD
(18)
The air speed at the inlet and outlet is settled uniform and parallel to the x axes, which
yields to the following boundary conditions:
**
xl
,
*
y
,
*
1
x
u
,
*
0
y
u
(19)
The upper and lower edges of the fin are subject to the following boundary conditions:
**
y
h
,
*
x
,
*
0
y
u
(20)
Numerical Analysis of Heat and Mass Transfer in a Fin-and-Tube
Air Heat Exchanger under Full and Partial Dehumidification Conditions
47
Finally, at the fin base, the non-sliding condition is used:
*2 *2
1xy
**
0
xy
uu
(21)
2.3.2 Mass balance equation for vapor in air flow
The vapor flow mass balance equation in the elementary air volume, represented by Fig. 5,
is expressed as follow:
"0
vc
m m dxdy
(22)
In this equation, the first term represents the vapor flow rate variation in the air volume,
and the second term corresponds to the mass flow rate between the moist air and the
condensate-film.
Fig. 5. Vapor flow rate variation in an elementary air volume
According to Fig. 5, the variation of the vapor mass flow is written as:
,
aa
vx
y
adr
y
a
WW
mu u V
xy
(23)
Using Eqs. (3), (22) and (23) yields to the following equation:
,
,
2/3
,,
sen hum
aa
x
y
aSc
fc paadry
WW
uu WW
xy
pLec
(24)
The dimensionless form becomes:
**
,
** **
**
**2/3
,,
sen hum
aa
x
y
ac
cpaiadry
WW
uu WW
xy
pLecu
(25)
And the corresponding boundary conditions are:
y
z
Elementary air volume
p
f
-δ
c
x
dy
dx
Moist air
y
z
Elementary air volume
p
f
-δ
c
x
dy
dx
Moist air
Heat and Mass Transfer – Modeling and Simulation
48
**
xl
,
*
y
,
*
1
a
W
**
y
h
,
*
x
,
*
*
0
a
W
y
(26)
2.3.3 Energy balance equation for air flow
Referring to Fig. 5, the energy balance equation held the same form as Eq. (22):
"0
asen
E q dxdy
(27)
This equation denotes that the most air sensible heat variation of the elementary volume is
equilibrated by the sensible heat flow exchanged between air and the condensate-film.
The variation of the sensible heat of the elementary volume can be expressed as:
,,
aa
a
p
ax
y
adr
y
a
TT
Ec u u V
xy
(28)
Using Eq. (2) and (27), Eq. (28) leads the following form:
,
2/3
,
sen hum
aa
x
y
ac
fc paa
TT
uu TT
xy
pLec
(29)
After introducing the dimensionless variables, we get :
**
,
** **
**
**2/3
,
sen hum
aa
x
y
ac
cpaia
TT
uu TT
xy
pLecu
(30)
The related boundary conditions are:
**
xl
,
*
y
,
*
1
a
T
(31)
**
y
h
,
*
x
,
*
*
0
a
T
y
(32)
2.3.4 Energy balance equation for the condensate-film
As mentioned above, heat transfer through the condensate-film is assumed to be purely
conductive. Using the fact that the temperature of the condensate-film internal surface is the
same as that of the fin surface, the heat flux transferred from the condensate-film to the fin
is:
c
f
tc
c
TT
q
(33)
This flux is equal to the convective heat flow transferred by air to the condensate-film,
consequently, Eq. (33) can be written:
Numerical Analysis of Heat and Mass Transfer in a Fin-and-Tube
Air Heat Exchanger under Full and Partial Dehumidification Conditions
49
,
c
f
Ohum a c c
c
TT
TT
(34)
From this equation, the condensate-film temperature is deduced:
,
1
af
ca
c
Ohum
c
TT
TT
(35)
2.3.5 Mass balance equation for condensate-film
The film-wise condensation of a stationary saturated vapor on a plane vertical surface has
been analyzed by Nusselt (1916) by means of some assumptions. The expression of the
condensate-film thickness given by Nusselt is:
1/4
4
cc c f
c
vc c v
hyT T
gL
(36)
Where the subscripts c and v refer to condensate-film and water vapor, respectively.
Substituting T
c
by its expression (Eq. 35) into Eq. (36) leads to the following relationship:
1/4
,
4
.
cc a f
c
c
vc c v c Ohumc
hyT T
gL
(37)
2.3.6 Energy balance equation for the fin surface
The energy balance equation for the fin is obtained from the heat conduction equation
within the fin surface, thus, the subsequent equation is obtained:
22
22
0
ff
ff
TT
E
xy
(38)
Where,
E
f
is the thermal energy flow rate received by the fin elementary volume, expressed
as:
,
,
Ohum c
t
faf
f
fc OhumC
q dxdy
ETT
V
(39)
Combining these equations yields:
22
,
22
,
0
ff
Ohum c
af
ff c OhumC
TT
TT
xy
(40)
The dimensionless form of Eq. (40) is:
Heat and Mass Transfer – Modeling and Simulation
50
2* 2*
2
,
**
*2 *2
,
0
ff
Ohum c
af
ff c OhumC
TT
r
TT
xy
(41)
Using the adiabatic condition in the inlet and the outlet as well as the symmetry condition in
both upper and lower, of the fin wall, the following boundary conditions holds:
**
xl
,
*
y
,
*
*
0
f
T
x
(42)
**
y
h
,
*
x
,
*
*
0
f
T
y
(43)
At the fin base surface, the temperature is considered equal to that of the tube:
*2 *2
1xy
,
*
0
f
T
(44)
2.4 Solving equations
The two-dimensional model developed above is based on the following equations: the
continuity and momentum equation (Eqs. 15 to 17), the mass balance equation for water
vapor (Eq. 25), the energy balance equation for air stream (Eq. 30), the heat transfer equation
in the fin surface (Eq. 41) and the heat and mass transfer equations for the condensate-film
(Eqs. 35 and 37). In our model, the simultaneous influence of the local speed and heat
transfer coefficient is considered for solving heat and mass transfer within the air flow
(Eqs.25 and 30). Moreover, equation (30) uses in its expression the mass flow of moist air
(
a
u
i
), while in Eq. (25), the dry air mass flow is used. This allows the consideration of the
effect of condensation on heat and mass transfer only once.
2.4.1 Solving continuity and momentum equations
The problem described by Eqs (15) to (17) is a classical fluid flow problem, as the flow
around a cylinder. However, in our case, the fluid flows inside a rectangular channel. In
order to analyze the heat and mass transfer fin performance, it is necessary to know the
airflow pattern, particularly the distribution of the airflow velocities. The investigation of air
velocity field has been carried out either by using the analytical approaches given by
Johnson (1998) or by a numerical analysis using the finite-volume method. In the completion
of this work, as the Reynolds number based on fin length is less than 2000 (laminar case)
and as the air thermo-physical properties are weakly temperature dependent, except the
kinetic viscosity, the following expressions of the dimensionless velocities found by Johnson
(1998) are approved:
*2
*
*2 *2 2
*2 *2
2
1
1
x
y
u
xy
xy
(45)
**
*
2
*2 *2
2
y
xy
u
xy
(46)