Heat Transfer Engineering Applications Part 12 pot
Bạn đang xem bản rút gọn của tài liệu. Xem và tải ngay bản đầy đủ của tài liệu tại đây (5.3 MB, 30 trang )
Ultrahigh Strength Steel: Development of
Mechanical Properties Through Controlled Cooling
319
(a)
(b)
(c)
Fig. 3. Optical micrographs of nickel steels, showing the decreasing tendency of formation of
acicular ferrite (AF) and grain boundary ferrite (GBF) in as-cast, quenched and tempered
specimens of (a) ESR2, (b) ESR3, and (c) ESR4 alloy.
(a)
(b)
(c)
Fig. 4. SEM micrographs of steels, showing the effect of nickel on the fineness of martensite
laths in (a) ESR2, (b) ESR3, and (c) ESR4 alloy in as-cast tempered condition.
Heat Transfer – Engineering Applications
320
(a)
(b)
(c)
Fig. 5. Calculation of precipitate stability using CHEMSAGE software for ESR1, ESR2 and
ESR4 alloy showing the volume fraction of precipitates.
Ultrahigh Strength Steel: Development of
Mechanical Properties Through Controlled Cooling
321
3.2 Optimisation of processes parameters of TMT
It is possible to obtain optimum combination of strength and toughness by a control process
parameters of thermomechanical treatment such as slab reheating temperature, deformation
temperature, deformation per pass, cooling rate, etc (Kim et al., 1987). In the present study,
it was attempted to optimise some of the process parameters like slab reheating
temperature, deformation temperatures and the cooling rate of the cooling medium, etc
which are discussed in the following section.
3.2.1 Soaking temperature
The initial stage of any hot rolling process usually consists of a selection of proper soaking
temperature. At this temperature, attempt is normally made to dissolve all the carbides or
carbonitrides present in the steel, so that these can be re-precipitated at smaller sizes in the
later stage of the process. At the same time, too high soaking temperature leads to increase
in austenite grain size, which controls the final microstructure. Therefore, it is necessary to
select the appropriate soaking temperature at which the optimum results may be achieved.
The microalloys form different carbides and carbonitrides, which go into solution at
different temperatures, and therefore one needs to know these temperatures. Equilibrium
stability of the carbides and carbonitrides in the alloys were calculated using CHEMSAGE
software and the result are shown in Figure 5. The calculation is based on the chemical
composition of the steel. Calculations were done for temperatures in the range of 200C to
1400C and in the intervals of 100C. It may be noticed from these figures that the
precipitates of carbides in ESR1, ESR2, ESR3, ESR4 are almost completely dissolved at
around 900-1000C and nitrides at 1200C. The soaking temperature of these steels was
therefore fixed at 1200C.
3.2.2 Deformation and deformation temperature
Hot compression tests were performed to get an idea about the required load during hot
rolling for a given amount of deformation. The specimen size was identical for all alloys. It
was cylindrical in shape with 8 mm diameter and 14.4 mm height. The samples were
reheated in a controlled atmosphere in a cast iron mould. The compression tests were
performed at 1200C with a strain rate of 1.0 s
-1
with 50% total reduction. Result of hot
compression test is represented by stress vs. degree of deformation (flow stress curve). The
entire test was performed within 10 seconds. Visual observation showed that no major
defect occurred in the compressed samples. Figure 6 shows the flow stress curves of ESR1
(base alloy), ESR2 (1% Ni), ESR3 (2 %Ni), and ESR4 (3.2% Ni). Except ESR3 alloy, the curves
are similar for all the steels. The gradual increase of stress in all the alloys reflects the work
hardening of the austenite. It can be inferred from Figure 6 that the required stresses for
50% hot deformation of the steels for all alloys are in the range 60 and 70 MPa, except in
ESR3 (2% Ni) requiring the highest stress (80 MPa). TTT diagram of the base alloy (ESR1)
has been predicted and reported using a model based on the chemistry of the metal (Maity
et al., 2006). The calculated diagram for ESR1 steel is shown in Figure 7. This figure predicts
that AC
1
temperature of this steel is about 825C and martensite start transformation (Ms)
temperature is above 300C. Fast cooling below Ms temperature, could lead to
transformation of martensite. Relatively slower cooling may result in a mixture of bainite
and martensite. It was not possible to model the TTT diagram for the nickel containing
alloys, as the -loop shifted extremely to the right. The diagram provides probable
Heat Transfer – Engineering Applications
322
information regarding the beginning and end of transformation into stable and metastable
phases. It was planed to roll the material in the two-phase α- region between AC
3
and AC
1
temperatures. As the α- phase in the two phase region being softer than the -phase in the
stable -region (Yu et al., 2006),
the high strength steels could then be rolled with the existing
equipment. Additionally, if the first phase of rolling is done at a relatively high temperature
in the two-phase region (above the recrystallisation temperature), one can get dynamic
recrystallisation and finer austenite grains. The final pass can be made just above the AC
1
temperature so that recrystallisation can be limited and work hardening effect can be
achieved (Kawalla & Lehnert, 2002).
These arguments are based on equilibrium
temperature. In reality, austenite to ferrite reaction may be sluggish enough throughout the
rolling range. Small amount of ferrite may of course forms during rolling due to
deformation induced transformation.
Fig. 6. Result of hot compression tests (50% reduction) on as-cast samples of ESR1, ESR2,
ESR3 and ESR4 alloy.
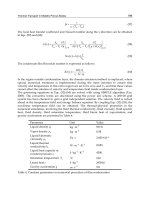
3.2.3 Cooling rate of the medium
The cooling rate of the as-cast alloys was determined experimentally. The as-cast specimens
were heated to 1200C and after soaking at this temperature, the samples were held outside
the furnace till it cooled to 850C, and were then allowed to cool in different coolants. The
selected coolants were air, oil, polymer-water mixture (1:1), polymer-water mixture (1:1.5)
and the polymer-water mixture (1:2). The progress of cooling of the specimens in these
coolants is shown in Figure 8. The figure shows that the rate of cooling is slowest in air, and
polymer-water (1: 2) mixture results in the severest cooling. Cooling in oil is faster than the
other two polymer-water mixtures down to a temperature of 250C. The polymer-water (1:2)
mixture was not selected for the final experiments, as it was considered too severe and
therefore may lead to cracks. Use of the polymer-water (1:1) and (1:1.5) mixtures results in
similar cooling profiles in the 300-700C range. The polymer –water (1:1.5) mixture was used
along with air and oil cooling in the final experiments. The average cooling rate for these
Ultrahigh Strength Steel: Development of
Mechanical Properties Through Controlled Cooling
323
coolants was estimated and it was 1.3C.s
-1
for air, 16C.s
-1
for polymer-water (1:1.5) mixture
and 28C.s
-1
for oil, in the temperature range of 700C-300C. At temperatures below 300C,
oil cools slower than the polymer water solution.
Fig. 7. Modelled TTT diagram of ESR1 (base alloy) showing AC
3
and M
S
temperature.
Fig. 8. Estimated average cooling rate of the ESR1 (base alloy) in different coolants.
3.2.4 Modelling of Continuous Cooling Transformation (CCT) diagram
Estimation of different phases was modelled to obtain a relationship of the phases to be
appeared in different cooling conditions. The data predicts the transformation of various
Heat Transfer – Engineering Applications
324
phases on application of continuous cooling conditions. The model used for this purpose
was neural network based and claimed an error band of 14K for Ms temperature and
10% for phase percentages (Ion, 1984; Doktorowski, 2002). Starting temperature for the
model calculation has been considered as 900C. The CCT diagram obtained by this model
is shown in Figure 9. It predicts that at the slower cooling rate (less than 2-5K/s) the
microstructures consist of a mixture of bainite, martensite and some amount of ferrite. Fast
cooling (>10 K/s) on the other hand results in complete transformation to martensite. The
results of these models are useful in analysing the results obtained after TMT.
Fig. 9. Modelled CCT diagram predicts the microstructure constituents and Ms temperature
for ESR 2, ESR3, and ESR4 alloys.
Ultrahigh Strength Steel: Development of
Mechanical Properties Through Controlled Cooling
325
3.3 Properties of TMT plates
The summary of the observations during the hot rolling experiments is given in Table 8. The
rolling stresses for each steel were calculated by the standard method (Zouhar, 1970). The
calculated rolling stresses for the different alloys are illustrated in Figure 10. It can be noted
that ESR1, base alloy, required the minimum stresses (113 MPa for 1
st
pass and 254 MPa for
final pass). The three nickel containing steels, viz., ESR2, ESR3 and ESR4 required higher
steel
Initial First pass Final Pass
Coolin
g
medium
H
o
(mm)
B
o
(mm)
H
1
(mm)
B
1
(mm)
Fw
1
[kN]
Av
1
(MPa)
H
2
(mm)
B
2
(mm)
Fw
2
[kN]
Av
2
(MPa)
ESR1
21.2 23.1 16.5 26.5 122
113
11.1 30.0 326
254
Air
21.2 23.1 16.5 26.5 129 11.1 30.0 341 Oil
21.2 23.1 16.5 26.5 120 11.1 30.1 340 Pol
y
mer
ESR2
21.0 22.6 16.5 26.5 131
126
11.1 29.9 327
254
Air
21.0 22.6 16.5 26.5 135 11.2 30.0 328 Oil
21.0 22.6 16.5 26.5 140 11.2 30.1 344 Pol
y
mer
ESR3
21.4 22.5 16.5 26.5 154
136
11.2 29.0 341
263
Air
21.4 22.5 16.5 26.5 155 11.2 29.3 340 Oil
21.4 22.5 16.5 26.5 148 11.2 29.3 324 Pol
y
mer
ESR4
21.0 22.3 16.5 26.5 143
141
11.2 29.8 345
267
Air
21.0 22.3 16.5 26.5 156 11.2 29.9 337 Oil
21.0 22.3 16.5 26.5 162 11.2 29.8 360 Pol
y
mer
Table 8. Experimental data of thermomechanical treatment.
Initial dimension of steel: 22.7 x 22.7 mm, final dimension of steels: plate 11 x 29 mm,
temperature: 1
st
pass: 950C, final pass: 850C, ingot soaking temperature 1200C, soaking
time: 90 minutes. Fw
1
is load,
1
is stress, H
o
is initial height and B
o
initial width.
Fig. 10. Rolling stresses for first and final pass during hot rolling experiments.
Heat Transfer – Engineering Applications
326
stresses than that of ESR1. The result also shows that the stress for the final pass is much
higher than that for the first pass in all samples. The rolling torque is also shown in Figure
11. The four selected grades of steels underwent hot rolling as mentioned in the
experimental section, and were cooled in air, polymer-water mixture and oil after the final
rolling. It produced total of 12 plate samples of 11 x 29 mm cross section. Preliminary
investigation on the plates showed that no major surface defects like scaling, cracks, bends
etc were present on the plates.
Fig. 11. Rolling torques for first and final pass during hot rolling experiment.
3.3.1 Effect of cooling rate
The tensile strengths, yield strengths and elongations of the hot rolled plates in the three
cooling conditions are illustrated in Table 9. At the outset one can notice that in most of the
cases the tensile strength and yield strength increase as the severity of cooling increases, best
values being obtained with oil-cooled samples. It can also be seen that ductility is
marginally improved in the oil-cooled samples. The hardness and impact toughness of the
as rolled specimens in the three cooling conditions is shown in Table 10. It can be observed
that for all steels, hardness increased as cooling became faster. Air-cooling resulted in the
lowest hardness, and the highest hardness was observed in the oil cooled specimens.
Among the samples, lowest and highest hardness were measured in ESR1 (base alloy) and
ESR3 samples, respectively. Annealing of these samples resulted the decrease in hardness
values compared to as rolled condition. It is also seen from table 10 that except of one or two
cases, the impact toughness values also increase with increase of cooling rate. Highest
impact toughness is observed in oil cooled specimens.
Ultrahigh Strength Steel: Development of
Mechanical Properties Through Controlled Cooling
327
Sample
Air cooled Polymer-water cooled Oil cooled
UTS
(MPa)
Y. S
(MPa)
el
(%)
UTS
(MPa)
Y. S
(MPa)
el
(%)
UTS
(MPa)
Y. S
(MPa)
el
(%)
ESR 1 1818 1525 8.8 1883 1550 8.1 2030 1615 10.7
ESR 2 1925 1600 9.8 1920 1703 9.5 2062 1721 10.4
ESR 3 1990 1667 8.9 2054 1705 9.6 2214 1750 9.9
ESR 4 1941 1635 9.8 2002 1684 9.3 2181 1715 10.1
UTS: ultimate tensile strength, Y.S: Yield strength, el: Elongation
Table 9. Tensile properties of TMT plates.
Sample
Hot-rolled,
air-cooling
Hot-rolled,
polymer cooling
Hot-rolled,
oil-cooling
Hardness
(HRc)
Impact
toughness
(kJ.m
-2
)
Hardness
(HRc)
Impact
toughness
(kJ.m
-2
)
Hardness
(HRc)
Impact
toughness
(kJ.m
-2
)
ESR 1 44.3 391 45.7 421 48.0 516
ESR 2 48.6 629 48.1 655 49.3 742
ESR 3 48.3 496 51.2 467 52.5 564
ESR 4 48.4 439 50.9 546 51.7 516
Table 10. Impact strength and hardness of TMT plates.
It can be noticed that mechanical properties of the thermomechanically treated steels are
greatly influenced by the quenching medium as in evident from Table 9 and Table 10. The
mechanical properties are improved substantially with increase in cooling rate. After
thermomechanical treatment the as-cooled plate displays significant increase in yield
strength and toughness in compare to as-cast tempered alloys. The best combination of
strength and toughness has been observed in oil cooled specimens of ESR2 steel. The
optical metallography of one of the ESR2 alloy in three cooling conditions is given in
Figure 12. It can be seen that the structure becomes progressively finer as cooling rate
become faster. Figure 12 also reveals that in the slow cooling rate the microstructure
consists of many more phases. There may be some lath martensites along with austenite
and bainite in the matrix. Whereas, oil cooled plates consists of predominantly finer lath
martensite structures. The SEM micrographs of ESR2 alloy are also shown in Figure 13. It
can be seen that the microstructures of the specimens consist of lath martensites and more
uniformity and homogeneity is observed in the specimens those are cooled in faster rate.
Apparently it is also seen that the microstructures in oil cooled samples predominantly
consist of finer lath martenisites. The TEM micrographs of ESR2 sample in air cooled and
oil cooled samples are shown in Figure 14. The TEM micrograph reveals that air cooled
sample consist of lath martensite, bainite and some retained austenites. In oil cooled
sample the microstructure are mainly consist of lath martensites. The martesite interlath
spacing in oil cooled is observed about 200-300 nm whereas, it is 300-400 nm in the air
cooled sample. It can be noticed from Figure 15 that the specimens cooled at slower
cooling rates showed segregation of carbon, which indicates the presence of retained
austenite and bainite (Maity et al., 2008).
It is also inline with the predicted phase
Heat Transfer – Engineering Applications
328
transformation information as shown in Figure 9. According to CCT diagrams shown in
Figure 9, all investigated alloys had enough hardenability to get full martensitic
microstructure in cross-section of tested samples after oil quenching (cooling rate
normally greater than 15K/s) and mixed microstructures in air cooing (cooling rate less
than 1.5 K/s).
(a) Air cooling
(b)Polymer+water cooling
(c) Oil cooling
Fig. 12. Optical Micrographs of the TMT plates of ESR2 specimens cooled in different
cooling medium.
(a) Air cooled
(b)Polymer - water cooled
(c) Oil cooled
Fig. 13. SEM Micrographs of the TMT plates of ESR2 alloy cooled in different medium.
Ultrahigh Strength Steel: Development of
Mechanical Properties Through Controlled Cooling
329
(a) Air cooled
1: Retained austenite (RA)
2: Bainite (B)
3: Martensite (M)
Position 1: RA [111]
, z = [111
]
Position 2: Carbide precipitates in b.c.c.α
, , carbide
(100)
(011)
Position 3: M [011]
(b) Oil cooled
M [011]
, z = [011
Fig. 14. TEM micrographs and diffraction pattern of TMT plates of ESR2 specimens cooled
in air and oil showing:(a) the presence of martensite (M), retained austenite (RA) and bainite
(B) in air cooled sample, and (b) predominantly martensite (M) in oil cooled specimens.
Evidences for phase identification are collected through EPMA and TEM studies. If during
transformation, the temperature is high enough, carbon gets enough time to diffuse ahead of
the transformation front. Higher carbon regions should be found at the boundaries of
pockets of laths and retained austenite or in between upper bainite laths. Samples cooled in
different quenching medium (air, oil and polymer) were subjected to EPMA analysis to
reveal the segregation patterns, the results of which are presented in Figure 15 (Maity et al.,
2008). One can clearly see that segregation of carbon decreases as the severity of quench
increases. In the air-cooled sample, one can see peaks in carbon content nearly at regular
intervals of about 15-25 m. This may be due to retained austenite at the boundaries of
packets of laths. The individual laths being less than a micron wide, inter lath segregation
cannot be resolved in EPMA. In the specimen cooled at the intermediate quench rate
(polymer-water 1:1.5 mixture), the extent of segregation is less indicating carbon had less
time to diffuse. The interval between the peaks is also slightly less, indicating the size of
packets of laths are smaller. This is in tune with the optical/SEM micrographs. The oil-
Heat Transfer – Engineering Applications
330
cooled samples show very little long range segregation. Here the severity of quench has
been high enough, and carbon could not diffuse out and austenite could not be retained. The
improvement of mechanical properties in oil cooled specimens possibly due to the change of
the morphology of the microstructural changes due to the change of cooling rate.
(a)Air cooling
(b) Polymer cooling
(c)Oil cooling
Fig. 15. Electron probe microanalysis of the distribution of carbon in the central zone of the
hot rolled steel under different cooling conditions.
3.3.2 Effect of nickel and other alloying elements
As discussed, in ESR2, ESR3 and ESR4 steel deliberately 1% to 3% nickel are added to the
base composition of ESR1 alloy. It can be noticed from Table 9 and Table 10 that with
increase of nickel content in TMT plates in three different cooling conditions, the tensile
strength, and yield strength are progressively increased up to 0% to 2% with increase of
nickel content. In 3% nickel steel the tensile properties are in reverse in trend. Highest
tensile strength of 2214 MPa and yield strength 1750 MPa were obtained with 2% nickel in
ESR3 steel. Other steels have also displayed tensile strength values of about 2000 MPa in oil
cooled plates. As these steel has ductility values varies from 8-10%, so the change of
elongation is not so prominent. The room temperature impact toughness of the rolled
samples are shown in Table 10. It is interesting to see that the impact toughness in the most
of the cases increases from 0% to 1% nickel steel and further increase of nickel content
reduces the impact toughness. ESR1 (base alloy) displayed the lowest impact toughness and
Ultrahigh Strength Steel: Development of
Mechanical Properties Through Controlled Cooling
331
ESR2 with 1% nickel gave the highest. All nickel containing steels showed higher impact
toughness compared to the base alloy. This was the trend in the as-cast tempered steels too.
Lower additions (up to 1% Ni) could give better toughness without sacrificing yield
strength. In the alloys, all nickel containing as-cooled plate results better combination of
tensile properties and toughness compare to base alloy. In the nickel alloys, one can also
notice that the best combination of yield strength and toughness are obtained in the alloy
containing 1% nickel (ESR2). Higher nickel contents had improved the yield strength but
results comparatively lower impact toughness.
Generally nickel enlarges the γ phase region in Fe-C phase diagram, therefore it enables lower
austenitizing temperature of steel, which can promote refinement of structure. Decrease in the
martensite packet diameter, similar to the decrease of the grain size, improves the strength as
well as the toughness of steel (Tomita & Okabayashi, 1986). Nickel can also influence
increasing the stability of retained austenite (Rao & Thomas, 1980; Sarikaya et al., 1983)
and the
morphology of cementite precipitation at tempering (Peters, 1989). It is indeed happened in
case of nickel steels. The SEM micrographs as shown Figure 4 reveal that the laths in
martensite matrix are progressively finer with the increase of nickel content. Most of the cases,
nickel increases toughness, but it is effective when its amount is controlled in the steel
containing 1% Mn. Nickel increases the resistance to cleavage fracture of iron and decrease a
ductile-to-brittle transition temperature (Bhole et al., 2006). It is also reported that increase of
the nickel content, the grain boundary ferrite (GBF) and acicular ferrite (AF) decreases and as
a result of the reduction of both AF and GBF, the impact toughness decreases (Bhole, 2006).
It
is also reported that when in C-Mn steel containing 1.4% Mn, the toughness drops if nickel
content exceeds 2.25%. Kim et al. found that the combined presence of Ni and Mo decreases
the volume fraction of GBF (Kim et al., 2000).
This may be due to the improved wettability of
the Ni as binder on the carbide phase due to the addition of Mo. Improved wettability results
the decrease in micro-structural defects and an increase in the interphase bond strength and
phase uniformity. The increase in nickel results in the reduction of impact toughness. It may be
due to the significant reduction of the volume fraction of acicular ferrite or grain boundary
ferrite. The optical micrograph (Figure 3) reveals the presence of substantial amount of acicular
ferrite in ESR2 steel and trace amount in ESR3, but this phase could not be identified in ESR4
alloy. This may be one of the reason for the increase of impact toughness in ESR2 containing
1% nickel. It suggests that at the content of about 1% of nickel will have significant influence
on notch toughness in these types of steels.
Nickel being an austenite stabilizer leads to retained austenite on one hand, and on the other
hand it increases toughness, especially when the nickel content is low at about 1%. Nickel
leads to grain refinement and improve toughness when it is used in optimum amount. As a
result, all the alloys containing nickel showed high impact toughness after TMT and the one
with 1% nickel shows a best combination of strength and toughness. On the other hand, hot
rolling at temperatures just above AC
1
, has been shown to be feasible and effective method
to roll such high strength steel. It is also possible that ESR can be used effectively to reduce
the major casting defects and can control the macro- and micro-segregation.
3.4 General discussion
The objective of the present work rose out of the requirement of developing an ultra high
strength steel with a yield strength in excess of 1650 MPa, with a minimum elongation of 9-
10%. This material is being developed primarily for application in the area of pressure
Heat Transfer – Engineering Applications
332
vessels in aerospace vehicles. In such high strength alloys one needs to employ all modes of
strengthening. There are heat treatable alloys where strength is obtained from finer
martensites with additional precipitation hardening. The approach in the present work was
to adjust the chemistry and the production process to obtain a optimum morphology in the
microstructure in the as-cast steels. Further improvement was carried out by a optimised
thermomechanical treatment with controlled cooling. These two aspects formed two parts of
this work.
The primary alloying elements in this 0.3%C steel are chromium, molybdenum and
vanadium, which are all carbide/carbonitride formers. At temperatures below about 500C
almost all carbon is in various precipitates at equilibrium. To obtain optimum properties one
needs to balance the precipitation process between high and low temperatures. Precipitates
at soaking temperatures are needed to limit austenite grain growth and modify the
deformation processes. Management of precipitate size is extremely important here.
Precipitation at lower temperatures, especially of carbides of chromium and molybdenum,
can be coherent/semi-coherent and leads to large strength development during cooling and
tempering. The alloys could only be developed because of ESR processing. Normally, most
of the strengthening mechanisms lead to loss in ductility. The ability to ensure removal of all
large and medium sized inclusions from near directional solidification under a high
temperature gradient from a small liquid metal pool during the ESR process increases
ductility, toughness and workability. Most of the defects like micro-and macro-segregations,
micro porosities and looseness associated with solidification are nearly absent in ESR
processed materials. Nickel containing alloys showed finer grain sizes compare to the basic
steel. Addition of 1%Ni gave lower yield strength in combination with very high impact
toughness. Some improvement in strength was indeed obtained at higher nickel contents.
One reason for this behaviour may be the retention of austenite promoted by nickel. Softer
austenite distributed in small amounts interferes the crack propagation and improves the
impact toughness but decreases the strength at 1%Ni. Solid solution strengthening probably
becomes important at higher percentages, more than compensating for loss due to larger
proportion of retained austenite. These are the issues which need further exploration.
The thermomechanical treatment adopted, wherein the samples are rolled in the two phase
region finishing the deformation just above AC
1
, seems to have improved the properties
enormously. This strategy permitted rolling to be done with the existing equipment, and to
retain some work hardening effect to increase the strength. Controlled cooling allows one to
optimise the final microstructure. It has been demonstrated that it is possible to obtain the
optimum combination of strength and toughness by an appropriate control of processing
parameters such as reheat temperature, deformation temperature, deformation per pass,
cooling rate, etc. Cooling rate has large influence on the properties. Air-cooling generally
gave lower strengths and oil cooling the highest. Interestingly oil-cooling also gave higher
elongation, indicating the effect of auto-tempering. The microstructure in case of oil cooling
seems to largely consist of finer lath martensite. At air cooling, there were clear evidences of
retained austenite, bainite and martensite. It was also noticed that strength values increase
with the increase in cooling rate and the highest yield strength were obtained in oil-cooled
samples. Steels for aerospace and aircraft applications, need to possess ultrahigh strength
coupled with high toughness to ensure high reliability. The ingots produced in this study
are smaller size, however it should be brought to a practice of production of relevant level.
Ultrahigh Strength Steel: Development of
Mechanical Properties Through Controlled Cooling
333
4. Conclusions
1. ESR processed ingots has low inclusion content and good microscopic homogeneity.
2. The base alloy consists of predominantly lath martensite microstructure, having lath
sizes in the range of 550-700 nm. It contains complex carbonitrides precipitates of
vanadium, chromium and molybdenum, of 25-70 nm size. The alloy displays a yield
strength of about 1400 MPa, elongation of 11% and impact strength of 300 kJ/m
2
.
3. The addition of 1 to 3 % nickel to the base alloy improves most of the mechanical
properties. The yield strength of 1% nickel alloy is around 1500 MPa. The alloy
containing 3% nickel results a yield strength value of 1542 MPa.
4. The process parameters for thermomechanical treatment were optimised based on
model calculations and preliminary experiments. The treatment involved pre-rolling at
1200C, followed by soaking at 1200C and rolling in two passes starting from 950C
and 850C respectively.
5. The thermomechanical treatment applied in the two phase region and finishing at just
above AC
1
, seems to improve the mechanical properties enormously. This strategy
permits to roll this high strength steel with the existing equipment, and also helps to
retain work hardening to obtain yield strength in excess of 1700 MPa in some alloys.
6. After thermomechnical treatment all the four alloys showed UTS values in the range of
1800-2200 MPa and yield strength in excess of 1700 MPa.
7. The increase of nickel content up to 1% results in increase of toughness in both as-cast
tempered alloys and TMT plates. However, further increase of nickel did not beneficial
in this composition of alloys. The best combination of tensile strength, yield strength,
elongation and toughness are observed in 1% nickel alloy and may be the optimum
composition in all alloys.
8. It can be noticed that cooling rate has large influence on the microstructure and thereby
on the mechanical properties of the sample of thermomechanical treatment. It is found
that the air cooled sample consists of martensite, bainite and retained austenite. The oil
cooled sample consists of predominantly finer lath martensite. The air cooled sample
results in low strengths compare to oil cooled plate.
5. Acknowledgement
The author wishes to thank the Director, CSIR-National Metallurgical Laboratory (NML),
Jamshedpur, India. The authors are also thankful to DAAD and CSIR for facilitating the
research work in TU Bergademie Freiberg, Germany. The authors are also thankful to the
staffs of ferrous metallurgy of IIT Bombay and Dr. Klemn of Institute of Metal Forming of
TU Freiberg for help during experimentation and for many useful discussions. The authors
are also grateful to M. Chandra Shekhar, Manoj Gunjan, Dharambeer Singh and Anil Rajak.
6. References
Akhlaghi, S. & Yue, S. (2001). Effect of Thermomechanical Processing on the Hot Ductility of
a Nb–Ti Microalloyed Steel. The iron and Steel Institute of Japan International, Vol.41,
pp.1350-1356
Arsenault, R.J. (1967). The Double-Kink Model for Low-Temperature Deformation of B.C.C.
Metals and Solid Solutions. Acta Metllurgica, Vol.15, pp.501-501
Heat Transfer – Engineering Applications
334
Bhole, S. D.; Nemade, J. B; Collins, L. & Liu, Cheng.(2006). Effect of Nickel and Molybdenum
Additions on Weld Metal Toughness in a Submerged Arc Welded HSLA Line- Pipe
Steel. Journal of Material Processing Technology, Vol.173, pp.92-100
Bleck, W.; Müschenborn,W. & Meyer, L. (1988). Recrystallisation and Mechanical Properties
of Micro Alloyed Cold – Rolled Steel. Steel Research, Vol.59, pp.344-351
Chatterjee, M.; Balasubramanian, M. S.; Gupt, K. M. & Rao, P. K. (1990). Inoculation during
Electroslag Remelting of 15CDV6 Steel. Ironmaking Steelmaking, Vol.17, pp.38-42
Choudhary, M. & Szekely, Z. (1981). Modelling of Fluid Flow and Heat Transfer in
Industrial- Scale ESR System. Ironmaking Steelmaking, Vol.8, pp.225-232
Dhua, S. K.; Mukherjee, D. & Sarma, D. S. (2003). Influence of Thermomechanical
Treatments on the Microstructure and Mechanical Properties of HSLA-100 Steel
Plates. Metallurgical and Material Transaction A, Vol.34A, pp.241-253
Doktorowski. (2002). Freiberger Forschungshefte, Reihe B, Vol.319, pp.1-10
Floreen, S. (1978). Maraging steels, In: Metal Handbook (Vol.1, Ninth Edition), American
Society for Metals,pp.445-452, ISBN 0-87170-377-7 (v.1), Ohio
Gladman, T.; Dulieu, D. & Mcivor, I. D. (1975). Proceeding of Microalloying 75, pp.25-25,
Washington, 1975
Grange, R.A.; Hribal, C.R. & Porter, L.F. (1977). Hardness of Tempered Martensite in Carbon
and Low Alloy Steels. Metallurgical Transactions, Vol.8A, pp.1775-1785
Ion, J. C.; Easterling, K. E. & Ashby, M. F.(1984). A Second Report on Diagrams of
Microstructure and Hardness for Heat-Affected Zones in Welds. Acta Metallurgica,
Vol.32, pp.1949-1955
Jahazi, M. & Egbali, B.(2000). The Influence of Hot Rolling Parameters on the Microstructure
and Mechanical Properties of an Ultra-High Strength Steel. Journal of Material
Processing Technology, Vol.103, pp.276-279
Jolley, W. (1968). Effect of Mn and Ni on Impact Properties of Fe and Fe-C Alloys. Journal of
Iron Steel Institute, Vol.206, pp.170-173
Kawalla, R. & Lehnert, W. (2002). Hot Rolling in Ferrite Region. Scandinavian Journal of
Metallurgy, Vol. 31, pp.281-287
Kern, A.; Degenkolbe, J.; Müsgen, B. & Schriever, U. (1992). Computer Modelling for the
Prediction of Microstructure Development and Mechanical Properties of HSLA
Steel Plates. The iron and Steel Institute of Japan International, Vol.32, pp.387-394
Kim, I.S.; Reichel, U. & Dahl, W. (1987). Effect of Bainite on the Mechanical Properties of
Duel-Phase steels. Steel Research, Vol. 58, pp. 186-190
Kim, S.; Im, Y.R.; Lee, S.; Lee, H.C.; Oh, Y.J. & Hong, J.H. (2000). Journal of the Korean Institute
of Metals and Material, Vol.38, pp.771-778
Maity, S. K.; Ballal, N. B. & Kawalla, R. (2006). Development of Ultrahigh Strength Steel by
Electroslag Refining: Effect of Inoculation of Titanium on the Microstructures and
Mechanical Properties. The iron and Steel Institute of Japan International, Vol.46,
pp.1361-1370
Maity, S. K.; Ballal, N. B.; Goldhahn, G. & Kawalla, R. (2008a). Development of Low Alloy
Titanium and Niobium Micro Alloyed Ultra High Strength Steel through
Electroslag Refining. Ironmaking Steelmaking
, Vol.35, pp.379-386
Ultrahigh Strength Steel: Development of
Mechanical Properties Through Controlled Cooling
335
Maity, S. K.; Ballal, N. B.; Goldhahn, G. & Kawalla, R. (2008b). Development of Low Alloy
Ultrahigh Strength Steel. Ironmaking Steelmaking, Vol.35, pp.228-240
Maity, S. K.; N. B. Ballal.; Goldhahn, G. & Kawalla, R. (2009). Development of Ultrahigh
Strength Low Alloy Steel through Electroslag Refining Process. The iron and Steel
Institute of Japan International, Vol.49, pp. 902-910
Malakondaiah, G.; Srinivas, M. & Rama-Rao, P. (1997). Ultrahigh-Strength Low-Alloy Steels
with Enhanced Fracture Toughness. Progress in Material Science, Vol.42, pp. 209-242
Norstr¨om, L Å. & Vingsbo, O. (1979). Influence of Nickel on Toughness and Ductile-Brittle
Transition in Low-Carbon Martensite Steels. Metal Science,Vol.13, pp.677-684
Peters, J. A.; Bee, J. V.; Kolk, B. & Garrett, G. G. (1989). On the Mechanisms of Tempered
Martensite Embrittlement. Acta Metallurgica, Vol.37, pp.675-686
Phaniraj, M. P.; Behera, B. B. & Lahiri A. K. (2005). Thermo-Mechanical Modeling of two
Phase Rolling and Microstructure Evolution in the Hot Strip Mill: Part I. Prediction
of Rolling Loads and Finish Rolling Temperature. Journal of Material Processing
Technology, Vol.170, pp.323-335
Philip,T.V.& McCaffy,T.J.(1990). Properties and Selection: Iron, Steels and High Performance
Alloys, In: Metals Handbook (Vol.1, Tenth Edition), ASM International, pp. 431-448,
ISBN 0-87170-377-7 (v.1), Ohio
Philip,T,V. (1978). Ultra High Strength Steel, Properties and Selection; Iron and Steels, In:
Metal Handbook (Vol.1, Ninth Edition), American Society for Metals, pp. 421-443,
ISBN 0-87170-007-7, Ohio
Philip, T. V. (1975). ESR: A means of Improving Transverse Mechanical Properties in Tool
and Die Steel, In : Metals Technology, pp. 554-555
Rao, B. V. Narasimha & Thomas, G. (1980). Structure – Property Relations and Design of Fe-
4Cr- C Base Structural Steel for High Strength and Toughness. Metallurgical
Transactions A, Vol.11A, pp.441-457
Sarikaya, M.; Jhingan, A.K. & Thomas, G. (1983). Retained Austenite and Tempered
Martensite Embrittlement in Medium Carbon Steel. Metallurgical Transactions A,
Vol.14A, pp.1121-1131
Sellars, C.M.(1985). Proceeding on HSLA steels: Metallurgy and Applications, Ed. by J. M.
Gray, ASM, Beijing
Shash, Y. M.; Gammal, T. E.; Salamoni, M. A. E. & Denkhaus, F. A.(1988). Improving
Solidification Pattern of ESR Ingots Combined with Energy Savings, Steel Research,
Vol.59, pp.269-274
Suresh, M. R.; Samajdar, I.; Ingle, A.; Ballal, N. B.; Rao, P. K. & Sinha, P. P. (2003). Structure-
Property Changes during Hardening and Tempering of New Ultra High Strength
Medium Carbon Low Alloy Steel. Ironmaking Steelmaking, Vol.30, pp.379-384
Tanaka, T. (1981). Controlled Rolling of Steel Plate and Strip. International Metal Review,
Vol.26, pp.185-212
Tomita, Y. & Okabayashi, K. (1986). Effect of Micro Structure on Strength and Toughness of
Heat-Treated Low Alloy Structural Steel. Metallurgical Transactions, Vol.17A,
pp.1203-1209
Umemoto, M.; Guo, Z. H. & Tamura, I. (1987). Effect of Cooling Rate on Grain Size of Ferrite
in a Carbon Steel. Material Sciences and Technology, Vol.3, pp.249-255
Heat Transfer – Engineering Applications
336
Yu, H.; Kang, Y.; Zhao, Z.; Wang, X. & Chen, L. (2006). Microstructural Characteristics and
Texture of Hot Strip Low Carbon Steel Produced by Flexible Thin Slab Rolling with
Warm Rolling Technology. Material Characterisation, Vol.56, pp.158-164
Zouhar, G. (1970). Grundlagen der Bildsamen Formunng, Lehrbrief No.2, TU Bergakademie
Freiberg, Fernstudium, pp.1-7
Part 3
Air Cooling of Electronic Devices
14
Air Cooling Module Applications
to Consumer-Electronic Products
Jung-Chang Wang
1
and Sih-Li Chen
2
1
National Taiwan Ocean University
2
National Taiwan University
Taiwan, R.O.C.
1. Introduction
The purpose of this chapter is to describe how a air-cooling thermal module is comprised
with single heat sink, two-phase flow heat transfer modules with high heat transfer
efficiency, to effectively reduce the temperature of consumer-electronic products as Personal
Computer (PC), Note Book (NB), Server including central processing unit (CPU) and
graphic processing unit (GPU), and LED lighting lamp of smaller area and higher power.
The research design concentrates on several air-cooling thermal modules. For air cooling,
the extended surface, such as fin is usually added to increase the rate of heat removal. The
heat capacity from heat source conducted and transferred through heat sink to the
surroundings by air convection. Thus, the aim of adding fin is to help dissipate heat flow
from heat source. The air convection heat transfer mechanism was shown in the figure 1,
which can be separated into forced and free/nature convection through dynamic fluid
device as fan. The chapter is divided into three parts; first part discusses optimum,
performance analysis and verification of a practical convention parallel plate-fin heat sink.
Second part employs two-phase flow heat transfer devices, such as heat pipe, thermosyphon
and vapor chamber comprised with heat sink to consumer-electronic products. The last part
utilizes air-cooling thermal module in other industrial areas including injection mold and
large motor.
A conventional plate-fin heat sink is composed of a plate-fin heat sink and a fan. Thermal
resistance network is often employed to analyze the thermal model and system in the
industry. The overall thermal resistance includes interface resistance, base-conduction
resistance, and convective resistance. It is worth developing a model for a conventional air-
cooling device that takes heat sink configuration and airflow conditions into account in
order to predict the device’s thermal performance when developing laminar-, transition-,
and turbulent-flow regimes. Although, solving the high heat capacity of electronic
components has been to install a heat sink with a fan directly on the heat source, removing
the heat through forced convection. Increasing the fin surface and fan speed are two direct
heat removal heat sink in order to solve the ever increasing high heat flux generated by heat
source from consumer-electronic products. They can reduce the total thermal resistance
from 0.6 °C/W to 0.3 °C/W. Lin & Chen (2003) and Wu et al. (2011) has been developed an
analytical all-in-one asymptotic model to predict the hydraulic and thermal performance of
Heat Transfer – Engineering Applications
340
a practical heat sink including a rectangular base plate and parallel fins with a non-uniform
heat source, which proposed for a wide range of Reynolds and Nusselt numbers, including
laminar, transition, and turbulent flows. However, increasing the surface area results in an
increase in cost and boosting the fan speed results in noise, vibration and more power
consumption, which increases the probability of failure to consumer-electronic components.
Its total thermal resistance is usually over 0.3 °C/W not adjust high heat capacity; A two-
phase flow heat transfer module with high heat transfer efficiency, to effectively reduce the
temperature of heat sources of smaller area and higher power.
(a) Forced Convection (b) Free Convection
Fig. 1. Air convection mechanism
In recent years, technical development related with the application of two-phase flow heat
transfer assembly to thermal modules has become mature and heat pipe-based two-phase
flow heat transfer module is one of the best choices (Wang, 2008). A heat sink with
embedded heat pipes transfers the total heat capacity from the heat source to the base plate
with embedded heat pipes and fins sequentially, and then dissipates the heat flow into the
surrounding air. Wang et al. (2007) have experimentally investigated the thermal resistance
of a aluminium heat sink with horizontal embedded two and four U-shape heat pipes of 6
mm diameter; they showed that two heat pipes embedded in the base plate carry 36 percent
of the total dissipated heat capacity from Central Process Unit (CPU), while 64% of heat was
delivered from the base plate to the fins. Furthermore, when the CPU power was 140 W, the
total thermal resistance was at its minimum of 0.27 °C/W. And using four embedded heat
pipes carry 48 percent of the total dissipated heat capacity from CPU; the total thermal
resistance is under 0.24 °C/W. The total thermal resistance of the heat sink with embedded
heat pipes is only affected by changes in the base to heat pipes thermal resistance and heat
pipes thermal resistance over the heat flow path; that is, the total thermal resistance varies
according to the functionality of the heat pipes. If the temperature of the heat source is not
allowed to exceed 70 °C, the total heating powers of heat sink with two and four embedded
heat pipes will not exceed 131 Wand 164 W respectively. The superposition principal
analytical method for the thermal performance of the heat sink with embedded heat pipes is
completely established (Wang, 2009). The thermal performance of a heat sink with
embedded heat pipes has been developed a Windows program for rapidly calculating
through Visual Basic commercial software (Wang, 2010a). The computing core of this
Windows program employs the theoretical thermal resistance analytical approach with
iterative convergence to obtain a numerical solution. The estimation error between the
numerical and experimental solutions is less than ±5%. The optimum inserting heights with
total fin height are also obtained through the fitting curves generated in the program. From
this Windows program, the optimum height of the embedded heat pipes inserted through
fins is 21mm and 15mm for one pair and two pairs of embedded heat pipes, respectively. If
Air Cooling Module Applications to Consumer-Electronic Products
341
the heat sink is considered in different orientations with respect to gravity, the results may
be different. Finally, this Windows program has the advantage of rapidly calculating the
thermal performance of a heat sink with embedded heat pipes installed horizontally with a
processor by inputting simple parameters.
Moreover, one set of risers of the L-shape heat pipes were functioning as the evaporating
section while the other set acted as condensing section. Six L-type heat pipes are arranged
vertically in such a way that the bottom acts as the evaporating section and the risers act as
the condensing section (Wang, 2011b). It describes the design, modeling, and test of a heat
sink with embedded L-shaped heat pipes and plate fins. This type of heat sink is particularly
well suited for cooling electronic components such as microprocessors using forced
convection. The mathematical model includes all major components from the thermal
interface through the heat pipes and fins. It is augmented with measured values for the heat
pipe thermal resistance. A Windows-based computer program also uses an iterative
superposition method to predict the thermal performance. The sum of the bypass heating
power ratios is 14.4% for Q1 and Q2, 20.8% for Q3 and Q4, and 52% for Q5 and Q6, obtained
using both the experimental results and the software program based on VB6.0. Thermal
performance testing shows that a representative heat sink with six heat pipes will carry
160W and has reached a minimum thermal resistance of 0.22 °C/W. The computer software
predicted a thermal resistance of 0.21 °C/W, which was within 5% of the measured value.
Moreover, the total thermal resistance of the heat sink with six embedded L-type heat pipes
is only affected by changes in the base to heat pipes thermal resistance and heat pipes
thermal resistance over the heat flow path. That is, the total thermal resistance varies
according to the functionality of the L-type heat pipes. The index of the thermal
performance of a heat pipe for a thermal module manufacturer is the temperature difference
between the evaporation and condensation sections of a single heat pipe and maximum heat
capacity. The maximum heat capacity reaches the highest point, as the amount of the non-
condensation gas of a heat pipe is the lowest value and the temperature difference between
evaporation and condensation sections is the smallest one. The temperature difference is
under 1°C while the percentage of the non-condensation gas is less than 8 × 10
-5
%, and the
single heat pipe has the maximum heat capacity (Wang, 2011a). To establish a practical
quick methodology that can effectively and efficiently determine the thermal performances
of heat pipes so as to substitute the use of the conventional steady-state test. A novel
dynamic test method is originated and developed (Tsai et al. 2010a). With a view toward
shortening the necessary time to examine the thermal performances of heat pipes, a novel
dynamic test method is originated and compared to the conventional steady-states test. The
dynamic test can be adopted as a serviceable method to determine thermal performances of
heat pipes. Only 10-15 min is necessary to examine a heat pipe using the dynamic test. This
is much more efficient than the steady-state test and would be greatly beneficial to the
notebook PC industry or other heat dissipation technologies that use heat pipes.
Liquid cooling technology employs the excellent thermal performance of liquid to quickly
take away the heat capacity from a heat source. The method by which liquid contacts the
heat source can be divided into two types, including immediacy and mediacy. And
thermoelectric cooler (TEC) has been applied to electronic cooling with its advantages of
sensitive temperature control, quietness, reliability, and small size. Thermoelectric cooler is
regarded as a potential solution for improving the thermal performances of cooling devices
on the package. Huang et al. (2010) have combined TEC and water-cooling device to
Heat Transfer – Engineering Applications
342
investigate the thermal performance. An analytical model of the thermal analogy network is
provided to predict the cooling capability of the thermoelectric device. The prediction by the
theoretical model agrees with the experimental results. Increasing the electric current not
only enhances the Peltier effect, but also increases Joule heat generation of the TEC.
Therefore, an optimum electric current of 7 A is determined to achieve the lowest overall
thermal indicator at a specific heat load. A water-cooling device with a TEC is helpful to
enhance the thermal performance when the heat load is below 57 W. Comparing with
thermoelectric air-cooling module for electronic devices (Chang et al. 2009), the optimum
input currents are from 6 A to 7 A at the heat loads from 20W to 100 W. The result also
demonstrates that the thermoelectric air-cooling module performs better performance at a
lower heat load. The lowest total temperature difference-heat load ratio is experimentally
estimated as 0.54 °C/W at the low heat load of 20 W, while it is 0.664 °C/W at the high heat
load of 100 W. In some conditions, the thermoelectric air-cooling module performs worse
than the air cooling heat sink only.
In indirect liquid cooling technology, the outer surface of the chamber containing the
working fluid makes contact for the required cooling of the electronic components. The heat
capacity transfers to the working fluid through the chamber for heat dissipation. The
driving force can be divided into active and passive by the way of the working fluid. The
main objective of a passive liquid cooling system is not to use components, such as a pump,
to drive the working fluid cycle. At present, the development of passive and indirect liquid
cooling technology includes heat pipes, and vapor chambers composed of thermosyphon
thermal modules, which have been applied in a variety of high heat-flux electronic
components. Due to the demand for different heat transfer components, a two-phase
thermosyphon can be divided into closed-loop and closed types. Two-phase closed-loop
thermosyphon thermal modules are all two-phase change heat transfer components, their
operating principle is to transfer heat capacity for cooling purposes by boiling and
condensation of the phase change of the working fluid. Thus, finding how to enhance the
boiling mechanism and reduce the thickness of condensation film will determine the
operating thermal performance of the thermal module. This module offers the same vapor
and liquid flow direction without the limitations of traditional heat pipes. Dissipation of the
heat capacity of the heat source is conducted by forced convection to the atmosphere around
the condenser section. This is because the vapor pressure in the evaporator section through
the connecting pipe to condensation caused by the pressure drop. Therefore, the two-phase
closed-loop thermosyphon thermal module has a water level difference within the
evaporator and condenser. Furthermore, the different cooling fin groups in the thermal
module and the condensing capacity of the evaporator section and condenser section are in
contact with the working fluid of the different cross-sectional areas. Therefore, the water
level is significantly different on the left and right sides of the evaporation section and the
condensation section of the internal working fluid of the two-phase closed-loop
thermosyphon thermal module. Therefore, it is important to note the vapor pressure
difference caused by the water level in the design of this type of thermal module.
The two-phase closed thermosyphon cooling system is combined with a vapor-chamber
formed evaporator to gain the advantages of vapor chamber (Chang et al. 2008; Tsai et al.
2010b). The facility allows different structured surfaces to be applied, and the effects of
heating powers, fill ratios of working fluid, and types of evaporation-enhanced surfaces on
the performance of the two-phase closed thermosyphon vapor-chamber system are
Air Cooling Module Applications to Consumer-Electronic Products
343
investigated and discussed. A thermal resistance net work is developed in order to study the
effects of heating power, fill ratio of working fluid, and evaporator surface structure on the
thermal performance of the system. Other words, the experimental parameters are different
evaporation surfaces, fill ratios of working fluid and input heating powers. The results
indicate that either a growing heating power or a decreasing fill ratio decreases the total
thermal resistance, and the surface structure also influences the evaporator function
prominently. An optimum overall performance exists at 140W heating power and 20% fill
ratio with sintered surface, and the corresponding total thermal resistance is 0.495 °C/W. A
growing fill ratio significantly enlarges the saturation pressure and temperature of the
system, and results in worse performance of the condenser. The heat transfer mechanism of
the three surfaces all can be ranked as boiling dominated. The result shows that the
evaporation resistance and the condensation resistance both grow with increasing heating
power and decreasing fill ratio. Flooding is found at the fill ratio of 20% with the
evaporation surface noted Etched Surface 2 when heating power is above 120 W. Flooding
phenomenon is caused by the opposite flow direction of vapor and liquid in a closed two-
phase system. According to the result, the lowest total thermal resistance is 0.65 °C/W by
the evaporation surface noted Etched Surface 2 at 30% fill ratio. Flooding phenomenon
occurs as the system operated at low fill ratio and high input heating power. The flooding
operation point for this system has been predicted by correlation, and the prediction is
closed to the experimental results.
Vapour has advantages of fast, large amount and safety. Another two-phase heat transfer
device is the Vapour Chamber (V.C.) inside vapour-liquid working, which has better
thermal performance than metallic material in a large footprint heat sink. The overall
operating principle of V.C. is defined as follows: at the very beginning, the interior of the
vapor chamber is in the vacuum, after the wall face of the cavity absorbing the heat from its
source, the working fluid in the interior will be rapidly transformed into vapour under the
evaporating or boiling mechanism and fill up the whole interior of the cavity, and the
resultant vapor will be condensed into liquid by the cooling action resulted from the
convection between the fins and fan on the outer wall of the cavity, and reflow to the place
of the heat source along the capillary structure. The effectiveness and better thermal
performance of vapour chamber has been already confirmed according up-to-date
researches and mass production application in server system and VGA thermal module.
Moreover, vapour chamber-based thermal module has existed in the thermal-module
industry for a year or so especially in server application (Wang & Chen 2009; Wang 2010;
Wang et al. 2011a). A novel formula for effective thermal conductivity of vapor chamber has
been developed by use of dimensional analysis in combination with thermal-performance
experimental method (Wang & Wang 2011b). It respectively discussed these values of one,
two and three-dimensional effective thermal conductivity and compared them with that of
metallic heat spreader. For metallic materials as the heat spreaders, their thermal
conductivities have constant values when the operating temperature varies not large. The
thermal conductivities of pure cooper and aluminum as heat spreaders are 401 W/m°C and
237 W/m°C at operating temperature of 27 °C, respectively. When the operating
temperature is 127 °C, they are 393 W/m°C and 240 W/m°C, respectively. Results show that
the two and three-dimensional effective thermal conductivities of vapor chamber are above
two times higher than that of the copper and aluminum heat spreaders, proving that it can
effectively reduce the temperature of heat sources. The maximum heat flux of the vapor