Human Musculoskeletal Biomechanics Part 7 docx
Bạn đang xem bản rút gọn của tài liệu. Xem và tải ngay bản đầy đủ của tài liệu tại đây (259.62 KB, 20 trang )
Cervical Spine Anthropometric and Finite Element Biomechanical Analysis
111
C3 C4 C5 C6 C7
Mean Std dev Mean Std dev Mean Std dev Mean Std dev Mean Std dev
EPItu 5.0 4.1 5.2 5.2 7.1 1.2 5.8 0.6 5.8 0.8
EPItl 3.3 0.5 3.5 0.7 2.7 0.3 4.2 0.4 5.1 0.5
PDIsl -42.9 1.0 -44.0 1.3 -46.3 1.0 -41.9 1.6 -30.6 1.1
PDIsr 39.6 1.0 38.9 1.1 38.1 1.6 38.5 2.3 30.3 0.9
PDItl -4.8 1.0 -3.2 0.7 2.6 0.7 4.8 1.0 5.8 0.7
PDItr -6.5 1.0 -5.4 1.1 4.9 1.0 6.0 1.3 3.1 0.7
Table 3. Angular measurements from Tan study (degrees) (Tan, Teo and Chua, 2004)
1.3 Analysis
To find correlations present in the anthropometrics of the vertebral bodies in the cervical
spine, statistical analysis was completed on each vertebral segment from C3 to C7. Initially,
investigation into the C3 vertebra was completed, starting with the linear measurements. As
an example, the C3_EPWu was compared to all 24 other measured parameters of the C3
vertebra. This resulted in 14 linear measurements compared to 24 other measurement
parameters for the C3 vertebra, resulting in a total of 336 comparisons.
From analysis of the C3 linear measurements it was found that there were 8 significant
correlations present among all 336 comparisons. These results are shown in Table 4. The
dependent variables are listed first with the regressor/independent showing second. The
first case illustrates that the C3_PDWr is the dependent variable and C3_VBHp is the
regressor or independent variable. From analysis of the area measurements of the C3
vertebra, only one significant correlation was present among 120 comparisons (Table 5).
Finally when comparing the angular measurements of the C3 vertebra, it was found that
there were 2 significant correlations among a total of 144 comparisons (Table 6).
The examination of the other vertebral segments, from C4 to C7, was accomplished in a
similar fashion. Analysis of the C4 vertebra resulted in extensively more significant
relationships than were found in C3 with a total of 23 significant correlations.
Comparisons of the linear measurements of the C4 vertebra yielded 12 strong relationships,
and these results are shown in Table 7. From investigation into the area measurements of the
C4 vertebra, it was found that there were five comparisons of anthropometrics that had a
considerable link among 120 comparisons (shown in Table 8). Finally when comparing the
angular measurements of the C4 vertebra to the other 24 measurements (include all three
forms of linear, area, and angular), there were 6 strong relationships found from the 144
total comparisons. All of the significant correlations of the angular measurements can be
found in Table 9.
In completing the investigation into the C5 vertebra, it was again found to have increasingly
more relationships, with a total of 40 strong correlations. The comparisons of the linear
measurements of the C5 vertebra to the rest of the anthropometric measurements resulted in
the most relationships; these are displayed in Tables 10 and 11. Of these comparisons there
were 21 relationships found in the C5 vertebral body anthropometrics. With the
investigation into the area measurements of the C5 vertebra, it was found that there were 10
significant correlations from a total of 120 comparisons completed. Finally in investigating
Human Musculoskeletal Biomechanics
112
ANOVA Parameter Estimates
Y-intercept Slope
P P (y-intercept)
P (re
g
ressor/
independent)
PDWr vs.
VBHp
0.0424 <0.0001 0.0424
8.34113 -0.3523
Si
g
nificant Si
g
nificant Not Si
g
nificant
PDWr vs.
SCW
0.0166 0.0043 0.0166
2.39346 0.10409
Si
g
nificant Si
g
nificant Si
g
nificant
SCD vs.
PDHl
0.0085 <0.0001 0.0085
12.88191 -0.3927
Si
g
nificant Si
g
nificant Si
g
nificant
TPW vs.
EPItl
0.0324 <0.0001 0.0324
40.20551 0.3705
Si
g
nificant Si
g
nificant Not Si
g
nificant
TPW vs.
PDIsr
0.0068 <0.0001 0.0068
50.21888 -0.22291
Si
g
nificant Si
g
nificant Si
g
nificant
VBHa vs.
EPDu
0.0062 <0.0001 0.0062
17.51686 -0.55302
Si
g
nificant Si
g
nificant Si
g
nificant
VBHa vs.
PDAl
0.0149 <0.0001 0.0149
11.47438 -0.05326
Si
g
nificant Si
g
nificant Si
g
nificant
VBHp vs.
PDWr
0.0024 <0.0001 0.0024
10.52205 0.15663
Si
g
nificant Si
g
nificant Si
g
nificant
Table 4. C3 Linear measurements
ANOVA Parameter Estimates
Y-intercept Slope
P P (y-intercept)
P (re
g
ressor/
independent)
PDAl vs.
EPAu
0.0061 0.0024 0.0061
14.53586 0.08468
Significant Significant Significant
Table 5. C3 Area measurements
ANOVA Parameter Estimates
Y-intercept Slope
P P (y-intercept)
P (re
g
ressor/
independent)
EPItl vs.
EPWu
0.0124 0.0413 0.0124
15.04667 -0.85215
Significant Not Significant Significant
EPItu vs.
EPDu
0.0419 0.0355 0.0419
33.19859 -2.07824
Significant Not Significant Not Significant
Table 6. C3 Angular measurements
Cervical Spine Anthropometric and Finite Element Biomechanical Analysis
113
ANOVA Parameter Estimates
P P (y-intercept)
P (regressor/
independent)
Y-intercept Slope
EPDl vs.
SPL
0.0245 0.0006 0.0245
9.21517 0.19714
Significant Significant Significant
EPDu vs.
EPWu
0.02 <0.0001 0.02
10.32639 0.24868
Significant Significant Significant
EPWl vs.
PDItr
0.0326 <0.0001 0.0326
15.10987 0.01808
Significant Significant Not Significant
EPWu vs.
PDWr
0.0248 <0.0001 0.0248
15.14845 -0.10029
Significant Significant Significant
PDHr vs.
EPDl
0.0303 <0.0001 0.0303
8.23208 -0.10071
Significant Significant Not Significant
PDWl vs.
EPDl
0.0076 0.0003 0.0076
2.66256 0.12866
Significant Significant Significant
SCD vs.
EPItu
0.0207 <0.0001 0.0207
10.30332 0.01353
Significant Significant Significant
SCW vs.
VBHa
0.0056 <0.0001 0.0056
13.58683 0.56164
Significant Significant Significant
SCW vs.
TPW
0.0323 <0.0001 0.0323
23.82069 -0.11106
Significant Significant Not Significant
TPW vs.
EPDu
0.0108 <0.0001 0.0108
68.19806 -1.95975
Significant Significant Significant
TPW vs.
SCW
0.0323 <0.0001 0.0323
49.4967 -0.41322
Significant Significant Not Significant
VBHp vs.
PDAl
0.0348 <0.0001 0.0348
9.47331 0.06488
Significant Significant Not Significant
Table 7. C4 Linear Measurements
the relationships present in the C5 vertebra angular measurements and the other
anthropometric measurements, 9 significant correlations were found. The strong
relationships that were present in the C5 vertebra’s angular measurements are displayed in
Table 13.
Human Musculoskeletal Biomechanics
114
ANOVA Parameter Estimates
P P (y-intercept)
P (regressor/
independent)
Y-intercept Slope
EPAu vs.
EPWu
0.0104 0.66909 0.0104
-34.27382 13.8368
Significant Not Significant Significant
EPAu vs.
VBHa
0.0219 <0.0001 0.0219
204.59603 -3.58479
Significant Significant Significant
EPAu vs.
PDWl
0.0288 <0.0001 0.0288
143.55496 5.63237
Significant Significant Not Significant
EPAu vs.
PDItl
0.0046 <0.0001 0.0046
161.94009 -2.29035
Significant Significant Significant
SCA vs.
SCW
0.0066 0.0093 0.0066
78.19896 4.24208
Significant Significant Significant
Table 8. C4 Area Measurements
ANOVA Parameter Estimates
P P (y-intercept)
P (regressor/
independent)
Y-intercept Slope
EPItl vs.
EPDl
0.0191 0.3069 0.0191
-2.63366 0.40237
Significant Not Significant Significant
EPItl vs.
VBHp
0.0064 0.0781 0.0064
-6.16074 0.8523
Significant Not Significant Significant
EPItl vs.
SCW
0.0345 0.4489 0.0345
-1.91019 0.27823
Significant Not Significant Not Significant
PDIsl vs.
SCW
0.0437 <0.0001 0.0437
-55.42757 0.59539
Significant Significant Not Significant
PDIsl vs.
EPItl
0.0178 <0.0001 0.0178
-42.30098 -0.46784
Significant Significant Significant
PDIsr vs.
VBHp
0.0076 <0.0001 0.0076
24.45626 1.27529
Significant Significant Significant
Table 9. C4 Angular Measurements
Cervical Spine Anthropometric and Finite Element Biomechanical Analysis
115
ANOVA Parameter Estimates
Y-intercept Slope
P P (y-intercept)
P (regressor/
independent)
EPDl vs
SCW
0.0272 <0.0001 0.0272
11.78609 0.1654
Significant Significant Not Significant
EPDl vs SCA
0.0014 <0.0001 0.0014
17.20746 -0.01233
Significant Significant Significant
EPDu vs
SCA
0.0415 <0.0001 0.0415
13.85796 0.0026
Significant Significant Not Significant
EPDu vs
PDItl
0.0405 <0.0001 0.0405
14.22233 0.02818
Significant Significant Not Significant
EPWl vs
PDWr
0.0394 <0.0001 0.0394
15.30981 0.11428
Significant Significant Not Significant
EPWu vs
VBHa
0.0353 <0.0001 0.0353
15.79112 -0.09338
Significant Significant Not Significant
EPWu vs
EPAu
0.0465 <0.0001 0.0465
14.35019 0.00291
Significant Significant Not Significant
PDHl vs
PDWl
0.0207 0.0426 0.0207
2.90559 0.70698
Significant Not Significant Significant
PDHl vs
PDIsr
0.0488 <0.0001 0.0488
7.36108 -0.02888
Significant Significant Not Significant
PDWl vs
PDHl
0.0207 <0.0001 0.0207
4.23321 0.0756
Significant Significant Significant
PDWl vs
PDAr
0.0189 <0.0001 0.0189
5.30502 -0.02109
Significant Significant Significant
PDWr vs
EPWl
0.0394 0.722 0.0394
-1.01063 0.37265
Significant Not Significant Not Significant
PDWr vs
EPItu
0.026 <0.0001 0.026
4.64358 0.03596
Significant Significant Not Significant
PDWr vs
PDItl
0.0213 <0.0001 0.0213
4.7488 0.06132
Significant Significant Significant
SCD vs
VBHp
0.033 0.4903 0.033
2.50118 0.69204
Significant Not Significant Not Significant
SCD vs
EPAu
0.0167 <0.0001 0.0167
12.49697 -0.01164
Significant Significant Significant
SCW vs
EPDl
0.0272 <0.0001 0.0272
15.81713 0.29501
Significant Significant Not Significant
SPL vs
PDItr
0.0117 <0.0001 0.0117
34.72062 -0.23666
Significant Significant Significant
VBHa vs
EPWu
0.0353 <0.0001 0.0353
16.67726 -0.47571
Significant Significant Not Significant
Table 10. C5 Linear Measurements (Part 1)
Human Musculoskeletal Biomechanics
116
ANOVA Parameter Estimates
Y-intercept Slope
P P (y-intercept)
P (regressor/
independent)
VBHp vs
SCD
0.033 <0.0001 0.033
10.60996 0.06583
Significant Significant Not Significant
VBHp vs
PDAl
0.0163 <0.0001 0.0163
10.72456 0.0205
Significant Significant Significant
Table 11. C5 Linear Measurements (Part 2)
ANOVA Parameter Estimates
Y-intercept Slope
P P (y-intercept)
P (regressor/
independent)
EPAl vs.
EPDl
0.0126 <0.0001 0.0126
418.92547 -8.70812
Significant Significant Significant
EPAu vs.
EPDl
0.0356 0.0001 0.0356
122.32733 4.3305
Significant Significant Not Significant
EPAu vs.
SCD
0.0317 <0.0001 0.0317
21.37129 2.08213
Significant Significant Not Significant
EPAu vs.
PDAl
0.0282 <0.0001 0.0282
156.25957 1.14813
Significant Significant Not Significant
PDAl vs.
VBHp
0.0163 0.7504 0.0163
-4.13231 2.80491
Significant Not Significant Significant
PDAr vs.
PDWl
0.0189 <0.0001 0.0189
40.73714 -2.60613
Significant Significant Significant
PDAr vs.
PDIsr
0.0178 <0.0001 0.0178
23.56205 0.12563
Significant Significant Significant
PDAr vs.
PDItr
0.0356 <0.0001 0.0356
29.53373 -0.21079
Significant Significant Not Significant
SCA vs.
EPDu
0.0415 0.5788 0.0415
-61.91478 16.06134
Significant Not Significant Not Significant
SCA vs.
EPDl
0.0014 <0.0001 0.0014
290.35634 -8.10387
Significant Significant Significant
Table 12. C5 Area Measurements
Cervical Spine Anthropometric and Finite Element Biomechanical Analysis
117
ANOVA Parameter Estimates
Y-intercept Slope
P P (y-intercept)
P (regressor/
independent)
EPItu vs.
PDWr
0.026 0.8775 0.026
0.46263 1.37892
Significant Not Significant Not Significant
PDIsl vs.
PDItl
0.0488 <0.0001 0.0488
-45.50392 -0.24512
Significant Significant Not Significant
PDIsr vs.
PDHl
0.0488 <0.0001 0.0488
47.54716 -1.35216
Significant Significant Not Significant
PDIsr vs.
PDAr
0.0178 <0.0001 0.0178
26.44105 0.44528
Significant Significant Significant
PDItl vs.
EPDu
0.0405 0.0701 0.0405
-18.8499 1.4951
Significant Not Significant Not Significant
PDItl vs.
PDWr
0.0213 0.3461 0.0213
-1.71369 0.86345
Significant Not Significant Significant
PDItl vs.
PDIsl
0.0488 0.1931 0.0488
-4.82456 -0.15925
Significant Not Significant Not Significant
PDItr vs. SPL
0.0117 0.0001 0.0117
13.95113 -0.26654
Significant Significant Significant
PDItr vs.
PDAr
0.0356 0.0002 0.0356
10.99851 -0.21019
Significant Significant Not Significant
Table 13. C5 Angular Measurements
In the analysis of the C6 vertebra 22 strong relationships, less than what was seen in the C5
and C4 vertebra but more than what was seen in the C3 vertebra. Investigation of the C6
linear measurements and comparisons between the other anthropometric measurements
discovered 15 significant comparisons out of a total of 336 comparisons completed. These
results are shown in Table 14. Exploration into the relationships present in the C6 vertebra
area measurements in comparison to the other anthropometrics, showed that there were two
significant correlations present (shown in Table 15). Finally analysis of the C6 vertebra and
the angular measurements comparisons to the other anthropometrics, found there to be 5
strong relationships from a total of 144 comparisons made (Table 16).
In the analysis of the C7 vertebra there were 34 significant relationships found. Thus finding
that the C7 vertebra has more correlations present than all the other vertebra’s except for C5.
Investigation of the C7 linear measurements and comparing them with the other
anthropometrics discovered 18 comparisons with strong relationships from 336 comparisons
completed. The result of this is displayed in Tables 17 and 18. Exploration into the
relationships present in the C7 vertebra area measurements divulged that there were five
significant correlations present (shown in Table 19). Finally analysis of the C7’s angular
measurements found 11 strong relationships out of 144 comparisons made (Table 20).
Human Musculoskeletal Biomechanics
118
1.4 Discussion
Through investigation into correlations that may be present within the anthropometric data
of each vertebra, there were a total of 130 significant relationships discovered:
11 in the C3 vertebra
23 in the C4 vertebra
40 in the C5 vertebra
22 in the C6 vertebra
34 in the C7 vertebra.
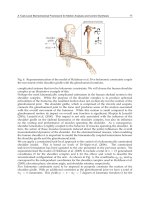
Some of these relationships were physiologically reconcilable, in particular for the C3
vertebral segment the upper endplate transverse inclination and the upper endplate depth
(EPItu & EPDu). From looking at Figure 1 it can be seen how the EPItu would possibly
increase in the same way as the EPDu increases based on a person’s stature.
As for the C4 vertebral segment the correlations that make the most sense are the upper
endplate area vs. the upper endplate width (EPAu vs. EPWu), the upper endplate depth vs.
the upper endplate width (EPDu vs. EPWu), and the lower endplate transverse inclination
vs. the lower endplate depth (EPItl vs. EPDl). In the study completed by Panjabi they found
that modeling the area of the endplates, spinal canal, and pedicles as ellipses was “justified”
(Liu, Clark and Krieger, 1986). So when looking at the case of the EPAu and the EPWu, this
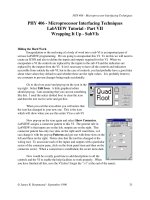
relationship can be explained by the area of an ellipse. Since the area of an ellipse is
Area= ab
where a and b are depicted in Figure 2 as the radius. In the same aspect since a
radius of an ellipse is the diameter divided by 2 (
''
22
ab
aorb
) then the area can also
equate to Area=
''
22
ab
, where a’ and b’ are depicted in Figure 2 as the diameters. In this
case EPWu would be b’ and the area would be EPAu. So as the diameter EPWu increases so
does the area EPAu.
As for the relationship found between the EPDu and the EPWu, the same argument may be
placed that the depth of the end plate could be seen as the diameter as well, as shown here:
''
22
22
ab
Area
EPDu EPWu
EPAu
In the case for the relationship between the EPItl and the EPDl, the same statement as stated
for the C3 vertebra in the case of the EPItu and the EPDu can be stated.
Fig. 2. Diagram of an ellipse to describe the area of an ellipse, where a and b are the radius
and a’ and b’ are the diameters
Cervical Spine Anthropometric and Finite Element Biomechanical Analysis
119
ANOVA Parameter Estimates
Y-intercept Slope
P P (y-intercept)
P (regressor/
independent)
EPDl vs.
EPWl
0.03 0.0158 0.03
8.2642 0.37956
Significant Significant Not Significant
EPDu vs.
PDWl
0.0048 <0.0001 0.0048
13.16703 0.26669
Significant Significant Significant
EPWu vs.
PDWr
0.0155 <0.0001 0.0155
15.80078 -0.0001436
Significant Significant Significant
PDHl vs.
EPDu
0.0425 0.3398 0.0425
1.91753 0.28098
Significant Not Significant Not Significant
PDHr vs.
EPDu
0.0181 <0.0001 0.0181
7.42367 -0.09719
Significant Significant Significant
PDHr vs.
PDItl
0.0166 <0.0001 0.0166
5.88497 0.02407
Significant Significant Significant
SCD vs.
EPDl
0.0198 <0.0001 0.0198
7.52521 0.1789
Significant Significant Significant
SCD vs.
EPAl
0.0127 <0.0001 0.0127
7.53602 0.00885
Significant Significant Significant
SPL vs.
PDItr
0.0405 <0.0001 0.0405
41.94107 -0.2777
Significant Significant Not Significant
TPW vs.
PDItr
0.0321 <0.0001 0.0321
47.35028 0.16667
Significant Significant Not Significant
VBHa vs.
EPDl
0.0179 <0.0001 0.0179
7.27923 0.19901
Significant Significant Significant
VBHa vs.
VBHp
0.0283 0.0025 0.0283
6.0541 0.38446
Significant Significant Not Significant
VBHa vs.
SCW
0.0451 <0.0001 0.0451
7.66983 0.13244
Significant Significant Not Significant
VBHa vs.
EPAu
0.0046 <0.0001 0.0046
12.01819 -0.00769
Significant Significant Significant
VBHp vs.
VBHa
0.0283 <0.0001 0.0283
10.00304 0.12525
Significant Significant Not Significant
Table 14. C6 Linear Measurements
Human Musculoskeletal Biomechanics
120
For the C5 vertebral segment, the associations found that were physiologically reconcilable
were in:
The lower endplate area vs. the lower endplate depth (EPAl vs. EPDl)
The upper endplate area vs. the lower endplate depth (EPAu vs. EPDl)
The pedicle height on the left side vs. the pedicle width on the left side (PDHl vs.
PDWl)
The pedicle sagittal inclination on the left side vs. the pedicle transverse inclination on
the left side (PDIsl vs. PDItl)
The pedicle transverse inclination on the left side vs. the pedicle sagittal inclination on
the left side (PDItl vs. PDIsl)
The pedicle width on the left side vs. the pedicle height on the left side (PDWl vs.
PDHl)
As for the correlations in the EPAl vs. EPDl, EPAu vs. EPDl, PDHl vs. PDWl, and PDWl vs.
PDHl these can be explained in the same aspect as the relationships found in the C4
vertebra; with comparison of the area of an ellipse and the diameter of an ellipse, along with
the diameter to diameter comparison of a ellipse. In the cases of the relationships present in
the sagittal inclination and the transverse inclination, if looking at Figure 1 it can be seen
how as one increases the other may increase.
In the C6 vertebral segment the relationships that were the most physiologically reconcilable
are the lower endplate depth and the lower endplate width (EPDl and EPWl), this type of
relationship was explained previously with the examination into the C4 vertebra and
relationship present in diameter to diameter comparison of an ellipse. As for the
relationship found between the anterior vertebral body height and the posterior vertebral
body height (VBHa and VBHp), again if looking at Figure 1 it can be seen that if the height
increases in either the anterior or posterior location of the vertebral body that there should
be an increase in the former as well.
ANOVA Parameter Estimates
Y-intercept Slope
P P (y-intercept)
P (regressor/
independent)
EPAl vs.
TPW
0.0289 <0.0001 0.0289
407.91242 -1.90819
Significant Significant Not Significant
PDAl vs.
EPDl
0.0168 <0.0001 0.0168
44.79661 -0.9836
Significant Significant Significant
Table 15. C6 Area Measurements
Unlike the other vertebras, the C7 vertebra had no obvious relationships that were
physiologically reconcilable. As for the other relationships found that were not described
they were not physiological reconcilable. But they will help in further research as discussed
earlier since they were found to be statistically significant.
It is of interest to investigate the findings further. In particular any relationships that was
present and also present in the opposite comparison. As an example if a link was found
between upper endplate width vs. the lower endplate width (EPWu vs. EPWl) and also a
link between the lower endplate width vs. the upper endplate width (EPWl vs. EPWu).
Cervical Spine Anthropometric and Finite Element Biomechanical Analysis
121
ANOVA Parameter Estimates
Y-intercept Slope
P P (y-intercept)
P (regressor/
independent)
PDIsr vs.
PDItl
0.0332 <0.0001 0.0332
41.66266 -0.60909
Significant Significant Not Significant
PDItl vs.
PDHr
0.0166 0.1125 0.0166
-9.36715 2.3752
Significant Not Significant Significant
PDItl vs.
PDIsr
0.0332 <0.0001 0.0332
7.77712 -0.07463
Significant Significant Not Significant
PDItr vs.
SPL
0.0405 <0.0001 0.0405
12.26138 -0.1517
Significant Significant Not Significant
PDItr vs.
TPW
0.0321 0.2446 0.0321
-7.19097 0.27594
Significant Not Significant Not Significant
Table 16. C6 Angular Measurements
For the C3 vertebra there was only one case that this was seen in:
The pedicle width on the right side vs. the posterior vertebral body height and the
posterior vertebral body height vs. the pedicle width on the right side (PDWr vs. VBHp
and VBHp vs. PDWr).
In the C4 vertebra there was also one case of this same type of connection which was
seen in:
The spinal canal width and the transverse process width (SCW and TPW).
The C5 vertebra had increasingly more connections of this type and included the
following:
The lower endplate depth and the spinal canal width (EPDl and SCW)
The lower endplate depth and the spinal canal area (EPDl and SCA)
The upper endplate depth and the spinal canal area (EPDu and SCA)
The upper endplate depth and the pedicle transverse inclination (EPDu and PDItl)
The lower endplate width and the pedicle width on the right side (EPWl and PDWr)
The upper endplate width and the anterior vertebral body height (EPWu and VBHa)
The pedicle height on the left side and the pedicle width on the left side (PDHl and
PDWl)
The pedicle height on the left side and the pedicle sagittal inclination on the right side
(PDHl and PDIsr)
The pedicle width on the left side and the pedicle area on the right side (PDWl and
PDAr)
The pedicle width on the right side and the upper endplate transverse inclination
(PDWr and EPItu)
The pedicle width on the right side and the pedicle transverse inclination on the left
side (PDWr and PDItl)
The spinal canal depth and the posterior vertebral body height (SCD and VBHp)
Human Musculoskeletal Biomechanics
122
The spinal canal depth and the upper endplate area (SCD and EPAu)
The spinous process length and the pedicle transverse inclination on the right side (SPL
and PDItr)
The posterior vertebral body height and the pedicle area on the left side (VBHp and
PDAl)
The pedicle area on the right side and the pedicle sagittal inclination on the right side
(PDAr and PDIsr)
The pedicle sagittal inclination on the left side and the pedicle transverse inclination on
the left side (PDIsl and PDItl).
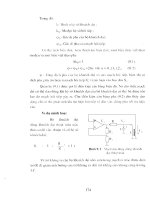
Fig. 3. Scatter plot of C7_EPAl vs. C7_VBHp
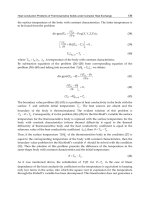
Fig. 4. Residual vs. C7_VBHp
Cervical Spine Anthropometric and Finite Element Biomechanical Analysis
123
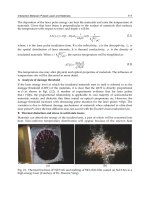
Fig. 5. Normal Cumulative Distribution vs. Cumulative Distribution of Residual
Fig. 6. Residual vs. Normal Quantile
In the C6 vertebra there were five connections of this type which were:
The pedicle height on the right side and the pedicle transverse inclination on the left
side (PDHr and PDItl)
The spinous process length and the pedicle transverse inclination on the right side (SPL
and PDItr)
The transverse process width and the pedicle transverse inclination on the right side
(TPW and PDItr)
The anterior vertebral body height and the posterior vertebral body height (VBHa and
VBHp)
The pedicle sagittal inclination on the right side and the pedicle transverse inclination
on the left side (PDIsr and PDItl).
Finally for the C7 vertebra there were fifteen connections of this type which included:
The lower endplate area and the upper endplate depth (EPAl and EPDu)
The lower endplate area and the posterior vertebral body height (EPAl and VBHp)
The upper endplate area and the lower endplate depth (EPAu and EPDl)
Human Musculoskeletal Biomechanics
124
Fig. 7. Standard Influence on Predicted Value vs. C7_VBHP
Fig. 8. Leverage vs. C7_VBHp
Fig. 9. Standard Influence on Covariance of Beta vs. C7_VBHp
Cervical Spine Anthropometric and Finite Element Biomechanical Analysis
125
The lower endplate depth and the pedicle height on the right side (EPDl and PDHr)
The upper endplate depth and the pedicle sagittal inclination on the left side (EPDu and
PDIsl)
The lower endplate transverse inclination and the spinal canal width (EPItl and SCW)
The upper endplate transverse inclination and the posterior vertebral body height
(EPItu and VBHp)
The upper endplate transverse inclination and the pedicle area on the right side (EPItu
and PDAr)
The upper endplate width and the spinous process length (EPWu and SPL)
The pedicle area on the left side and the pedicle sagittal inclination on the left side
(PDAl and PDIsl)
The pedicle height on the right side and the posterior vertebral body height (PDHr and
VBHp)
The pedicle height on the right side and the spinous process length (PDHr and SPL)
The pedicle sagittal inclination on the left side and the anterior vertebral body height
(PDIsl and VBHa)
The pedicle sagittal inclination on the left side and the spinous process length (PDIsl
and SPL)
The pedicle transverse inclination on the right side and the spinal canal width (PDItr
and SCW)
This type of relationship is important to note because it was thought that if there was a
significance found in one comparison that the same type of relationship would be seen
when doing the reciprocal comparison, but this was not always seen. When this type of
relationship isn’t seen it could be the result of the random number generation and the
normal distribution of these numbers.
ANOVA Parameter Estimates
Y-intercept
Slope
P P (y-intercept)
P (regressor/
independent)
EPDl vs.
PDHr
0.0145 <0.0001 0.0145 19.19577 -0.59208
Significant Significant Significant
EPDl vs.
EPAu
0.0227 <0.0001 0.0227 13.92929 0.00755
Significant Significant Significant
EPDu vs.
EPAl
0.0499 <0.0001 0.0499 16.35341 -0.00366
Significant Significant Not Significant
EPDu vs.
PDIsl
0.0149 <0.0001 0.0149 16.47022 0.04455
Significant Significant Significant
EPWu vs.
SPL
0.0062 <0.0001 0.0062 20.24696 -0.02664
Significant Significant Significant
PDHr vs.
EPDl
0.0145 <0.0001 0.0145 7.65744 -0.10034
Significant Significant Significant
Table 17. C7 Linear Measurements (Part 1)
Human Musculoskeletal Biomechanics
126
ANOVA Parameter Estimates
Y-intercept
Slope
P P (y-intercept)
P (regressor/
independent)
PDHr vs.
VBHp
0.0153 <0.0001 0.0153 7.09761 -0.08508
Significant Significant Significant
PDHr vs.
SPL
0.0454 <0.0001 0.0454 5.07412 0.01077
Significant Significant Not Significant
PDWr vs.
PDIsr
0.0478 0.0002 0.0478 11.73842 -0.20069
Significant Significant Not Significant
SCW vs.
EPItl
0.0143 <0.0001 0.0143 20.8603 -0.23411
Significant Significant Significant
SCW vs.
PDItr
0.0218 <0.0001 0.0218
20.1399 -0.14708
Significant Significant Significant
SPL vs.
EPWu
0.0062 <0.0001 0.0062
99.42223 -2.77358
Significant Significant Significant
SPL vs.
PDHr
0.0454 <0.0001 0.0454
35.48384 1.84364
Significant Significant Not Significant
SPL vs.
PDIsl
0.0208 <0.0001 0.0208
39.68142 -0.23022
Significant Significant Significant
VBHa vs.
PDIsl
0.0274 <0.0001 0.0274
12.7251 0.04937
Significant Significant Not Significant
VBHp vs.
PDHr
0.0153 <0.0001 0.0153
15.99891 -0.68864
Significant Significant Significant
VBHp vs.
EPAl
0.0152 <0.0001 0.0152
14.38187 -0.00759
Significant Significant Significant
VBHp vs.
EPItu
0.0064 <0.0001 0.0064
11.04194 0.10321
Significant Significant Significant
Table 18. C7 Linear Measurements (Part 2)
It is also of interest to see which correlations also existed in other vertebras, and if any
existed throughout C3 to C7. There were eight correlations that were seen in more than
just one vertebral segment. The link between the upper endplate width and the pedicle
width on the right side (EPWu and PDWr) was seen in both the C4 vertebra and the C6
vertebra. As for the connection between the posterior vertebral body height and the
pedicle area on the left side (VBHp and PDAl), this was seen in both the C4 vertebra and
the C5 vertebra. The relationship between the spinous process length and the pedicle
transverse inclination on the right side (SPL and PDItr) was seen in the C5 and C6
Cervical Spine Anthropometric and Finite Element Biomechanical Analysis
127
vertebra. The connection between the pedicle height on the right side and the lower
endplate depth (PDHr and EPDl) was seen in both the C4 and C7 vertebra. The
relationship between the upper endplate area and the lower endplate depth (EPAu and
EPDl) was seen in both the C7 and C5 vertebra. The link between the lower endplate
transverse inclination and the spinal canal width (EPItl and SCW) was seen in both C7
and C4. Also the connection between the upper endplate transverse inclination and the
pedicle width on the right side (EPItu and PDWr) was seen in both the C5 and C7
vertebra. Finally the correlation between the pedicle transverse inclination on the right
side and the spinous process length (PDItr and SPL) was seen in both the C5 and C6
vertebral segments. It would be of interest to investigate why this may be, and why there
isn’t a relationship present that was found in all 5 segments.
An example of some plots that resulted from the linear regression analysis of the vertebral
segments through SAS
®
are shown in Figures 3-9. These figures are included to illustrate an
example involving the lower endplate area and the posterior vertebral body height for the
C7 vertebra (EPAl and VBHp).
In the study completed by Tan it was found that the endplate width and depth (EPW, EPD),
and vertebral body height (VBH) are moderately constant from C3 to C5 and then increase
to C7. The increase is more drastic in the endplate width than the end plate depth and
vertebral body height, with the endplate depth and the vertebral body height having both a
similar increasing trend. The posterior vertebral body height (VBHp), lower endplate width
(EPWl), and the lower endplate depth (EPDl) are larger than their complementary
measurements of anterior vertebral body height (VBHa), upper endplate width (EPWu) and
the upper endplate depth (EPDu). As for the spinal canal, the width and depth (SCW and
SCD) both are fairly constant from C3 to C6. The spinal canal width decreases sharply
through to C7, and the spinal canal depth increases progressively into C7. Both the process
lengths of the spinous and transverse (SPL and TPW) increase with a similar trend. The
values of the left and right pedicle height (PDHl and PDHr) are comparatively similar, the
same goes for the left and right pedicle width (PDWl and PDWr). The pedicle height (PDH)
decreases gradually from C3 to C6 and then increases to C7. The pedicle width (PDW)
increases throughout the cervical spine. The area of the lower and upper endplates (EPAl
and EPAu) increases throughout the cervical spine, and the upper is at all times larger than
the lower endplate area. The spinal canal area (SCA) increases from C3 to C5 and then
decreases at C6 just to increase again to C7. Both the left and right pedicle area (PDAl and
PDAr) are fairly constant from C3 to C5, but then the left increases to C7 while the right
decreases to C7. The endplate inclinations for both the upper and lower regions (EPItu and
EPitl) are angled toward the head with a steady inclination. The lower endplate transverse
inclination is always smaller than the upper endplate transverse inclination. The pedicle
sagittal inclination (PDIs) is fairly constant at about 40° from C3 to C6, but then at C6 the
pedicles start to congregate towards each other. The pedicle transverse inclination (PDIt) is
angled towards the back from C3 to C4 but then angle towards the head after C4 (Nissan
and Gilad, 1984).
In comparing the endplate width and depth, the posterior vertebral body height, and the
upper endplate area (EPW, EPD, VBHp, and EPAu) to Panjabi’s study of the cervical spine
of Caucasian subjects, Tan’s measurements are smaller “by an average of 10.3%, 15.2%,
4.0%, and 8.3% respectively” than that of Panjabi’s measurements. The lower endplate area
(EPAl) are larger in Tan’s study by 16.3% than Panjabi’s. The trends of the vertebral body
Human Musculoskeletal Biomechanics
128
measurements are similar in both Panjabi’s and Tan’s study. The mean difference for the
spinal canal width (SCW) is about “-19.8% and -31.8% for the SCD.” The trend of the spinal
canal width, depth, and area (SCW, SCD, and SCA) were different in the two studies. The
pedicle height and width (PDH and PDW) had a mean difference of -16.1% and -25.7%
respectively when using the average of the left and right measurements. Spinal implants
have been developed based on measurements from Caucasian specimens, and as can be
seen the difference in the pedicle width shows that the design of these implants would not
be a good fit for the population studied by Tan. For example a 5-mm transpedicle screw
would not be able to fit because the pedicle width is not wide enough for it in the Chinese
Singaporeans. The spinous process length (SPL) is smaller in Tan’s study by about 5.5% and
the transverse process width (TPW) is smaller by about 15.6% than Panjabi’s study. But the
spinous process length is slightly larger from C5 to C7 than Panjabi’s study (Nissan and
Gilad, 1984; Tan, Teo and Chua, 2004).
In the study completed by Panjabi it was found that their results generally agreed with
previous studies completed by Liu, Nissan, and Francis. The front to back endplate
dimensions were generally within 2 mm of measurements completed by Nissan and Francis,
and also followed the same tendency from C2 to C7. The measurements from Liu were
smaller than Panjabi’s which could be a result of how measurements were found. The
endplate area (EPA) also differed from Liu which is believed to be because Panjabi’s area
did not include the uncovertebral facet area while Liu’s more than likely did. Panjabi’s
study saw that there was a widening in the spinal canal from C5 to C6 and then decrease at
C7, while Francis’ stated that the canal was relatively small throughout. The vertebral body
height (VBH) were smaller by 2 to 2.5 mm than Nissan and Francis’ study which is believed
to be again because of the different measurement techniques (Francis, 1955; Liu, Clark and
Krieger, 1986; Panjabi et al., 1991; Nissan and Gilad, 1984) .
ANOVA Parameter Estimates
Y-intercept Slope
P P (y-intercept)
P (regressor/
independent)
EPAl vs.
EPDu
0.0499 <0.0001 0.0499
499.16617 -10.55392
Significant Significant Not Significant
EPAl vs.
VBHp
0.0152 <0.0001 0.0152
430.9265 -7.72835
Significant Significant Significant
EPAu vs.
EPDl
0.0227 0.0166 0.0227
112.68776 6.86404
Significant Significant Significant
PDAl vs.
PDIsl
0.0197 <0.0001 0.0197
53.33933 0.63139
Significant Significant Significant
PDAr vs.
EPItu
0.0162 <0.0001 0.0162
28.57023 0.46784
Significant Significant Significant
Table 19. C7 Area Measurements
Cervical Spine Anthropometric and Finite Element Biomechanical Analysis
129
ANOVA Parameter Estimates
Y-intercept Slope
P P (y-intercept)
P (regressor/
independent)
EPItl vs.
SCW
0.0143 <0.0001 0.0143
10.06297 -0.25521
Significant Significant Significant
EPItl vs.
EPAu
0.026 <0.0001 0.026
7.8214 -0.01266
Significant Significant Not Significant
EPItu vs.
VBHp
0.0064 0.7368 0.0064
-1.01525 0.71055
Significant Not Significant Significant
EPItu vs.
PDWr
0.0423 <0.0001 0.0423
6.34333 0.18166
Significant Significant Not Significant
EPItu vs.
PDAr
0.0162 0.0357 0.0162
3.43319 0.12299
Significant Not Significant Significant
PDIsl vs.
EPDu
0.0149 <0.0001 0.0149
-50.57442 1.32445
Significant Significant Significant
PDIsl vs.
VBHa
0.0274 <0.0001 0.0274
-41.61664 0.98543
Significant Significant Not Significant
PDIsl vs.
SPL
0.0208 <0.0001 0.0208
-19.73933 -0.2317
Significant Significant Significant
PDIsl vs.
PDAl
0.0197 <0.0001 0.0197
-33.49084 0.08599
Significant Significant Significant
PDItr vs.
SCW
0.0218 0.0011 0.0218
10.15645 -0.35731
Significant Significant Significant
PDItr vs.
EPAu
0.042 0.7155 0.042
-0.67451 0.01729
Significant Not Significant Not Significant
Table 20. C7 Angular Measurements
1.5 Conclusion
The analysis of the cervical spines vertebral segments anthropometrics resulted in 600 total
comparisons being completed in each vertebral body from C3-C7, resulting in 3000
comparisons in total being done. From this it was found that there were 11 relationships in
the C3 vertebra, 23 in the C4 vertebra, 40 in the C5 vertebra, 22 in the C6 vertebra, and 34 in
the C7 vertebra which is a total of 130 relationships found from C3 to C7. From this analysis
it was found that only about
1
4%
3
of the 3000 comparisons were significant. There were
only 8 comparisons that were significant in more than one vertebral segment.
Human Musculoskeletal Biomechanics
130
The relationships found between the dimensional anatomy of the vertebrae of the cervical
spine will assist in accurate modeling of the spine as well as for device development helping
to eliminate possible failure of devices due to improper fit within the region of the spine.
This anthropometric data can also enable a better understanding of disease occurrence in
certain alignments of the spine, and susceptibility of specific race, gender, or age groups.
The results of this research will also allow for a better understanding of the functionality of
the cervical spine and its susceptibility to failure.
2.1 Cervical spine finite element modeling methods review
The cervical spine is one of the most important physiologic systems in the human body. The
cervical spine offers primary stability to the head neck system along with protecting the
spinal cord. The cervical spine features higher levels of motion and flexibility as compared
to the other spine regions. The spines flexibility and motion does leave it susceptible to a
higher rate of injury as compared to the other spine regions (Ng and Teo, 2001). It is
therefore important to study the spine to gain a better understanding of the behavior spine.
In-vivo studies of the cervical spine can provide information on the behavior of the spine
under specific conditions. However, an in-vivo analysis of the spine cannot provide specific
load response information at the vertebral and intervertebral disc level. In contrast, in-vitro
analysis of the cervical spine can provide load displacement response at vertebral segments.
In-vitro analyses of the cervical spine are limited to load displacement results; they cannot
provide internal response characteristics such as stress and strain (Yoganandan et al., 1996;
Panagiotopoulou, 2009). As such, there has been growing interest and application of finite
element (FE) methods in the study of the cervical spine. Finite element models of the
cervical spine have been used to study spine biomechanics, injuries, and response to
medical interventions (Yoganandan, Kumaresan and Pintar, 2001; Pitzen et al., 2002; Pitzen,
Matthis and Steudel, 2002)
Development of a finite element model of the spine involves several key areas of
consideration. A finite element model of the spine must aim to accurately represent the
anatomical features of the spine. Spinal vertebrae, intervertebral discs, ligaments, and their
interrelation must all be carefully considered in the development of a model (Kallemeyn,
Tadepalli and Shivanna, 2009; Bogduck and Yoganandan, 2001). The methods applied in
constructing the finite element model play an important role in its ability to accurately
represent the cervical spine. The finite element methods applied in analyzing a cervical
spine model play are also of extreme import (Yoganandan, Kumaresan and Pintar, 2001;
Yoganandan et al., 1996). In order to gain a better understanding of cervical spine finite
element modeling and analysis, a review of the pertinent literature was performed.
2.2 Cervical Spine Analysis
Mathematical modeling approaches allow for both static and dynamic analysis of the
cervical spine. Dynamic analyses of the spine often aim to characterize the response of the
cervical region during an impact with the goal of better understanding vehicular injury
scenarios such as whiplash. Dynamic models of the cervical spine often include the entire
cervical spine, and the head. Vertebral bodies have been modeled as rigid bodies, with soft
tissues such as spinal ligaments represented by linear springs (Esat, 2005; Brolin and
Halldin, 2005; Brolin and Halldin, 2004; Stemper et al., 2006). This modeling approach
somewhat limits the load response data that can be derived for specific vertebral bodies and
intervertebral discs.