Human Musculoskeletal Biomechanics Part 10 pot
Bạn đang xem bản rút gọn của tài liệu. Xem và tải ngay bản đầy đủ của tài liệu tại đây (673.46 KB, 20 trang )
TMJ Biomechanics
171
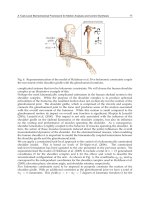
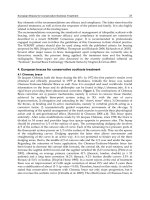
Fig. 7. Maximum von Mises stress developed over the mandibular 3D model during three
FE simulations – for three values of Young’s modulus (E) – under four loading conditions.
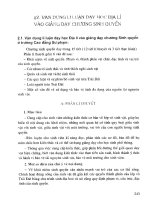
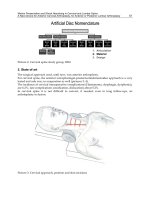
Fig. 8. Material properties were assigned to the 3D finite element volume mesh of the
mandible using individual masks for each component. The cortical bone portion is indicated
by yellow color, condylar cartilage by orange color, and teeth by red. As cancellous bone is
covered by cortical bone, it is not visible in this figure.
Human Musculoskeletal Biomechanics
172
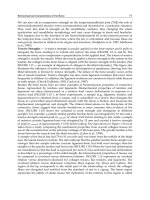
Fig. 9. Three-dimensional finite element volume mesh of the mandible. The volume mesh
had 37439 nodes and 23156 ten-node quadratic tetrahedral elements (C3D10).
Part Young’s Modulus (MPa)
a, b
Poisson’s Ratio
a, b
Cortical bone 1.47E+04 0.3
Cancellous bone 4.90E+02 0.3
Teeth 1.76E+04 0.25
Cartilage 6.1 0.49
Sources:
a
Ichim et al., 2006;
b
Reina et al., 2007
Table 2. Material properties assigned to different components of the mandibular FE model.
The mechanical behavior of the mandibular model was assumed to be linear-elastic,
homogeneous, and isotropic. The model constraints were applied to imitate the in-vivo
movements of the mandible as accurately as possible during each loading condition. Since
the mastication forces are the result of the pressure in the teeth-food contact (Reina et al.,
2007), the displacements were simply restrained at the nodes of the surface of the lower
teeth that come in contact with the food or the upper teeth. During the balanced occlusive
loading, both condyles were permitted translation of 10 mm in anterior-posterior direction
and rotation of 11
o
along the medio-lateral axis. Same constraints were employed to
simulate the unbalanced occlusive loading and bi-lateral molar clenching. During teeth
grinding, the forces were applied on first and second molars and second premolar on right
side only; and the right condyle was assumed free to move while the articular surface of the
left condyle was constrained as during balanced loading.
The magnitudes of mandibular and TMJ loading reported in the literature differ
significantly and there is currently no universally agreed upon value of TMJ loading
(Ingawalé and Goswami, 2009). Conflicting views about type, magnitude, and orientation of
masticatory forces used for FEMs were expressed by TMJ researchers at the TMJ
TMJ Biomechanics
173
Bioengineering Conference, 2009 held at Boulder (CO, USA). Therefore, for this study, we
selected the magnitudes of bite forces based on the literature and our discussions with
dentists, and oral and maxillofacial surgeons (see Table 3). For balanced load simulation,
200N force was applied in vertically upward direction on the second molar on both sides of
the mandible. During parafunctional activities, loading conditions are different from those
under normal loading (Singh and Detamore, 2009). To simulate unbalanced loading, same
location and orientation of force were used with 250N on the left second molar and 200N on
the right second molar of the mandible. During teeth grinding, the bite forces – 350N
vertically upward and 250N in medial direction – were applied on first and second molars
and second premolar on only the right side of the mandible. Mandibular loading during
clenching was simulated by applying 400N vertically upward bite force on all molars and
premolars on both sides of the mandible.
Since material properties were assigned to the mandibular 3D mesh from independent
masks for cortical bone, cancellous bone, teeth, and condylar cartilage; it was possible to
investigate stress development in each of these components as well as the entire mandible.
As the objective of this study is to study stress development in the articulating surfaces
(condylar cartilage), we discuss the von Mises stresses in condylar cartilage hereon. Each
loading condition was simulated thrice with the same model constraints, and location and
magnitude of forces. These simulations are named Run1, Run2 and Run3. Applied bite
forces and resultant maximum von Mises stresses in the condylar cartilage for all loading
conditions are summarized in Table 3 (also see Figures 10 and 11).
Loading
condition
Applied load (N)
a, b, c
Max. von Mises Stress
in condylar cartilage
(*E+04 Pa)
Location of
max. von Mises
stress on
condylar
cartilage
Left side Right side Run1 Run2 Run3
Balanced 200 200 5.9 5.8 5.88 Right condyle
Unbalanced 250 150 5.97 5.97 5.9 Left condyle
Teeth grinding
350(vertically
upward), 250 (medial)
7.23 7.2 7.21 Right condyle
Clenching 400 400 10.3 10.1 10.3 Right condyle
Table 3. Applied bite forces and resultant maximum von Mises stress in condylar cartilage
Source:
a
Abe et al., 2006;
b
Cosme et al., 2005;
c
Authors’ discussions with Oral and
Maxillofacial Surgeons.
Human Musculoskeletal Biomechanics
174
(a)
(b)
(c)
TMJ Biomechanics
175
(d)
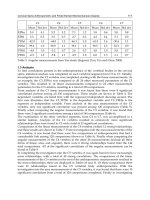
Fig. 10. von Mises stress [in (kg.mm/s
2
); (1 kg.mm/s
2
= 1 kPa)] developed during balanced
bilateral molar bite simulation in the entire mandible (a); and its components – cortical bone
(b), teeth (c), and condylar articulating cartilage (d). (Note: The displayed sizes of
components in panels c and d are not in proportion to each other and that of the
components in other panels).
Fig. 11. A plot of maximum von Mises stress developed in the condylar articulating cartilage
during four different occlusal static loading conditions – balanced molar bite, unbalanced
molar bite, teeth grinding, and clenching – simulated thrice each. The FE simulations
resulted in the highest mechanical stresses in the condylar cartilage during teeth clenching.
Teeth grinding resulted in the mechanical stresses relatively less than during clenching, and
higher than during unbalanced and balanced molar bites. The balanced loading produced
the least stresses among all simulations.
The resultant stress data were analyzed using statistical analysis software JMP
®
(version 9).
We employed the Tukey-Kramer HSD method to investigate the correlation between means
of the peak von Mises stresses from three simulations/runs each of the four loading
conditions under bite forces. From Tukey-Kramer HSD method, by comparing means of
peak von Mises stresses for three runs/simulations of each loading condition, teeth grinding
Human Musculoskeletal Biomechanics
176
and clenching were found to result in significantly different (p-value <0.0001 at α = 0.05)
and higher von Mises stresses than balanced loading (see Figure 8). The von Mises stresses
due to balanced and unbalanced loading were not significantly different from each other (at
α = 0.05, p-value = 0.4386).
Fig. 12. The Tukey-Kramer HSD statistical analysis by comparing means of maximum von
Mises stresses for three runs of each loading condition revealed that teeth grinding and
clenching resulted in statistically significantly different von Mises stresses than balanced
loading. The von Mises stresses due to balanced and unbalanced loading were not
significantly different from each other.
The resultant maximum von Mises stresses in the condylar cartilage during balanced
loading and clenching lie in the range of those reported in the literature (Hu et al., 2003;
Nagahara et al., 1999). However, since most of the studies have reported stress development
in bones and disc of the TMJ, we could not find any reported values of stress in the condylar
cartilage under unbalanced loading and teeth grinding conditions to compare our results
with. Comparatively higher mechanical stresses during clenching and teeth grinding
activities suggest that these activities may lead to and exacerbate the TMDs. This indication
TMJ Biomechanics
177
of our study conforms to the attribution that teeth grinding and clenching (as a result of
physical and/or psychological stress) may be the causative factors for TMDs.
Since we have applied the model constraints, material properties, and load values based on
the literature, we consider the FEA results to be reliable and encouraging to advance our
research efforts. We recognize that our FEA method has some limitations because we used
simplified forces. We are developing subject-specific 3D models of the entire TMJ –
including hard and soft tissues, and more refined FE mesh to perform biomechanical
investigation under more realistic forces and model constraints. The proposed work
promises to lead us to better understanding of the structural and functional aspects of
natural and reconstructed TMJ. We also plan to validate the theoretical predictions of FEA
through cadaver testing.
6. Summary
The TMJ literature underlines the importance of biomechanical analysis of the natural joint
to better understand the structural and functional aspects; and of the reconstructed joint to
assess the implant function and performance. Most of the methods reported in the literature
have certain limitations due to the complex nature of the joint and also due to certain
limitations of the techniques and software packages used for modeling and analysis. A more
comprehensive biomechanical analysis of the natural and artificial TMJ is essential. The
methodology used in this study for anatomical 3D reconstruction enables subject-specific
modeling of complex structures and their constituent components. This feature can play a
vital role in patient-specific anatomical modeling for diagnostic as well as therapeutic needs.
Furthermore, such subject-specific anatomical models can be used to design custom
prosthetic devices – which offer better fit, fixation, and efficiency – for a given anatomical
structure. The FEA of such anatomical and prosthetic 3D models can be efficiently employed
to better understand biomechanical behavior of the complex structures under investigation;
and to improve the design, treatment efficiency, and durability of prosthetic devices. More
comprehensive static and dynamic analyses of the mandible and TMJ coupled with
experimental validation are necessary.
7. Acknowledgement
The authors would like to thank Dr. Deepak Krishnan (Assistant Professor, Oral and
Maxillofacial Surgery, University of Cincinnati, Cincinnati, OH, USA) for sharing with us
his clinical expertise and guiding our TMJ research.
8. References
Abe, M., Medina-Martinez, R. U., Itoh, K., Kohno, S., 2006. Temporomandibular joint
loading generated during bilateral static bites at molars and premolars. Medical
and Biological Engineering and Computing 44, 1017-1030.
Alomar, X., Medrano, J., Cabratosa, J., Clavero, J., Lorente, M., Serra, I., Monill, J., Salvador,
A., 2007. Anatomy of the temporomandibular joint. Seminars in Ultrasound, CT,
and MRI 28, 170-183.
Human Musculoskeletal Biomechanics
178
American Association of Oral and Maxillofacial Surgeons (AAOMS), 2007. The
temporomandibular joint (TMJ). Retrieved on 10/14/2007, from
1.
Bakke, M., Zak, M., Jensen, B. L., Pedersen, F. K., Kreiborg, S., 2001. Orofacial pain, jaw
function, and temporomandibular disorders in women with a history of juvenile
chronic arthritis or persistent juvenile chronic arthritis Oral Surgery, Oral Medicine,
Oral Pathology, Oral Radiology, and Endodontics 92, 406-414.
Beek, M., Aarnts, M. P., Koolstra, J. H., Feilzer, A. J., Van Eijden, T. M. G. J., 2001. Dynamic
Properties of the Human Temporomandibular Joint Disc. Journal of Dental
Research 80, 876-880.
Beek, M., Koolstra, J. H., van Eijden, T. M. G. J., 2003. Human temporomandibular joint disc
cartilage as a poroelastic material Clinical Biomechanics 18, 69-76.
Beek, M., Koolstra, J. H., van Ruijven, L. J., van Eijden, T. M. G. J., 2001. Three-dimensional
finite element analysis of the cartilaginous structures in the human
temporomandibular joint. Journal of Dental Research 80, 1913-1918.
Breul, R., Mall, G., Landgraf, J., Scheck, R., 1999. Biomechanical analysis of stress
distribution in the human temporomandibular-joint Annals of Anatomy 181, 55-60.
Chen, J., Akyuz, U., Xu, L., Pidaparti, R. M. V., 1998. Stress analysis of the human
temporomandibular joint. Medical Engineering and Physics 20, 565-572.
Cosme, D. C., Baldisserotto, S. M., Canabarro Sde, A., Shinkai, R. S., 2005. Bruxism and
voluntary maximal bite force in young dentate adults The International Journal of
Prosthodontics 18, 328-332.
Detamore, M. S., Athanasiou, K. A., 2003. Structure and function of the temporomandibular
joint disc: implications for tissue engineering Journal of Oral and Maxillofacial
Surgery 61, 494-506.
Detamore, M. S., Athanasiou, K. A., Mao, J., 2007. A call to action for bioengineers and
dental professionals: directives for the future of TMJ bioengineering Annals of
Biomedical Engineering 35, 1301-1311.
Dutton, M., 2004. Orthopaedic Examination, Evaluation, & Intervention: A Pocket
Handbook. McGraw-Hill, New York, pp548.
Gallo, L. M., Chiaravalloti, G., Iwasaki, L. R., Nickel, J. C., Palla, S., 2006. Mechanical work
during stress-field translation in the human TMJ. Journal of Dental Research 85,
1006-1010.
Gallo, L. M., Nickel, J. C., Iwasaki, L. R., Palla, S., 2000. Stress-field translation in the healthy
human temporomandibular joint. Journal of Dental Research 79, 1740-1746.
Glaros, A. G., Owais, Z., Lausten, L., 2007. Reduction in parafunctional activity: a potential
mechanism for the effectiveness of splint therapy. Journal of Oral Rehabilitation 34,
97-104.
Gross, M. D., Arbel, G., Hershkovitz, I., 2001. Three-dimensional finite element analysis of
the facial skeleton on simulated occlusal loading. Journal of Oral Rehabilitation 28,
684-694.
Hansdottir, R., Bakke, M., 2004. Joint tenderness, jaw opening, chewing velocity, and bite
force in patients with temporomandibular joint pain and matched healthy control
subjects. Journal of Orofacial Pain 18, 108-113.
TMJ Biomechanics
179
Hart, R. T., Hennebel, V. V., Thongpreda, N., Van Buskirk, W. C., Anderson, R. C., 1992.
Modeling the biomechanics of the mandible: a three-dimensional finite element
study. Journal of Biomechanics 25, 261-286.
Hibi, H., Ueda, M., 2005. Body posture during sleep and disc displacement in the
temporomandibular joint: a pilot study. Journal of Oral Rehabilitation 32, 85-89.
Hu, K., Qiguo, R., Fang, J., Mao, J. J., 2003. Effects of condylar fibrocartilage on the
biomechanical loading of the human temporomandibular joint in a three-
dimensional, nonlinear finite element model. 25, 107-113.
Huddleston Slater, J. J. R., Visscher, C. M., Lobbezoo, F., Naeije, M., 1999. The Intra-articular
Distance within the TMJ during Free and Loaded Closing Movements. Journal of
Dental Research 78, 1815-1820.
Hylander, W. L., 1979. An experimental analysis of temporomandibular joint reaction force
in macaques. American Journal of Physical Anthropology 51, 433-456.
Ichim, I., Swain, M., Kieser, J. A., 2006. Mandibular biomechanics and development of the
human chin. Journal of Dental Research 85, 638-642.
Ide, Y., Nakazawa, K., Garcia, L. T., 1991. Anatomical atlas of the temporomandibular joint.
Quintessence Publ. Co., Chicago, pp. 116.
Ingawalé, S., Goswami, T., 2009. Temporomandibular joint: disorders, treatments, and
biomechanics. Annals of Biomedical Engineering 37, 976-996.
Iwasaki, L. R., Crosby, M., Gonzalez, Y., McCall, W. D., Marx, D. B., Ohrbach, R., Nickel, J.
C., 2009. Temporomandibular joint loads in subjects with and without disc
displacement. Orthopedic Reviews 1, 90-93.
Kalamir, A., Pollard, H., Vitiello, A., Bonello, R., 2007. TMD and the problem of bruxism. A
review. Journal of Bodywork and Movement Therapies 11, 183-193.
Kasch, H., Hjorth, T., Svensson, P., Nyhuus, L., Jensen, T. S., 2002. Temporomandibular
disorders after whiplash injury: a controlled, prospective study Journal of Orofacial
Pain 16, 118-128.
Komistek, R. D., Dennis, D. A., Mabe, J. A., Anderson, D. T., 1998. In vivo kinematics and
kinetics of the normal and implanted TMJ. Journal of Biomechanics 31, 13.
Koolstra, J. H., van Eijden, T. M., 2006. Prediction of volumetric strain in the human
temporomandibular joint cartilage during jaw movement. Journal of Anatomy 209,
369-380.
Koolstra, J. H., van Eijden, T. M., 2005. Combined finite-element and rigid-body analysis of
human jaw joint dynamics Journal of Biomechanics 38, 2431-2439.
Korioth, T. W., Hannam, A. G., 1994. Mandibular forces during simulated tooth clenching
Journal of Orofacial Pain 8, 178-189.
Korioth, T. W. P., Versluis, A., 1997. Modeling the mechanical behavior of the jaws and their
related structures by finite element (FE) analysis. Critical Reviews in Oral Biology
& Medicine 8, 90-104.
Langenbach, G. E. J., Zhang, F., Herring, S. W., Hannam, A. G., 2002. Modelling the
masticatory biomechanics of a pig. Journal of Anatomy 201, 383-393.
Laskin, D. M., Greene, C. B., Hylander, W. L., 2006. Temporomandibular disorders an
evidence-based approach to diagnosis and treatment. Quintessence Pub., Chicago,
pp. 548.
Human Musculoskeletal Biomechanics
180
May, B., Saha, S., Saltzan, M., 2001. A three-dimensional mathematical model of
temporomandibular joint loading. Clinical Biomechanics 16, 489-495.
Mercuri, L. G., Ali, F. A., Woolson, R., 2008. Outcomes of total alloplastic replacement with
periarticular autogenous fat grafting for management of reankylosis of the
temporomandibular joint Journal of Oral and Maxillofacial Surgery 66, 1794-1803.
Naeije, M., Hofman, N., 2003. Biomechanics of the Human Temporomandibular Joint during
Chewing. Journal of Dental Research 82, 528-531.
Nagahara, K., Murata, S., Nakamura, S., Tsuchiya, S., 1999. Displacement and stress
distribution in the temporomandibular joint during clenching. The Angle
Orthodontist 69, 372-379.
Nickel, J., Yao, P., Spalding, P. M., Iwasaki, L. R., 2002. Validated numerical modeling of the
effects of combined orthodontic and orthognathic surgical treatment on TMJ loads
and muscle forces. American Journal of Orthodontics and Dentofacial Orthopedics
121, 73-83.
Pellizoni, S. E., Salioni, M. A., Juliano, Y., Guimaraes, A. S., Alonso, L. G., 2006.
Temporomandibular joint disc position and configuration in children with
functional unilateral posterior crossbite: a magnetic resonance imaging evaluation
American Journal of Orthodontics and Dentofacial Orthopedics 129, 785-793
Perez del Palomar, A., Doblare, M., 2008. Dynamic 3D FE modelling of the human
temporomandibular joint during whiplash. 30, 700-709.
Perez del Palomar, A., Doblare, M., 2007. Influence of unilateral disc displacement on the
stress response of the temporomandibular joint discs during opening and
mastication. Journal of Anatomy 211, 453-463.
Perez del Palomar, A., Doblare, M., 2006a. The effect of collagen reinforcement in the
behaviour of the temporomandibular joint disc. Journal of Biomechanics 39, 1075-
1085.
Perez del Palomar, A., Doblare, M., 2006b. Finite element analysis of the
temporomandibular joint during lateral excursions of the mandible. Journal of
Biomechanics 39, 2153-2163.
Pileicikiene, G., Varpiotas, E., Surna, R., Surna, A., 2007. A three-dimensional model of the
human masticatory system, including the mandible, the dentition and the
temporomandibular joints. Stomatologija, Baltic Dental and Maxillofacial Journal 9,
27-32.
Pizolato, R. A., Gavião, M. B. D., Berretin-Felix, G., Sampaio, A. C. M., Trindade, A. S. J.,
2007. Maximal bite force in young adults with temporomandibular disorders and
bruxism. Brazilian Oral Research 21, 278-283.
Quinn, P. D., 2000. Lorenz Prosthesis. Oral and Maxillofacial Surgery Clinics of North
America 12, 93-104.
Quinn, P. D., 199. Alloplastic Reconstruction of the temporomandibular joint. Selected
Readings in Oral and Maxillofacial Surgery 7, 1-23.
Reina, J. M., Garcia-Aznar, J. M., Dominguez, J., Doblare, M., 2007. Numerical estimation of
bone density and elastic constants distribution in a human mandible. Journal of
Biomechanics 40, 828-836.
TMJ Biomechanics
181
Scrivani, S. J., Keith, D. A., Kaban, L. B., 2008. Temporomandibular disorders The New
England Journal of Medicine 359, 2693-2705.
Sellers, W., Crompton, R., 2004. Using sensitivity analysis to validate the predictions of a
biomechanical model of bite forces. Annals of Anatomy 186, 89-95.
Singh, M., Detamore, M. S., 2009. Biomechanical properties of the mandibular condylar
cartilage and their relevance to the TMJ disc. Journal of Biomechanics 42, 405-417.
Tanaka, E., Dalla-Bona, D. A., Iwabe, T., Kawai, N., Yamano, E., van Eijden, T., Tanaka, M.,
Miyauchi, M., Takata, T., Tanne, K., 2006. The Effect of Removal of the Disc on the
Friction in the Temporomandibular Joint. Journal of Oral and Maxillofacial Surgery
64, 1221-1224.
Tanaka, E., Rodrigo, D. P., Miyawaki, Y., Lee, K., Yamaguchi, K., Tanne, K., 2000. Stress
distribution in the temporomandibular joint affected by anterior disc displacement:
a three-dimensional analytic approach with the finite-element method. Journal of
Oral Rehabilitation 27, 754-759.
Tanaka, E., del Pozo, R., Tanaka, M., Asai, D., Hirose, M., Iwabe, T., Tanne, K., 2004. Three-
dimensional finite element analysis of human temporomandibular joint with and
without disc displacement during jaw opening. Medical Engineering & Physics 26,
503-511.
Tanaka, E., Detamore, M. S., Mercuri, L. G., 2008a. Degenerative disorders of the
temporomandibular joint: etiology, diagnosis, and treatment. Journal of Dental
Research 87, 296-307.
Tanaka, E., Detamore, M. S., Tanimoto, K., Kawai, N., 2008b. Lubrication of the
temporomandibular joint Annals of Biomedical Engineering 36, 14-29.
Tanaka, E., Hirose, M., Koolstra, J. H., van Eijden, T. M., Iwabuchi, Y., Fujita, R., Tanaka, M.,
Tanne, K., 2008c. Modeling of the effect of friction in the temporomandibular joint
on displacement of its disc during prolonged clenching Journal of Oral and
Maxillofacial Surgery 66, 462-468.
Tanaka, E., Kikuchi, K., Sasaki, A., Tanne, K., 2000a. An adult case of TMJ osteoarthrosis
treated with splint therapy and the subsequent orthodontic occlusal reconstruction:
adaptive change of the condyle during the treatment American Journal of
Orthodontics and Dentofacial Orthopedics 118, 566-571.
Tanaka, E., Rodrigo, D. P., Tanaka, M., Kawaguchi, A., Shibazaki, T., Tanne, K., 2001. Stress
analysis in the TMJ during jaw opening by use of a three-dimensional finite
element model based on magnetic resonance images International Journal of Oral
and Maxillofacial Surgery 30, 421-430.
Tanaka, E., Rego, E. B., Iwabuchi, Y., Inubushi, T., Koolstra, J. H., van Eijden, T. M. G. J.,
Kawai, N., Kudo, Y., Takata, T., Tanne, K., 2008. Biomechanical response of
condylar cartilage-on-bone to dynamic shear. Journal of Biomedical Materials
Research 85A, 127-132.
van Loon, J. P., de Bont, L. G. M., Boering, G., 1995. Evaluation of temporomandibular
joint prostheses Review of the literature from 1946 to 1994 and implications
for future prosthesis designs. Journal of Oral and Maxillofacial Surgery 53, 984-
996.
Human Musculoskeletal Biomechanics
182
Vollmer, D., Meyer, U., Joos, U., Vegh, A., Piffko, J., 2000. Experimental and finite element
study of a human mandible. 28, 91-96.
Wolford, L. M., 1997. Temporomandibular joint devices: Treatment factors and outcomes.
Oral Surgery, Oral Medicine, Oral Pathology, Oral Radiology, and Endodontics 83,
143-149.
Yoon, H. J., Baltali, E., Zhao, K. D., Rebellato, J., Kademani, D., An, K. N., Keller, E. E., 2007.
Kinematic study of the temporomandibular joint in normal subjects and patients
following unilateral temporomandibular joint arthrotomy with metal fossa-
eminence partial joint replacement Journal of Oral and Maxillofacial Surgery 65,
1569-1576.
Part 3
Nano Behavior
8
Design and Analysis of Key Components in the
Nanoindentation and Scratch Test Device
Hongwei Zhao, Hu Huang, Jiabin Ji and Zhichao Ma
Jilin University
China
1. Introduction
In recent years, nanomechanics as an important branch of nanotechnology has been an
effective method to study mechanical properties of structures and materials from micro- to
nano-scale. It has been widely used to study mechanical behaviour and damage mechanism
of nanotube, nanobelt as well as other nanostructures (Zhu & Espinosa, 2005; Han et al.,
2007). Some researchers studied biomechanics properties of tissues and organs of human
body, such as the red cell (Suresh, 2007; Lim et al., 2006) and bone (Tai et al., 2007; Hansma
et al., 2006; Thurner, 2009; Zheng & Mak, 1996; Koff et al., 2010; Huja et al., 2010; Diez-Perez
et al., 2010; Zhang et al., 2010) by means of experimental nanomechanics approaches, to
reveal occurrence rules, prevention and control methods of some diseases.
Compared with tensile, torsion, bend and hardness tests etc. during which samples are
usually in condition of simple stress state, nanoindentation and scratch test can obtain more
parameters of materials including hardness, modulus, fracture toughness, creep property,
fatigue, adhesion and so on (Doerner & Nix, 1986; Oliver & Pharr, 1992) because samples are
in condition of complex stress state. So, it has been widely used in fields of materials science
(Lucas & Oliver, 1999; Yang et al., 2007; Tao et al., 2010), nanotechnology, surface
engineering (Jardret & Morel, 2003 ), semiconductor (Michler et al., 2005; Zhao et al., 2009),
MEMS/NEMS (Abdel-Aal et al., 2005; Bhushan, 2007), biomedicine (Suresh, 2005),
biomechanics (Bruet et al., 2008) and so on. In addition, it is a useful method to study multi-
physical field coupled performance of materials (Bradby et al., 2003; Schuh et al., 2005;
Nowak et al., 2009). So in past years, nanoindentation and scratch test gave a big boost to the
development of related fields and also it was given huge attention in all over the world.
With further development of materials science and nanomechanics, more and more
researchers tried to study principle of deformation and damage of materials (De Hosson et
al., 2006; Rabe, 2006; Zhou & Komvopoulos, 2006). Nanoscale deformation: Seeing is
believing (Hemker & Nix, 2008). So research on in situ nanoindentation and scratch test was
proposed, through which process of deformation and damage of samples can be observed.
However, because of large size and complex structure of existing commercial equipments
(MTS NanoIndenter; Hysitron Incorporated; CSIRO.UMIS; Micro Materials Ltd.; CSM
instruments), they can not be installed on the stage of SEM or TEM to realize in situ
nanoindentation and scratch test. So, novel nanoindentation and scratch test devices are
required. And this is advanced technology and up to now there is no mature product for in
situ nanoindentation and scratch test.
Human Musculoskeletal Biomechanics
186
In this chapter, we introduced principle of nanoindentation. A new method of indentation
measurement through two displacement sensors and a displacement amplification structure
was proposed. This measuring method was different from many commercial devices. Two
key components of the proposed device including precise driving and precise measuring
units were designed and analyzed. Hysteresis of two kinds of piezoelectric stacks were
measured and analyzed. Here piezoelectric stacks and flexure hinges were used to realize
precise positioning and precise loading and unloading of the diamond indenter. Flexure
hinges with multi-structure forms were proposed and analyzed by finite element method.
Based on the previous work, the prototype of nanoindentation and scratch device was
designed and fabricated. Calibration experiments of sensors and displacement amplification
structure were carried out and output performances of designed flexure hinges were
measured and discussed. At last, nanoindentation experiments of optical glass were carried
out. The relation curves between penetration load and depth were obtained, from which
hardness of the glass was figured out. Nanoindentation morphology was obtained through
high resolution optical microscope. Nanoindentation results indicated that the device
presented in this chapter can realize the high precise nanoindentation test, but the testing
resolution should be improved and the device also should be calibrated precisely. Though
the accuracy was required to improve, this work was a bold attempt to combine the
piezoelectric-driven mechanism and flexure hinge to realize precise motion in
nanoindentation device. This transmission mode is very simple and can be used easily to
realize miniaturization of the device and in situ nanoindentation test which is our future
work.
2. Principle of nanoindentation test technology the Oliver-Pharr method
Nanoindentation is a useful method to test the mechanical behavior and damage
mechanism of materials from micro- to nano-scale. When a diamond indenter with sharp tip
is penetrating into and then withdrawing from a sample surface, the load P and
displacement h is continuously monitored by high resolution sensors. The load and
displacement data is sent to processor during the indentation process and then converted to
P-h curve which contains abundant information of material such as hardness, elastic
modulus, yield stress and so on. Fig.1 is a typical P-h curve of nanoindentation. It mainly
Fig. 1. A typical P-h curve of nanoindentation
Design and Analysis of Key Components in the Nanoindentation and Scratch Test Device
187
consists of two portions, loading and unloading process. Sometimes, in order to study creep
of materials, holding portion (holding for a certain time at maximum load) between loading
and unloading is added. Fig.2 is cross-section of indentation and the related parameters. Up
to now, the Oliver-Pharr method (Oliver & Pharr, 1992) based on results by Sneddon
(Sneddon, 1965) is most commonly used to analyze the load and penetration depth for
nanoindentation measurements.
Fig. 2. Cross-section of indentation
According to Oliver-Pharr method, nanoindentation hardness is defined as the indentation
load divided by the projected contact area of the indentation. In Fig.1, indentation hardness
(H) can be obtained at the peak load given by
H = P
max
/A
c
(1)
where P
max
is the peak load and A
c
is the projected contact area. And the projected contact
area can be calculated from the relation as following
A
c
= f (h
c
) (2)
where h
c
is the contact depth which is given by
max
cmax
P
hh
S
(3)
where
ε is a constant and depends on the geometry of the indenter (ε=0.72 for cone indenter,
ε=0.75 for paraboloid of revolution, and ε=1.00 for flat indenter) (Sneddon, 1965). h
max
is the
maximum penetration depth and S is the contact stiffness.
The contact stiffness
S can be calculated from the slope of the initial portion of the unloading
curve and S=dP/dh, which can be obtained by curve fitting of 25%-50% unloading data.
Based on relationships developed by Sneddon, the contact stiffness
S can also be expressed
by
r
2
A
SE
(4)
Human Musculoskeletal Biomechanics
188
where β is a constant and depends on geometry of the indenter (β =1.034 for a Berkovich
indenter,
β =1.012 for a Vickers indenter and β =1.000 for a cylinder indenter).
Because both the sample and the indenter have elastic deformation during the indentation
process, the reduced modulus
E
r
is defined by
22
i
ri
11 1
EE E
(5)
where
E and ν are the elastic modulus and Poisson’s ratio for the sample; E
i
and ν
i
are the
elastic modulus and Poisson’s ratio for the indenter, respectively. For a diamond indenter, E
i
=1141GPa,
ν
i
=0.07.
According to the Oliver-Pharr method mentioned above, the nanoindentation hardness, the
contact stiffness and the elastic modulus of materials can be obtained.
3. Idea of device design
Fig.3 is the schematic diagram of indentation device which will be designed in this chapter.
It mainly consists of two portions, precise driving unit including z-axis precise driving unit
(4), x, y precise positioning platform (8) and precise measuring unit including capacitance
displacement sensor (5), displacement amplification structure (9) and laser displacement
sensor (10). Compared with most of commercial indentation equipments, the principle is
different. Penetration load is not measured directly by a load sensor but it is obtained with
the help of displacement amplification structure and laser displacement sensor. When the
indenter is pushing into and withdrawing the sample located on the left of displacement
amplification structure, the amplification structure will deform and the right will output
enlarged displacement which is measured by high resolution laser displacement sensor. At
the same time, displacement of the indenter is measured by the capacitance displacement
sensor. Because deformation of displacement amplification structure is very small, it is
elastic deformation.
Fig. 3. Schematic diagram of the device which will be designed in this chapter 1 Base; 2(12)
Supporting plates; 3(11) Macro-adjusting mechanism; 4 z-axis precise driving unit; 5
Capacitance displacement sensor; 6 Indenter; 7 Sample; 8 x, y precise positioning platform; 9
Displacement amplification structure; 10 Laser displacement sensor
Calculation model and related parameters are shown in Fig.4.
P is penetration load and h
3
is
left deformation of displacement amplification structure corresponding to the load
P. h
1
and
Design and Analysis of Key Components in the Nanoindentation and Scratch Test Device
189
h
2
are right deformation and displacement of the indenter measured by laser displacement
sensor and capacitance displacement sensor, respectively.
P, h
1
, h
2
, h
3
and penetration depth
h have relationships as follows
h
3
= μh
1
(6)
P = λh
1
(7)
h = h
2
-h
3
=h
2
-μh
1
(8)
where
μ and λ are calibration coefficients.
Fig. 4. Calculation model and the related parameters.
According to equations (6)—(8), penetration load
P and depth h can be obtained, and
material parameters can be calculated by the Oliver-Pharr method.
4. Design and analysis of precise driving units
Nanoindentation and scratch test technology mainly involves precise driving and precise
measuring technology. For precise driving, there are many choices, for example,
electromagnetic driver, shape memory alloy driver, micro-film, micro-beam and so on. Up
to now, most of indentation devices are large because of using of electromagnetic and
electrostatic drivers which also need complex control. Due to size limitation of SEM and
TEM, these large indentation devices can not be used to realize in situ indentation test. So it
is necessary to find more suitable driving mechanism to ensure miniaturization of
indentation device. In this section, based on early research foundation on the piezoelectric-
driven and flexure hinge, kinds of precise driving units realized by piezoelectric actuator
and flexure hinge were designed.
4.1 Piezoelectric actuator
Principle of piezoelectric actuator is shown in Fig.5 which is based on the inverse piezo
effect. The piezoelectric actuator will deform when an electric voltage signal is applied to it.
Fig. 5. Principle of piezoelectric actuator
h1
h3
P
h2
Z
Y
Human Musculoskeletal Biomechanics
190
The amount of movement is a function of the polarity of the voltage applied and the
direction of the polarization vector.
Piezoelectric actuator takes many advantages of small size, unlimited resolution, large force
generation, fast response, low power consumption and no wear. So it is widely used in
fields of actuators, micro- and nano-positioning, laser tuning, active vibration damping,
micropumps, and so on. In this chapter, two kinds of piezoelectric actuator are selected,
PT200/10*10/40 piezoelectric stack used for z axis and AE0505D16F for x-y axis.
Hysteresis is an inherent property of piezoelectric ceramic. Hysteresis of the two kinds of
piezoelectric stacks was measured and shown in Fig.6 and Fig.7.
In Fig.6 and Fig.7, there are two curves, respectively. One is the output displacement when
voltage increases and the other is the output displacement when the voltage decreases. It is
obvious that the displacement is different at the same voltage and the two curves are not
symmetrical. The hysteresis
H can be expressed
100%
DMAX
S
D
H
D
(9)
where
D
DMAX
is the maximum difference of displacement at the same voltage; D
S
is the total
output displacement. In Fig.6, the maximum difference of displacement is about 1.15μm at
voltage 45V and the total output displacement is 12.91μm. According to equation (9), the
hysteresis is about 8.91% for AE0505D16F. In Fig.7, the maximum difference of displacement
is about 5.49μm at voltage 45V and the total output displacement is 35.92μm. According to
equation (9), the hysteresis is about 15.28% for PT200/10*10/40 piezoelectric stack.
So hysteresis is different for different kinds of piezoelectric stacks and some measurements
for example close-loop control should be taken to decrease the hysteresis for special
application.
Fig. 6. Hysteresis curve of AE0505D16F