Hydrodynamics Natural Water Bodies Part 10 pdf
Bạn đang xem bản rút gọn của tài liệu. Xem và tải ngay bản đầy đủ của tài liệu tại đây (2.57 MB, 25 trang )
Hydrodynamics – Natural Water Bodies
212
Moreover, corresponding to the wave-frequency peak and low-frequency peak of the
frequency spectra of the cable tensions, there occur the wave-frequency motions and low-
frequency motions in the tunnel element. This also reflects directly the interrelation of the
tunnel element motions and the cable tensions.
4. Conclusions
The motion dynamic characteristics of the tunnel element and the tensions acting on the
controlling cables in the immersion of the tunnel element under irregular wave actions are
experimentally investigated in this chapter. The irregular waves are considered normal
incident and the influences of the immersing depth of the tunnel element, the significant
wave height and the peak frequency period of waves on the tunnel element motions and the
cable tensions are analyzed. Some conclusions are drawn as follows.
As the immersing depth is comparatively small, the motion responses of the tunnel element
are relatively large. Besides the wave-frequency motions, the tunnel element has also the
low-frequency motions that result from the actions of cables. For the sway of the tunnel
element, for different immersing depth the low-frequency motion is always larger than the
wave-frequency motion. While for the heave, with the increase of the immersing depth, the
motion turns gradually from that the low-frequency motion is dominant into that the wave-
frequency motion is dominant.
For the large significant wave height, the motion responses of the tunnel element are
accordingly large. The peak values of the frequency spectra of the motion responses
increase rapidly with the increase of the peak frequency period of waves. Especially, for
the heave motion of the tunnel element, the peak frequency of the response spectrum
corresponding to the low-frequency motion increases with the increasing peak frequency
period.
The total force of the cables at the offshore side is larger than that of the cables at the
onshore side of the tunnel element. Corresponding to the motion responses of the tunnel
element, the cable tensions are relatively large and their variations are more complicated in
the case as the immersing depth is small and the significant wave height and the peak
frequency period are large comparatively. The changing laws of the tunnel element motions
and the cable tensions reflect the interrelation of them.
In this chapter, the immersion of the tunnel element is done from the fixed trestle in the
experiment, by ignoring the movements of the barges on the water surface. Actually, when
the movements of the barges are relatively large, they have influences on the motions of the
tunnel element. The influences of the movements of the barges on the tunnel element
motions will be considered in the further researches. The numerical investigation will also
be carried out on the motion dynamics of the tunnel element in the immersion under
irregular wave actions.
5. Acknowledgment
This work was partly supported by the Scientific Research Foundation of Third Institute of
Oceanography, SOA (Grant No. 201003), and partly by the National Natural Science
Foundation of China (Grant No. 51009032).
Experimental Investigation on Motions of
Immersing Tunnel Element under Irregular Wave Actions
213
6. References
Anastasopoulos, I., Gerolymos, N., Drosos, V., Kourkoulis, R., Georgarakos, Τ. & Gazetas, G.
(2007). Nonlinear Response of Deep Immersed Tunnel to Strong Seismic Shaking,
Journal of Geotechnical and Geoenviron-mental Engineering, Vol. 133, No 9, (September
2007), pp. 1067-1090, ISSN 1090-0241
Aono, T., Sumida, K., Fujiwara, R., Ukai, A., Yamamura K. & Nakaya, Y. (2003). Rapid
Stabilization of the Immersed Tunnel Element, Proceedings of the Coastal Structures
2003 Conference, pp. 394-404, ISBN 978-0-7844-0733-2, Portland, Oregon, USA,
August 26-30, 2003
Chen, S. Z. (2002). Design and Construction of Immersed Tunnel, Science Press, ISBN 7-03-
010112-X, Beijing, China. (in Chinese)
Chen, Z. J., Wang, Y. X., Wang, G. Y. & Hou, Y. (2009a). Frequency responses of immersing
tunnel element under wave actions, Journal of Marine Science and Application, 2009,
Vol. 8, pp. 18-26, (March 2009), ISSN 1671-9433
Chen, Z. J., Wang, Y. X., Wang, G. Y. & Hou, Y. (2009b). Time-domain responses of
immersing tunnel element under wave actions, Journal of Hydrodynamics, Ser. B, Vol.
21, No. 6, (December 2009), pp. 739-749, ISSN 1001-6058
Chen, Z. J., Wang, Y. X., Wang, G. Y. & Hou, Y. (2009c). Experimental Investigation on
Immersion of Tunnel Element, 28th International Conference on Ocean, Offshore and
Arctic Engineering, pp. 1-8, ISBN 978-0-7918-4344-4, Honolulu, Hawaii, USA, May
31–June 5, 2009
Ding, J. H., Jin, X. L., Guo, Y. Z. & Li., G. G. (2006). Numerical Simulation for Large-scale
Seismic Response Analysis of Immersed Tunnel, Engineering Structures, Vol. 28, No.
10, (January 2006), pp. 1367-1377, ISSN 0141-0296
Gursoy, A., Van Milligen, P. C., Saveur, J. & Grantz, W. C. (1993). Immersed and Floating
Tunnels, Tunnelling and Underground Space Technology, Vol.8, No.2, (December
1993), pp. 119-139, ISSN 0886-7798
Hakkaart, C. J. A. (1996). Transport of Tunnel Elements from Baltimore to Boston, over the
Atlantic Ocean, Tunnelling and Underground Space Technology, Vol. 11, No. 4,
(October 1996), pp. 479-483, ISSN 0886-7798
Ingerslev, L. C. F. (2005). Considerations and Strategies behind the Design and
Construction Requirements of the Istanbul Strait Immersed Tunnel, Tunnelling
and Underground Space Technology, Vol. 20, (October 2005), pp. 604-608, ISSN 0886-
7798
Kasper, T., Steenfelt, J. S., Pedersen, L. M., Jackson P. G. & Heijmans, R. W. M. G. (2008).
Stability of an Immersed Tunnel in Offshore Conditions under Deep Water Wave
Impact. Coastal Engineering, Vol. 55, No. 9, (August 2008), pp. 753-760, ISSN 3783-
3839
Zhan, D. X. & Wang, X. Q. (2001a). Experiments of hydrodynamics and stability of
immersed tube tunnel on transportation and immersing. Journal of Hydrodynamics,
Ser. B, Vol. 13, No. 2, (June 2001), pp. 121-126, ISSN 1001-6058
Zhan, D. X., Zhang, L. W., Zhao, C. B., Wu, J. P. & Zhang, S. X. (2001b) Numerical
simulation and visualization of immersed tube tunnel maneuvering and
immersing, Journal of Wuhan University of Technology (Transportation Science
Hydrodynamics – Natural Water Bodies
214
and Engineering), Vol. 25, No. 1, (March 2001), pp. 16-20, ISSN 1006-2823 (in
Chinese)
Zhao, Z. G. (2007). Discussion on Several Techniques of Immersed Tunnel Construction.
Modern Tunnelling Technology, Vol. 44, No.4, (August 2007), pp. 5-8, ISSN1009-6582
(in Chinese)
11
Formation and Evolution of Wetland and
Landform in the Yangtze River Estuary Over the
Past 50 Years Based on Digitized Sea Maps and
Multi-Temporal Satellite Images
Xie Xiaoping
School of Geography and Tourism,
Qufu Normal University, Qufu
China
1. Introduction
The Yangtze River originates in the Qinghai-Tibet Plateau and extends more than 6300 km
eastward to the East China Sea, a tectonic subsidence belt (Li & Wang, 1991). It is one of the
largest rivers in the world, in terms of suspended sediment load, water discharge, length,
and drainage area. The Yangtze River Estuary is located in the east China. There are three
main islands including Chongming Island, Changxing Island, and Hengsha Island as well as
several shoals in the Yangtze River Estuary (Fig. 1). These islands once are shoals emerged
from the water and merged to the north bank or coalesced together. In the Yangtze River
Estuary, most of the sediments from the drainage basin are suspended. The spatial and
temporal variations of the suspended sediment concentration in the estuarine field survey
indicate that the sediment is suspended, transported, and deposited under riverine and
marine processes, such as river flow, waves, tidal currents, and local topography (Cao et al.,
1989; Chen, 2001; Gao, 1998; Li et al., 1995, Huang and Chen, 1995; Xu et al., 2002; Pan and
Sun, 1996). In longitudinal section, these islands and shoals stand out on the link between
the -10 m isobathic line (the zero elevation means the 1956 Yellow Sea Water Surface in
Qingdao Tidal Station, Qingdao, Shandong Province, China) from the upper reach section to
the lower reach section, it is a convex geomorphic unit in the Yangtze River Estuary (Fig.2
A-A´ and Fig. 3), in transverse section, these shoals and islands sit in between the channels
and distributaries (Fig.2 B-B´ and Fig. 4). In order to analyze the formation and evolution of
the wetland and landform of the Yangtze River Estuary, related sea maps from 1945 to 2001
and satellite images from 1975 to 2001 are collected and analyzed. Water and sediment
discharge from 1950 to 2003 at the Datong Hydrologic Station 640 km upstream from the
estuary mouth are also collected. Datong Hydrologic Station is the most downstream
hydrologic station on the free-flowing Yangtze River, where the tidal influence can affect
flows hundreds of kilometers upstream. All related sea maps are digitized using
Mapinfo7.0, and the sediment volume deposited in this area is calculated from a series of
processes dealt in Surfer7.0. The relation between formation and evolution of the wetland
and landform of the Yangtze Estuary over the past 50 years were analyzed via Geographical
Information System technology and a Digital Elevation Model.
Hydrodynamics – Natural Water Bodies
216
Fig. 1. The sketch map of the Yangtze River Estuary
()
N
-60
-50
-40
-30
-20
-10
-5
0
121 121.3 121.6 121.9 122.2 122.5
30.8
31.1
31.4
31.7
E
a
s
t
e
rn
H
e
n
g
s
h
a
T
i
d
a
l
F
l
a
t
J
i
u
d
u
a
n
s
h
a
S
h
o
a
l
()
E
C
h
o
n
g
m
in
g
I
sl
a
n
d
C
h
a
n
g
x
in
g
I
s
.
Hengsha Is.
Hangzhou Bay
N
o
rt
h
P
a
s
s
a
g
e
S
o
u
t
h
P
a
s
s
a
g
e
A
A'
North Channel
B'
B
(m)
Fig. 2. Location of the Jiuduansha Shoal in Yangtze River Estuary
Formation and Evolution of Wetland and Landform in the Yangtze River Estuary Over
the Past 50 Years Based on Digitized Sea Maps and Multi-Temporal Satellite Images
217
-15
-12
-9
-6
-3
0
3
121.7 121.9 122.1 122.3 122.5
long.
Elevation(m)
1959
1979
1990
2001
Jiuduansha Shoal
1959
1979
2001
1990
Fig. 3. Longitudinal section at 121°35′E, 31°16′N-122°25′E, 31°5′N (shown on Fig. 2 as A-A')
of the Jiuduansha Shoal from 1959 to 2001
-9
-6
-3
0
3
6
31 31.1 31.2 31.3 31.4
Elevation(m)
1953 1959 1965 1979 1986 1990 1997 200
1
Nanhui Marginal
Tidal Flat
South Passage
Jiuduansha
Shoal
North
Passage
North
Channel
1953
1997
1965
1986
1959
1979
2001
1990
Eastern Hengsha
Tidal Flat
Fig. 4. Sketch map of the cross section at 122°E (shown on Fig. 2 as B-B') of the Yangtze River
Estuary from 1953 to 2001
Hydrodynamics – Natural Water Bodies
218
2. Data and methodology
In order to analyze the formation and evolution of the Yangtze River Estuary in past 50
years, related sea maps from 1945 to 2001 and satellite images from 1975 to 2001 are
collected and analyzed. Landsat MSS (multi-spectral scanner) data acquired on 1975 and
1979, Landsat TM (Thematic Mapper) and Landsat ETM+ (Enhanced Thematic Mapper
Plus) from 1990 to 2001, ASTER (Advanced Spaceborne Thermal Emission and Reflection
Radiometer) data from2002 to 2005 were collected and analysed. All these remote sensing
data were corrected geometrically. Image processing of these satellites remote sensing data
were used ENVI4.6 and Erdas9.0. And formation and evolution of the landform over the
past 50 years are analyzed in detail.
3. Formation and evolution of wetland and landform
3.1 Formation mechanism of the Yangtze River Estuary
The Yangtze River Estuary is nearly 90 km wide at the mouth from the Southern cape to the
Northern cape. Coriolis force and centrifugal force are strong enough to cause a horizontal
separation of the flow, forming an ebb tide dominated channel and a flood tide dominated
channel, respectively. Because of the river bed friction, tidal currents and wave power
decreased during the tidal currents flow into the mouth and wave form began to change,
and the flood tidal range in the northern part is larger than that in the southern part of the
same cross section, while in the ebb tide period, the longitudinal water surface gradient and
the transverse water surface slope increase (Zhang and Wang, 1987). The transverse water
surface slope caused by curve bend circulation is J
B
,
2
cp
B
2
V
g
J 1 5.75
g
r
C
(1)
where
C is the Chézy roughness coefficient, V
cp
is the vertical mean velocity, r is the river
bend radius of curvature, and
g is the acceleration of gravity. For example, when V
cp
= 2
m/s
,r = 10,000 m,C = 90 m
1/2
/s,and g = 9.81 m/s
2
, then J
B
= 4.1×10
-5
.
Another factor that might affect transverse water surface slope in the Yangtze River Estuary
is the Coriolis force. The transverse water surface slope caused by the Coriolis force was
studied by Zou (1990), in this case the transverse water surface slope is
J
C
,
cp
C
2Vsin
J
g
(2)
where
is the rotational angular velocity of the earth,
=7.27×10
-5
(s
-1
);
is the stream
section latitude,
is 32°. If V
cp
is equal to 2.0 m/s in the calculation like in curve bend
circulation, and
g is 9.81 m/s
2
, then J
C
= 1.57×10
-5
.
Comparing
J
C
and J
B
, shows that for similar condition, the slope caused by the Coriolis force
is smaller than that caused by curve bend circulation. However, due to the long term action
of the Coriolis force, the thalweg of the ebb current and river flow is directed to the right
bank and formed the Ebb Channel, while the thalweg of the flood current is directed to the
left and formed the Flood Channel, the main tide direction is nearly 305° progressing from
the East China Sea toward the river mouth area while the ebb tide current direction is nearly
Formation and Evolution of Wetland and Landform in the Yangtze River Estuary Over
the Past 50 Years Based on Digitized Sea Maps and Multi-Temporal Satellite Images
219
90°-115°. The ebb tide current is not in a direction opposite to the flood tide direction; there
is a 10°-35° angle between the extension line of the flood and ebb tidal currents because of
the Coriolis force(Shen et al., 1995). Ebb tidal current is obviously diverted to the south,
while the flood current is diverted to the north. Thus, between the flood and ebb tidal
currents in the river mouth area there is a slack water region where sediment rapidly
deposited to form shoals, and eventually coalesced to form estuarine islands (Chen et al.,
1979). This is the evolutionary history of the three larger islands (Chongming Island,
Changxing Island and Hengsha Island, respectively) in the estuary. These islands form three
orders of bifurcation and four outlets in the Yangtze River Estuary. The first order of the
bifurcation is the North Branch and the South Branch separated by Chongming Island. The
South Branch is further divided into the North Channel and the South Channel by
Changxing Island and Hengsha Island. The South Channel is further divided into the North
Passage and the South Passage by the Jiuduansha Shoal (Fig. 1). Therefore, the Yangtze
River Estuary has North Branch, North Channel, North Passage and South Passage four
outlets through which the water and sediment from the Yangtze River discharge into the
East China Sea.
From 1950 to 2003, the annual water discharge at the Datong Hydrologic Station did not
substantially change. The total annual discharge is about 9481×10
8
cubic meters per year and
the sediment load is about 3.52×10
8
tons/yr. The sediment discharge during the flood
season (from May to October) constituted 87.2% of the annual sediment load before the
1990s, but decreased in the 1990s (Fig. 5). Most of the suspended sediment are silt and clay,
which are transported to the East China Sea where they are carried away from the delta by
the longshore currents. Part of the suspended load is deposited in mouth bars and a
subaqueous delta area to form the tidal flats and mouth bars in the Yangtze Estuary. A
broad mouth bar system and tidal flats were formed. The runoff and the sediment discharge
100
300
500
700
900
1100
1300
1500
1950 1955 1960 1965 1970 1975 1980 1985 1990 1995 2000
Year
Annual water runoff (billion m
3
)
100
200
300
400
500
600
700
Sediment load (billion kg)
Annual water runoff Sediment load
Fig. 5. Water and Sediment discharge from 1950 to 2003 at Datong Hydrologic Station.
Hydrodynamics – Natural Water Bodies
220
during the flood season vary between 71.7 and 87.2 % of the annual total value based on
data from the Datong Hydrologic Station. According to previous research (Gong and Yun,
2002; Niu et al., 2005), at discharges greater than 60,000 m
3
/s at the Datong Hydrologic
Station, the estuarine riverbed has obviously changed due to erosion and deposition; when
the flood water discharge greater than 70,000 m
3
/s, can form new branches on the river and
cluster ditches because of the floodplain flows, these changes affect the estuary and new
navigation channel development. In 1954 (from June 18
th
to October 2
nd
), the average water
discharge at the Datong Hydrologic Station was about 60,000 m
3
/s, and the highest
discharge was about 92,600 m
3
/s. Water discharge greater than 60,000 m
3
/s, increase the
water surface gradient and the sediment carrying capacity in the estuary (Yang et al., 1999).
Estuarine sedimentation and landform features have been observed and studied in various
settings around the world, including the Thames Estuary, Cobequid Bay, and the Bay of
Fundy (Dalrymple and Rhodes, 1995; Knight, 1980; Dalrymple et al., 1990), as well as
Chesapeake Bay (Ludwick, 1974) and Moreton Bay (Harris et al., 1992). These studies found
that tidal bars in all these estuarine settings are important sedimentary features. Because
estuaries are areas where freshwater and seawater mix, the systems react very sensitively to
small changes in geomorphology of the estuary, and the results can reveal the changes of the
estuarine environment.
According to the evolution history of the Yangtze River Estuary (Wang et al., 1981; Li et al.,
1983; Qin and Zhao, 1987; Qin et al., 1996; Chen et al., 1985, 1991; Chen and Stanley 1993,
1995; Stanley and Chen, 1993; Hori, K. et al., 2001a, 2001b, 2002; Saito, Y. et al., 2001), the
main delta was formed by the step-like seaward migration of the river mouth bars from
Zhenjiang and Yangzhou area, the apex of the delta, to the present river mouth (Fig. 6).
The newer generation island is Jiuduansha Shoal, it was once the southern part of the
Tongsha Tidal Flat. In 1945, under the processes of ebb and flood tidal currents, one pair of a
Fig. 6. Evolution history of the Yangtze River Estuary (after Chen et al., 2000)
Formation and Evolution of Wetland and Landform in the Yangtze River Estuary Over
the Past 50 Years Based on Digitized Sea Maps and Multi-Temporal Satellite Images
221
flood channel and an ebb channel developed on the southern part of the Tongsha Tidal Flat,
but the Jiuduansha Shoal had not formed as an isolated shoal (Fig.7).
In 1954, the ebb channel and flood channel on the Tongsha Tidal Flat linked up, the linked
ebb and flood channel formed the North Passage under the Flood from the drainage basin.
While the -2 m isobath line linked up the ebb channel and the flood channel, the Jiuduansha
Shoal was isolated, and the Jiuduansha Shoal formed as a new island in the Yangtze River
Estuary (Fig.8).
Fig. 7. Former Jiuduansha Shoal in 1945
121.5 121.6 121.7 121.8 121.9 122 122.1 122.2
31.1
31.2
31.3
31.4
31.5
H
e
n
g
s
h
a
I
s
.
J
i
u
d
u
a
n
s
h
a
S
h
o
a
l
Eastern Hengsha Shoal
C
h
a
n
g
x
i
n
g
I
s
.
N
o
r
th
P
a
s
s
a
g
e
S
o
u
th
P
as
s
age
Lat.
Long.
-20
-15
-10
-5
-2
0
2
(m)
Fig. 8. The Jiuduansha Shoal and the North and South Passage in 1959.
Hydrodynamics – Natural Water Bodies
222
The formation and landform evolution of the Yangtze River Estuary are related to the water
and the sediment coming from the drainage basin and human activities, and also related to
the riverine and marine processes. The Yangtze River Estuary is an irregular semidiurnal
tidal estuary, there is a clearly different tidal range in a day, especially, the daily mean
higher high tide is 1.47 m higher than lower high tide (Shen and Pan, 1988). in a tidal cycle, a
flow diversion period exists, and this period differs throughout the year because of the
different flood and dry seasons, and different spring and neap cycles. The channel bed
changes easily and frequently under the actions of the runoff and the tidal current, while the
human activities such as reclamation and navigation channel construction is also influence
the landform features.
3.2 Field survey evaluation
In order to study the relation between the deposition and erosion of the tidal flat during the
flood and dry season at spring and neap tides, field survey data for the middle section of the
North Passage and the South Passage are analyzed. The velocity and sediment concentration
in the North Passage and the South Passage during the spring tidal cycle obtained in the
field survey use OBS 5 and DCDP and water and sediment samples which measured in the
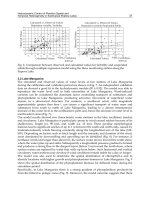
laboratory, part of the related results are shown in Fig. 9 and Fig. 10, and a summary of the
collected data is listed in Table 1.
Data from this field survey show that the flow velocity and sediment concentration in the
dry and flood seasons at spring and neap tidal cycles are different. In the dry season during
spring tide in the South Passage, the flow velocity at the water surface (H is the relative
water depth, the surface is 0H, 1H is the bottom) in the ebb tide period is higher than that in
the flood tide period (Table 1). At a relative depth of 0.4H, the ebb tide velocity is lower than
that the flood tide current. At 0.8H relative depth from the water surface, the flow velocity
of the ebb tide is lower than that the flood tide current. In the neap tidal cycle in the South
Passage, the ebb tide and river flow velocity at relative depth of 0H and 0.4H depth are
higher than that flood tide velocity respectively, but the flood velocity at relative depth of
0.8H is higher than that ebb and river flow velocity.
In the dry season during spring tide in the North Passage, the velocity of ebb tide and river
flow at relative depth of 0H is little lower than that flood velocity, but at relative depth of
0.4H and 0.8H are little higher than that flood velocity, respectively. While during the neap
tide period, the ebb and river flow velocity at relative depth of 0H, 0.4H, and 0.8H are
higher than that flood tide velocity respectively.
In the flood season during the spring and neap tidal cycle in the South and North Passage,
the ebb tide and river flow velocity at relative depth of 0H, 0.4H, and 0.8H depth are
correspondingly higher than that flood velocity, respectively.
In most cases, the mean sediment concentration during ebb tide period in the South and
North Passage in the dry and flood season during the spring tidal cycle at relative depth of
0H, 0.4H, and 0.8H are higher than that flood tide period, respectively. But in some cases,
the sediment concentration at relative depth of 0H and 0.4H are different because of the
different riverine mechanics during the spring and neap tidal cycle.
Through the comparison of the velocity of ebb tide and river flow with flood tide velocity
during the spring and neap tidal cycle in flood and dry season, in most cases, the ebb tide
and river flow velocity at water surface is higher than the flood tide velocity, while at
relative depth of 0.4H and 0.8H, in some cases, the flood tide velocity is higher than that the
ebb tide and river flow velocity. That is during the flood tide period, flood tide current start
Formation and Evolution of Wetland and Landform in the Yangtze River Estuary Over
the Past 50 Years Based on Digitized Sea Maps and Multi-Temporal Satellite Images
223
-300
-200
-100
0
100
200
300
9:00 12:00 15:00 18:00 21:00 0:00 3:00 6:00 9:00 12:00
Date and Time
Flow Velocity (cm/s
)
0H 0.4H 0.8H
17,Feb. 18,Feb.
(a)
0.000
0.500
1.000
1.500
2.000
2.500
3.000
3.500
4.000
9:00 12:00 15:00 18:00 21:00 0:00 3:00 6:00 9:00 12:00
Date and Time
Sediment Concentration (kg/m
3
)
0H 0.4H 0.8H
17,Feb. 18,Feb.
(b)
Fig. 9. Variation of the (a) flow velocity and (b) sediment concentration in the dry season at
spring tide in the North Passage, where 0H means measured at the surface, 0.4H and 0.8H
means measured at the 0.4 and 0.8 fractions of depth (H) from the surface, respectively.
Hydrodynamics – Natural Water Bodies
224
-250
-200
-150
-100
-50
0
50
100
150
200
250
11:00 14:00 17:00 20:00 23:00 2:00 5:00 8:00 11:00
Date and Time
0H 0.4H 0.8H
17,Feb. 18,Feb.
Flow Velocity (cm/s)
(a)
0.0000
0.3000
0.6000
0.9000
1.2000
1.5000
1.8000
11:00 14:00 17:00 20:00 23:00 2:00 5:00 8:00 11:00
Date and Time
Sediment Concentration (kg/m
3
)
0H 0.4H 0.8H
17,Feb . 18,Feb .
(b)
Fig. 10. Variation of the (a) flow velocity and (b) sediment concentration in the dry season at
spring tide in the South Passage, where 0H means measured at the surface, 0.4H and 0.8H
means measured at the 0.4 and 0.8 fractions of depth (H) from the surface, respectively.
Formation and Evolution of Wetland and Landform in the Yangtze River Estuary Over
the Past 50 Years Based on Digitized Sea Maps and Multi-Temporal Satellite Images
225
In the flood season
North Passage
spring tide (15-16, July) neap tide (20-21, July)
Max
Flood
Velocity
(cm/s)
0H 122 Sediment
Concentration
(kg/m
3
)
0H 0.21 Max
Flood
Velocity
(cm/s)
0H 74 Sediment
Concentration
(kg/m
3
)
0H 0.11
0.4H 113 0.4H 0.34 0.4H 86 0.4H 0.22
0.8H 111 0.8H 0.78 0.8H 76 0.8H 0.48
Max Ebb
Velocity
(cm/s)
0H 195 Sediment
Concentration
(kg/m
3
)
0H 0.87 Max Ebb
Velocity
(cm/s)
0H 139 Sediment
Concentration
(kg/m
3
)
0H 0.51
0.4H 193 0.4H 0.16 0.4H 129 0.4H 0.55
0.8H 145 0.8H 1.53 0.8H 111 0.8H 0.56
South Passage
spring tide (15-16, July) neap tide (20-21, July)
Max
Flood
Velocity
(cm/s)
0H 198 Sediment
Concentration
(kg/m
3
)
0H 0.40 Max
Flood
Velocity
(cm/s)
0H 79 Sediment
Concentration
(kg/m
3
)
0H 0.22
0.4H 191 0.4H 1.16 0.4H 77 0.4H 0.22
0.8H 159 0.8H 1.82 0.8H 61 0.8H 0.38
Max Ebb
Velocity
(cm/s)
0H 246 Sediment
Concentration
(kg/m
3
)
0H 0.88 Max Ebb
Velocity
(cm/s)
0H 180 Sediment
Concentration
(kg/m
3
)
0H 0.29
0.4H 232 0.4H 1.97 0.4H 164 0.4H 0.28
0.8H 184 0.8H 1.97 0.8H 116 0.8H 1.09
In the dry season
North Passage
spring tide (17-18, Feb.) neap tide (23-24, Feb.)
Max
Flood
Velocity
(cm/s)
0H 233 Sediment
Concentration
(kg/m
3
)
0H 0.07 Max
Flood
Velocity
(cm/s)
0H 147 Sediment
Concentration
(kg/m
3
)
0H 1.02
0.4H 207 0.4H 0.59 0.4H 125 0.4H 0.46
0.8H 141 0.8H 1.37 0.8H 88 0.8H 2.30
Max Ebb
Velocity
(cm/s)
0H 228 Sediment
Concentration
(kg/m
3
)
0H 0.53 Max Ebb
Velocity
(cm/s)
0H 220 Sediment
Concentration
(kg/m
3
)
0H 0.14
0.4H 225 0.4H 0.74 0.4H 190 0.4H 0.70
0.8H 180 0.8H 2.59 0.8H 117 0.8H 1.23
South Passage
spring tide (17-18, Feb.) neap tide (23-24, Feb.)
Max
Flood
Velocity
(cm/s)
0H 197 Sediment
Concentration
(kg/m
3
)
0H 0.51 Max
Flood
Velocity
(cm/s)
0H 130 Sediment
Concentration
(kg/m
3
)
0H 0.70
0.4H 194 0.4H 0.83 0.4H 121 0.4H 0.88
0.8H 160 0.8H 0.95 0.8H 101 0.8H 1.53
Max Ebb
Velocity
(cm/s)
0H 213 Sediment
Concentration
(kg/m
3
)
0H 0.10 Max Ebb
Velocity
(cm/s)
0H 188 Sediment
Concentration
(kg/m
3
)
0H 0.11
0.4H 175 0.4H 1.01 0.4H 143 0.4H 0.36
0.8H 137 0.8H 1.21 0.8H 93 0.8H 1.09
Table 1.
from the bottom firstly, and during the ebb tide period, the ebb tide current start from the
surface firstly. These different riverine and marine mechanics may cause the sediment
deposited during the flood season because of the more longer slack water period, during the
dry season, because of the lower water level and less water discharge from the drainage
basin, Jiuduansha Shoal will be eroded. During the neap tidal cycle, the flow velocity is
lower than that during the spring tidal cycle, and the sediment concentration is lower than
Hydrodynamics – Natural Water Bodies
226
that the spring tidal cycle, that means the more sediment deposited on the tidal flat and
estuarine river channel. During spring tidal cycle, because of the higher flow velocity and
stronger tidal current, some of the deposited sediment in the channel and tidal flats maybe
eroded and maximum turbidity formed.
3.3 Evolution of the Eastern Chongming Tidal Flat, Jiuduansha Shoal and Nanhui
Marginal Tidal Flat
The Yangtze River transported a quantity of sediment into the estuarine region, and deposited
sediment in estuary formed the tidal flats and shoals. About 2/3 of land area are expanded
because of reclamation of the tidal flat, in nearly 50 years, about 800km
2
been reclaimed. From
1978 on, about 338.4km
2
tidal flat been reclaimed, especially in Eastern Chongming Tidal Flat
and Nanhui Marginal Tidal Flat, and the reclamation still continued at present.
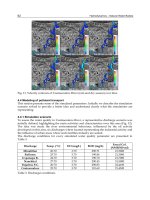
Eastern Chongming Tidal Flat, Jiuduansha Shoal and Nanhui Marginal Tidal Flat are the
three very important wetlands in Yangtze Estuary. The Eastern Chongming Tidal Flat is an
important wetland in the Yangtze River Estuary, from 1975 to 2005, the reclaimed area of the
upper tidal flat is about 82 km
2
, that means about all tidal flat over 0m isobathic line had
been reclaimed under 1992, 1998 and 2001 levees construction (Fig. 11-14). Nanhui Marginal
Tidal Flat is the main tidal flat in the south bank of the Yangtze River Estuary, but continued
reclamation in past 30 years, about 140km
2
tidal flat had been reclaimed, and the tidal flat
has lost the ecological significance because of the human actions (Fig. 15-16). After the
formation of the Jiuduansha Shoal because of the Flood in 1954, the area, volume, and
elevation of the Jiuduansha Shoal increased respectively. Figure 11 and figure 12 to 13 show
a comparison of the Jiuduansha Shoal during 1975 to 2005. In 1975, the Jiuduansha shoal still
formed by three shoals named Shangsha, Zhongsha and Xiasha respectively, there is only
9.5km
2
over 1m isobathic line (Yellow Sea Level) (Fig.17), under the riverine and marine
processes, and human actions in the Yangtze Estuary, and Zhongsha and Xiasha coalesced
in 2001 (Fig.18), and then three shoals of Jiuduansha Shoal coalesced in 2005 (Fig.19).
Fig. 11. Main tidal flat in Yangtze Estuary in 1975
Formation and Evolution of Wetland and Landform in the Yangtze River Estuary Over
the Past 50 Years Based on Digitized Sea Maps and Multi-Temporal Satellite Images
227
Fig. 12. Eastern Chongming Tidal Flat in 1990
Fig. 13. Eastern Chongming Tidal Flat in 2001
Hydrodynamics – Natural Water Bodies
228
Fig. 14. Eastern Chongming Tidal Flat in 2005
Fig. 15. Nanhui Marginal Tidal Flat in 2001
Formation and Evolution of Wetland and Landform in the Yangtze River Estuary Over
the Past 50 Years Based on Digitized Sea Maps and Multi-Temporal Satellite Images
229
Fig. 16. Nanhui Marginal Tidal Flat in 2005
Hydrodynamics – Natural Water Bodies
230
Fig. 17. Jiuduansha shoal in 1975
Fig. 18. Jiuduansha shoal in 2001
Formation and Evolution of Wetland and Landform in the Yangtze River Estuary Over
the Past 50 Years Based on Digitized Sea Maps and Multi-Temporal Satellite Images
231
Fig. 19. Jiuduansha shoal in 2005
4. Conclusions
1. Eastern Chongming Tidal Flat is increased consistently in area and altitude. After the
construction of 1992 and 1998 levee and 2001 dike, the higher tidal flat has been
reclaimed, but due to the deposition of the sediment from the drainage basin, the higher
tidal flat, inter-tidal flat and lower tidal flat are increased continuously.
2.
The Jiuduansha Shoal formed in 1954 because of the historically large Flood in the
Yangtze River Basin, the Flood caused the ebb channel and flood channel merge, and
the Jiuduansha Shoal isolated from the Southern Tongsha Tidal Flat. Because of the
Siltation on the Jiuduansha Shoal, the area and altitude of the Jiuduansha shoal
increased consistently.
3.
Nanhui Marginal Tidal Flat once an important tidal flat in southern bank of the Yangtze
River Estuary, it is had lost the ecological situation because of the reclamation to 0m
isobathic line.
5. Acknowledgements
This work was supported by the NSFC (41072164) , National Key Basic Research and
Development Program (Grant No. 2003CB415206) and MHREG (MRE201002).
6. References
Cao, Peikui, Hu, Fangxi, Gu, Guochuan, and Zhou, Yueqin, 1989, Relationship between
suspended sediments from the Changjiang Estuary and the evolution of the
embayed muddy coast of Zhejiang Province, Acta Oceanologica Sinica, 8(2), 273-
283.
Hydrodynamics – Natural Water Bodies
232
Chen, Shenliang, 2001, Seasonal, neap-spring variation of sediment concentration in the joint
area between Yangtze Estuary and Hangzhou Bay, Science in China (Series B), Vol.
44 Supp, 57-62.
Chen, J., Zhu, H., Dong, Y., Sun, J., 1985. Development of the Changjiang Estuary and its
submerged delta. Continental Shelf Research. 4: 47-56
Chen, J.Y., Yun, C.X., Xu, H.G., Dong, Y.F., 1979. The evolutional model of the Changjiang
river mouth since 2000 years. Oceanol. Sin., 1 (1): 103-111 (in Chinese with English
abstract)
Chen, Z., Stanley, D.J., 1993. Changjiang delta, eastern China: 2. Late Quaternary subsidence
and deformation. Marine Geology 112, 13– 21
Chen, Z., Stanley, D.J., 1995. Quaternary subsidence and river channel migration in the
Changjiang delta plain, eastern China. Journal of Coastal Research 11, 927–945
Chen, Z., Xu, Sh., Yan, Q., 1991. Sedimentary facies of Holocene subaqueous Changjiang
river delta. Oceanologia & limnologia Sinica. 22 (1) 29-37 (in Chinese with English
abstract)
Dalrymple, R.W., Knight, R.J., Zaitlin, B.A., Middleton, G.V., 1990. Dynamics and facies
model of a macrotidal sandbar complex. Cobequid Bay–Salmon River Estuary (Bay
of Fundy). Sedimentology 37, 577–612.
Dalrymple, R.W., Rhodes, R.N., 1995. Estuarine dunes and bars. In: Perillo, G.M.E. (Ed.),
Geomorphology and Sedimentology of Estuaries. Developments in Sedimentology
53, Elsevier, Amsterdam, pp. 359–422
Gao, Jin, 1998, The evolutional rule of Changjiang River mouth and hydrodynamic effect,
Acta Geographica Sinica, 53(3), 264-269 (in Chinese with English summary).
Gong, Cailan and Yun, Caixing, 2002, Floods rebuilding the riverbed of the Changjiang
Estuary, The Ocean Engineering, 20(3), 94-97, (in Chinese with English
summary).
Harris, P.T., Pattiaratchi, C.B., Cole, A.R., Keene, J.B., 1992. Evolution of subtidal sandbanks
in Moreton Bay, eastern Australia. Mar. Geol. 103, 225–247
Huang, Weikai and Chen, Jiyu, 1995, Prediction of topography changes in Changjiang River
Estuary bar, Oceanologia & Limnologia Sinica, 26(4), 343-349 (in Chinese with
English abstract).
Kazuaki Hori, Yoshiki Saito, Quanhong Zhao, Pinxian Wang, 2002. Architecture and
evolution of the tide-dominated Changjiang (Changjiang) River delta, China.
Sedimentary Geology. 146: 249-264
Kazuaki Hori, Yoshiki Saito, Quanhong Zhao, Xinrong Cheng, Pinxian Wang, Yoshio
Sato, Congxian Li, 2001a. sedimentary facies of the tide-dominated paleo-
Changjiang (Changjiang) estuary during the last transgression. Marine Geology.
177, 331-351
Kazuaki Hori, Yoshiki Saito, Quanhong Zhao, Xinrong Cheng, Pinxian Wang, Yoshio Sato,
Congxian Li, 2001b. Sedimentary facies and Holocene progradation rates of the
Changjiang (Changjiang) delta, China. Geomorphology. 41.233-248
Knight, R.J., 1980. Linear sand bar development and tidal current flow in Cobequid Bay, Bay
of Fundy, Nova Scotia. In: McCann, S.B. (Ed.), The Coastline of Canada. Geol. Surv.
Can. Pap., 80-10, 123–152.
Formation and Evolution of Wetland and Landform in the Yangtze River Estuary Over
the Past 50 Years Based on Digitized Sea Maps and Multi-Temporal Satellite Images
233
Li, Jiufa, Shen, Huanting, and Xu, Haigen, 1995, The bedload movement in the Changjiang
River Estuary, Oceanologia & Limnologia Sinica, 26(2), 138-145 (in Chinese with
English abstract).
Li, C., Wang, P., 1991. Stratigraphy of the Late Quaternary barrier–lagoon depositional
system along the coast of China. Sedimentary Geology 72, 189–200.
Li, C.X., Li, P., Chen, X.R., 1983. Effects of marine factors on the Changjiang River channel
below Zhengjiang. Acta Geographica Sinica 38 (2): 128—140 (in Chinese, with
English abstract).
Ludwick, J.C., 1974. Tidal currents and zig-zag sand shoals in a wide estuary entrance. Geol.
Soc. Am. Bull. 85, 717–726.
Niu, Xinqiang, Xu, Jianyi, and Li, Yuzhong, 2005, Preliminary analysis for influence of flow
and sediment variation on underwater bar growth in the estuary of the Yangtze
River, Yangtze River, 36(8), 31-33 (in Chinese with English Summary).
Pan, Ding’an and Sun, Jiemin, 1996, The sediment dynamics in the Changjiang River
Estuary mouth bar area, Oceanologia & Limnologia Sinica, 27(2), 279-286 (in
Chinese with English abstract).
Qin, Y., Zhao S., 1987. Sedimentary structure and environment evolution of submerged
delta of Changjiang river since late Pleistocene. Acta Sedimentologica Sinica 5 (105-
112) (in Chinese with English abstract).
Qin, Y., Zhao, Y., Chen, L., Zhao, S., (Eds.), 1996. Geology of the East China Sea. Science
Press. Beijing. 357pp.
Shen, Huanting and Pan, Ding’an, 1988, The characteristics of tidal current and its effects on
the channel of the Changjiang Estuary, In: Chen, Jiyu, Shen, Huanting, and Yun,
Caixing, eds. Processes of Dynamics and Geomorphology of the Changjiang
Estuary, Shanghai Scientific and Technical Publishers, 80-90 (in Chinese).
Shen, H.T., Li, J.F., Jin, Y.H., 1995. Evolution and regulation of flood channels in estuaries.
Oceanol. Limnol. Sin. 26 (1): 82-89 (in Chinese with English abstract)
Stanley, D.J., Chen, Z., 1993. Changjiang delta, eastern China: 1. Geometry and subsidence of
Holocene depocenter. Marine Geology 112, 1– 11
Wang, J., Guo, X., Xu, S., Li, C., 1981. Evolution of the Holocene Changjiang delta. Acta
Geologica Sinica 55, 67-81 (in Chinese with English abstract)
Xu, Fumin, Yan, Yixin, and Mao, Lihua, 2002, Analysis of hydrodynamic mechanics on the
change of the lower section of the Jiuduansha sandbank in the Yangtze River
Estuary, Advances in Water Science, 13(2), 166-171 (in Chinese with English
abstract).
Yang, Shilun, Yao, Yanming, and He, Songlin, 1999, Coastal profile shape and erosion-
accretion changes of the sediment island in the Changjiang River Estuary,
Oceanologia & Limnologia Sinica, 30(6), 764-769 (in Chinese with English
abstract).
Yoshiki Saito, Zuosheng Yang, Kazuaki Hori. 2001. The Huanghe (Yellow River) and
Changjiang (Yangtze River) deltas: a review on their characteristics, evolution and
sediment discharge during the Holocene. 41: 219-231
Zhang, Hongwu and Wang, Jiayin, 1987, River bend hydraulics, Yellow River Institute of
Hydraulic Research, 65-68 (in Chinese).
Hydrodynamics – Natural Water Bodies
234
Zou, Desen, 1990, The hydrodynamic and PLT in the mouth region of Yangtze River and its
training, Journal of Sediment Research, 3, 27-34 (in Chinese with English
summary).
Part 4
Multiphase Phenomena:
Air-Water Flows and Sediments