Hydrodynamics Natural Water Bodies Part 12 docx
Bạn đang xem bản rút gọn của tài liệu. Xem và tải ngay bản đầy đủ của tài liệu tại đây (3.52 MB, 25 trang )
Hydrodynamics – Natural Water Bodies
262
Straub, L.G. & Anderson, A.G. (1958). Experiments on self-aerated flow in open channels.
Journal of Hydraulic Division, ASCE Proc., v.87, n.HY7, pp. 1890-1-1890-35.
Tozzi, M.J. (1992). Caracterização/comportamento de escoamentos em vertedouros com
paramento em degraus [Characterization of flow behavior in stepped spillways].
Dr Thesis. University of São Paulo, São Paulo, Brazil, [in Portuguese]. 302 pp. Dr
Thesis – Universidade de São Paulo, São Paulo.
Wilhelms, S.C. & Gulliver, J.S. (2005). Bubbles and waves description of self-aerated
spillway flow.
Journal of Hydraulic Research, Vol. 43, No.5, pp. 522-531. 2005
Wood, I.R.; Ackers, P. & Loveless, J. (1983). General method for critical point on spillways.
Journal of Hydraulic Engineering, Vol. 109, No. 27, pp. 308-312, 1985.
Wood, I.R. (1984). Air entrainment in righ speed flows.
Symposium on scale Effects in modelling
hydraulic structures
, IAHR, Kobus, H. (Ed.), paper 4.1, Sep
13
Sediment Gravity Flows:
Study Based on Experimental Simulations
Rafael Manica
Instituto de Pesquisas Hidráulicas - Universidade Federal do Rio Grande do Sul
Brazil
1. Introduction
Gravity (or density currents) currents are a general class of flows (also known as stratified
flows) in which flow takes place because of relatively small differences in density between
two flows (Middleton, 1993). Gravity currents that are driven by gravity acting on dispersed
sediment in the flow were called sediment gravity flows (Middleton & Hampton, 1973).
Sediment gravity flows may occur in both subaerial (e.g. avalanches, pyroclastic flows and
so on) and subaqueous ambients (e.g. bottom currents, turbidity currents, debris flow – see
Simpson, 1997) and may flow above, below or inside the ambient fluid. The distinction
regarding sediment gravity flows and open-channel flows is due to the order of magnitude
of the density difference between the fluids. Sediment gravity flow are generally of the same
order of magnitude, whilst open-channel flow the difference in density between the flow
(e.g. rivers) and the ambient air is much higher than that.
The interest in these types of flows are mainly due to four factors: (i) phenomenon
comprehension highlighting the origin, transport and deposition processes; (ii) their great
magnitude and unpredictability (potential environmental hazards); (iii) the lack of
monitoring these events in nature and; (iv) because of their economic significance, since
some deposits generated by such currents are prospective reserves of hydrocarbon.
Despite the great progress addressing theoretical and analytical evaluation of these
phenomena, particularly on the origin, transport and deposition of this class of flow, even
today, they are not completely comprehended. Generally, the complexity of the
phenomenon can be expressed by: (i) interaction between the flow and the bed morphology;
(ii) the quantity and the composition of sediment transported and (iii) the complex mixing
processes. As a consequence, the origin and the hydrodynamics properties of these flows are
less understood than open-channel flows (Baas et al., 2004). Simple definitions, such as
volumetric concentrations of sediments, its composition and size distribution of solid
particles in the mixture as well as the sediment-support mechanisms are difficult to measure
in nature which is also an indicative of such complexity.
Kneller & Buckee (2000) commented that difficulties in understanding the dynamics of
suspended sediment are extremely complex by virtue of turbulence. In that case, the
phenomenon is: non-linear; non-uniform (variation in space) and unsteady (variation in
time). If the flow contains large loads of sediments and/or cohesive sediments in suspension
this complexity increases even more. Besides the variation of density with time and space
(open boundary conditions), the mechanical properties (rheology) of the suspensions
Hydrodynamics – Natural Water Bodies
264
involved (thixotropy, viscosity and gravitational forces) must be taken into account as well
as the sediment-support mechanism and the influence of shear stress on the upper layer
(Kuenen, 1950). Because of such uncertainty and complexity, many terms, concepts, models
and particular descriptions (over than 30) have being introduced and applied to interpret
these classes of flows and deposits along the years (e.g. Gani, 2004; Lowe, 1982; Middleton &
Hampton, 1973).
Sediment gravity flows can be divided into five broad categories according to Parsons et
al., (2010). Each flow type has a range of concentrations, Reynolds numbers, duration, grain
size and rheology behaviour, enclosing a general overview of the flows transformation
along time and space (Fischer, 1983). Two types of flows have been regularly studied along
the last 60 years: turbidity currents and debris flows. Both represent the contrast of the
sediment gravity flows categories (not considering mass flows, like slides and slumps - see
also Middleton & Hampton, 1973). Succinctly, the main properties attributed and well
accepted in the literature to turbidity currents are: diluted (low-density), Newtonian
behaviour, turbulent regime, and Bouma sequence type deposit (Bouma, 1962) usually
called turbidites. On the other side, debris flows are characterized by great influence of non-
cohesive material, non-Newtonian behaviour, matrix strength, bipartite and chaotic
(ungraded) deposits.
The interest of many fields of academy and industry do not only concern the comprehension
of those two particular types of flows. In fact, all classes of sedimentary gravity currents are
motivating researchers to face the problem from different approaches and methods, for
instance: studies based on outcrops analogy (generally by sedimentologists and correlated
areas); numerical and analytical modelling (which is improving through time) and, finally
experimental simulation which has been a powerful tool of visualization and measurement
of flow dynamics properties as well as of generated deposit.
The scope of this chapter is to outline the experimental study on sediment gravity flows in
order to characterize and comprehend this phenomenon regarding their rheological
behaviour, hydrodynamics and depositional properties. The simulations covered a wide
range of concentration and/or different amount of cohesive sediments in the mixture. The
properties of the flow and deposit were evaluated, classified and compared to literature
background. The chapter is structured in five sections; first, a general description of
sediment gravity flows will be presented followed by the experimental approach applied.
Then, the rheology tests it will be reported and finally, the careful evaluation of the
experimental results in terms of time-space and vertical profiles will be described in order to
extrapolate the results to natural sediment gravity flows.
1.1 Sediment gravity flow anatomy
In nature, subaqueous sediment gravity flow behaves like a river system, i.e., originating
(source zone), flowing (transfer zone) and decelerating up to the point where all suspended
sediment settled down (depositional zone). In general, the initiation of sediment gravity
flows is strongly related to two processes of sediment remobilization in the natural field:
Firstly, by the occurrence of catastrophic events such as earthquakes, sedimentary failures,
storms and volcanic eruptions which cause high instabilities and remobilize large amount of
sediments instantaneously (Normark & Piper, 1991); Secondly, by continuous river supply
in which the river discharge is connected into water body (usually reservoirs, lakes and
oceans) generating plumes and/or hyperpycnal flows due the density difference (positive or
negative). After the process starts, the mixture of suspended sediment (concentration, size
Sediment Gravity Flows: Study Based on Experimental Simulations
265
and composition) is transported ahead by the flow (transfer zone). Concomitantly,
dynamical and depositional processes occur along time and space, causing flow
transformations, such as: sediment transport, erosion and/or deposition, mixing,
entrainment (Elisson & Turner, 1959) and so on (Fig. 1).
The sediment gravity flows which maintain buoyancy flux throughout movement are called
conservative (i.e. do not interact with their boundary). Otherwise, flows are called non-
conservative sediment gravity flows (i.e. open boundary interaction such as erosion and
deposition).
Generally, gravity currents are divided geometrically into three distinct parts: head, body
and, tail.
Fig. 1. Schematic of a sediment gravity flow (description of all terms is provided in the list of
nomenclature).
The head or front of the current is roughly shaped as a semielipse. In most cases, the head is
thicker than the body and tail, because of the resistance imposed by the ambient fluid (fluid
resistance) to its advance. The head plays an important role on flow dynamics because is
characterized by strong three-dimensionality effects and intense mixing (Simpson, 1997).
The most advanced point of the front is called nose and it is located slightly above the
bottom surface, as a result of the no-slip condition at the bottom as well as the resistance
(shear) at upper surface (Britter & Simpson, 1978). In the head, two types of instabilities are
the main responsible for mixing with the ambient fluid (entrainment). The first type of
instability is a complex pattern of lobes and clefts caused by second order gravitational
instabilities at front surface (Kneller et al., 1999; Simpson, 1972). The second type of
instability is a series of billows associate to Kelvin-Helmholtz instabilities (Britter &
Simpson, 1978), which takes place just behind the head and produced by viscous shear at
the head and body (upper surface). This zone behind head creates a large-scale turbulence
mixing and also divides the head from the body (symbolically called: neck of the flow).
Generally, the velocity of the body is greater than the head velocity by 30% or 40% (Baas et
al., 2004; Kneller & Buckee, 2000). One reason for this is the presence of a large billow
behind the head which cause a locally diluted zone (entrainment of ambient fluid). Thus, in
order to the flow maintain its constant rate of advance, the current increases the velocity of
the body to compensate the deficit of density created (Middleton, 1993). The body is divided
into two zones: near the bottom zone, where the density is higher; and above this, a
suspended/mixing zone, where the mixing with the fluid ambient occurs. The interface
Hydrodynamics – Natural Water Bodies
266
between these layers (bipartite flow) point out a discontinuity in the body (water-column
stratification) that is reflected by an abrupt gradient of velocity, concentration and
viscosity (Postma et al., 1988).
The third part of sediment gravity flow is characterized by a deceleration zone and final
dilution stage of the current, normally called tail.
In terms of dynamics properties of the flow, sediment gravity flows differ significantly from
open-channel flows (e.g. rivers) regarding their velocity profile. In that case of sediment
gravity flow, the main difference is due to the fact that is not possible to ignore the shear
effects in the upper surface of the current (see Fig. 2 a, b). Then, the sediment gravity flows
velocity profile has null values at the upper and bottom surfaces and values grow towards
to the middle (balance of drag forces acting on those surfaces), creating a front point
(maximum value) usually at 0.2 to 0.3 times the height of the current. Depending on the
concentration and composition of sediments in suspension, both velocity and concentration
profiles may present completely different shape (Fig. 2 c) as the inner dynamic of the flow
became more complex (e.g. matrix strength, cohesive forces).
Fig. 2. Vertical profiles of velocity, concentration and shear stress for: a) open-channel flows;
b) turbidity current and; c) debris Flow.
The two most known classes of sedimentary gravity flows (described earlier) have
differences regarding their internal dynamics. The dynamics of turbidity currents is complex
due to the processes of erosion and deposition. Because of this, the three-dimensional
representation of this phenomenon through analytical equations is not simple, which leads
to simplification (e.g. shallow water flows – Parson et al., 2010; Parker et al., 1986). In the
same way, the debris flows are extremely complex too, as the existence of yield strength
caused by the high density and the presence of clay implies in shear-like flow and plug-like
flows as illustrated in Fig. 3.
Generally, the hydrodynamic of a sediment gravity flow is closely associated to sediment-
transport capacity (total amount of sediment transported by the flow) and competence (ability
of the flow to carry particular grain size) as well as to the sediment-support mechanism,
whose the main role is to keep the sediments in suspension for a long period of time (and
distance). For each class of flow may occur different mechanisms of sediment-support, as it
depends on grain-size and composition, concentration of sediments and the rheological
properties of the mixture.
For turbidity currents, the main sediment-support mechanisms are vertical component of
turbulence and buoyancy. However, for flows of high concentration (high-density) several
Sediment Gravity Flows: Study Based on Experimental Simulations
267
sediment-support mechanisms may occur simultaneously, such as: hindered settling, in
which grains deposition is inhibited because the number of particles increases in an certain
zone, creating a slower-moving mixture than would normally be expected (effect of
population of grains); dispersive pressure: in which the grains are held in suspension by their
interaction forces (collision) and; matrix strength: a mixture of interstitial fluid and fine
sediment (cohesive), which has a finite yield strength that supports coarse grains (Lowe,
1979; Middleton & Hampton, 1973).
Fig. 3. The difference between the internal dynamics of the turbidity current (a) and debris
flow (b).
The effect of high concentration on the dynamics of sediment gravity flows is expressed by
changes in the mixture and flow properties such as: density of the fluid; increase of the
potential energy and momentum of the flow and; viscosity of the mixture (rheological
behaviour). Also, the settling velocity of particles is strongly influenced by the increase in
fluid concentration mainly because: the fall of the particles induces an upward movement of
water; the buoyancy of the particle increases due to high-density fluid, and by the
interaction between particles (effect of population - hindered settling). The transport capacity
of the flow tends to increase with high sediment concentration; however, these changes also
depend on the composition of sediment present in suspension.
In contrast, the presence of cohesive sediment implies a different scenario in which the flocs of
cohesive particles will settle down during the flow, creating a clay/mud near-bed layer with
high content of water inside. Despite the fact the turbulence can be produced in this clay/mud
layer (due to shear flow), there is also a significant increase in viscous forces (non-Newtonian
behaviour), which could reduced the flow ability to transport great amounts of sediment
downstream.
2. Apparatus and experimental simulations
In order to understand the hydrodynamic of natural sediment gravity, an experimental
study was performed with different types of sediments, such as: non-cohesive particles
Hydrodynamics – Natural Water Bodies
268
represented by very fine sand and silt sized glass beads, and cohesive particles represented
by kaolin clay. Both sediments have density approximately of 2600 kg/m³. In total, 21
experiments (Fig. 4) were carried out with eight values of bulk volumetric
concentration (2.5%, 5%, 10%, 15%, 20%, 25%, 30% and 35%). In addition, for each value of
concentration were used three different proportions of clay in the mixture from 0% (pure
non-cohesive flows) passing to 50% (mixed) and finally, 100% (pure cohesive flows).
Fig. 4. Initial properties of the mixtures simulated and the particles properties.
The experiments were performed in a 2D Perspex tank (4.50 m long x 0.20 m wide x 0.50 m
height). A 120 litres mixture was prepared in a mixing box (full capacity of 165 litres)
connected at the upstream part of the tank through a removable lock-gate (0.21 m wide and
0.70 m high). An electric-mechanical mixer was installed within that box to assure the full
mixing of sediment mixture. The tank also had a dispersion zone (approximately 1.00 m
length) in which the water (and flow) were drained after the experiment.
In all sets of experiments were used lock-exchange methodology characterized by the
instantaneously release of the mixture (lock-gate opening) reproducing a catastrophic event
on nature. As soon as the mixture entered into the channel, the dense flow was generated.
In order to measure the flow properties during the experiments, a group of equipments was
installed within the tank. Four UHCM’s (Ultrasonic High-Concentration Meter) were set along
the vertical profile (at 1.0; 3.2; 6.4 and 10 cm from the bottom) to acquire time-series
concentration data, whilst ten UVP’s (Ultrasonic Doppler Velocity Profiler) of 2 MHz
transducers were set along vertical profile (15 cm) to register time-series of velocity data.
Both equipments were located at 340 cm from the gate. With both velocity and concentration
data, the hydrodynamic properties were established for all flows such as: time series of
velocity and concentration, mean vertical profiles, non-dimensional parameters for the head,
body and tail zones.
Sediment Gravity Flows: Study Based on Experimental Simulations
269
Additionally, all flows were recorded with a digital video-camera placed on the side of the
tank in order to evaluate the time series of geometric features of the current (see Fig. 1), such
as: the current height (h
t
); thickness of the body (h
b
) defined as the height of the body not
considering the mixing zone at the upper surface and; thickness of the internal layer (h
i
), which
considers the interface layer created by the presence of a more concentrated zone near the
bottom. The depositional properties (e.g. deposition rate) were also evaluated through the
video images.
After the experiment, the ambient fluid was slowly drained and the final deposit properties
(e.g. thickness, grain-size and mass balance) were measured (and/or sampled).
3. Rheology of mixtures
The rheology is the study of deformation and flow of matter and is a property of the fluid
that expresses its behaviour under an applied shear stress. Through the rheological
characterization of mixtures (water and sediment), it is possible to establish the relationship
between shear stress and strain rate (shear rate), and consequently the coefficient of
dynamic viscosity (and/or apparent) as well as the constitutive equations in terms of
volumetric concentration and presence of clay.
In natural flows, the non-conservative condition of the sediment gravity flows, i.e. erosion
and deposition during the movement, modifies the mechanisms of transport and deposition
of particles within the flow (e.g. local concentration, size and composition of grains in
suspension), which impact also their rheological behaviour.
Based on this, a rheological characterization of mixtures was carried out aiming to establish
such property of the mixtures and verify its behaviour for different initial conditions. To do
that, it was used a Rheometer device with two types of spindle (cone plate and parallel
plate). For the tests, the mixtures were prepared following the same proportions of sediment
used in the experimental work and also considering the same temperature (~ 19°C). The
rheogram - output data of the Rheometer consisting in the ratio of shear stress and strain
rate - was compared to typical rheological models found in literature. The simplest
rheological model of imposed stress (
x
) related to strain rate (u/z) is the Newtonian model
(due to the definition of Newton's law of viscosity) and it can be expressed for two-
dimensional flow in the x – z plane as:
x
u
z
(1)
The equation (1) shows a linear relationship between the imposed shear stress and strain
rate (gradient of deformation). As a consequence, the viscosity of the fluid or
mixture (coefficient of dynamic viscosity -
) is constant for all values of shear rate. Any
deviation from linearity between the stress-strain curve converts the rheological property to
non-Newtonian behaviours, which can be generally divided into four more groups: plastics
in which there is no deformation of the flow until the critical initial stress (yield strength -
0
)
is overcome; dilatant and pseudoplastic, in which the deformation (strain rate) is expressed by
a power law type (if coefficient of power law n > 1 then the fluid is dilatant otherwise (n < 1)
is pseudoplastic) and; Herschel-Bulkley in which the fluids has a plastic behaviour (yield
strength -
0
) followed by a power law behaviour. The Herschel-Bulkley model can be
expressed for two-dimensional flow in the x – z plane as:
Hydrodynamics – Natural Water Bodies
270
0
n
ap
u
K
z
(2)
To non-Newtonian mixtures, the determination of viscosity (curve slope at the rheogram) is
no longer direct, implying that for each value of gradient of deformation (strain rate)
applied, there will be a different coefficient of dynamic viscosity. When this occurs, the
viscosity is called apparent viscosity of the fluid (
ap
) rather than the dynamic viscosity.
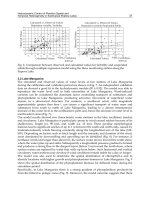
From the results obtained with the rheometry tests, it was defined two distinct groups for
the mixtures simulated in terms of different values of concentration and clay content: the
Newtonian group of mixtures and the Herschel-Bulkley plastic group of mixtures (Fig. 5).
Fig. 5. Rheological characterization of the mixtures simulated and the constitutive equations
in terms of volumetric concentration and presence of clay for each group.
For the group of Newtonian mixtures (above threshold line) it was possible to establish an
empirical relationship (linear) between the values of dynamic viscosity with the volumetric
concentration and clay presence, which allows properly assess the effect of viscosity on the
hydrodynamic parameters for this group of mixtures (eq. 3). The coefficient values were
similar to those found in literature for non-cohesive grain mixtures (e.g. Coussot, 1997;
Einstein, 1906). The rheological characterization was carried out to the volumetric
concentration of 35% only. Extrapolation to higher values must be handled carefully (see
Coussot, 1997; Wan & Wang, 1994).
Sediment Gravity Flows: Study Based on Experimental Simulations
271
0
1 2 24 0 44
vol
C Clay %
(3)
The threshold line represents the transition from Newtonian to non-Newtonian
behaviour (plastic) and can be represented by the occurrence of yield strength. Clearly, there
is not a unique value representing this change of rheological behaviour. A transition interval
must be considered (dashed line around the threshold) to more accurate analysis. In
addition, different composition of clay may move the position of the curve, for instance; the
threshold of montmorillonite shows similar shape. However this curve of yield strength
(high values for this particular type of clay) is moved into the top-left of the diagram.
For the group of Herschel-Bulkley plastic mixtures (high concentration and more presence
of clay - below the threshold line) the constitutive equations were empirically determined
(eq. 4, 5) correlating the apparent viscosity, the clay content in the mixture, the bulk
concentration of the mixtures and, the gradient of deformation (strain rate) for this group of
mixtures.
024 18
31
0
139
vol
vol
C
ap
C
cla
y
u
e C
z
.
(4)
where
059
87
0 0016
Cla
y
Clay
clay
u
C e
z
.%
.%
.
(5)
It was also established an empirical relationship to yield strength in terms of the volumetric
concentration and the presence of clay in the mixture.
2790
0 00104
vol
%Clay C
i
e.
(6)
4. Experimental results
The rheological characterization (rheometry) has classified the mixtures into two distinct
groups as it was illustrated in Fig. 5. Based on that approach, all data and results obtained
through experimental work were compared in order to establish groups with similar
properties. A total of 15 parameters divided into seven categories were used to fully
characterize and distinguish each group: geometry, rheology, analysis of mean vertical
profiles, time-series of data, internal dynamics of the flow, depositional features and, non-
dimensional parameters as seen in Fig. 6.
After applying this method of analysis, it was possible to identify six regions (or groups) of
similar sediment gravity flows generated experimentally. Each one has typical properties
and characteristics in terms of rheology, geometry, hydrodynamic and depositional
processes along time and space. Moreover, the relationship with initial properties
(concentration and clay content) demonstrates the cause-consequence of the experiments
(from source to deposit) and the entire dynamic involved. The Fig. 7 illustrates this diagram-
phase with delimited boundaries amongst the regions.
Each region properties will be completely described below from non-cohesive dominated
flows (regions I, II and III) to cohesive dominated flows (regions IV, V and VI). The
averaged vertical profiles will be discussed apart (item 4.6).
Hydrodynamics – Natural Water Bodies
272
Fig. 6. Results obtained through the experimental simulations
Sediment Gravity Flows: Study Based on Experimental Simulations
273
Fig. 7. Six regions (or groups) of similar sediment gravity flows generated experimentally
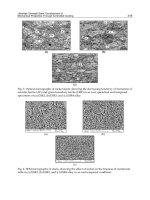
4.1 Region I - Turbidity currents like sediment gravity flows
Sediment gravity flows generated considering the properties of the region I (Newtonian,
low-volumetric concentration (< 5%) regardless of the amount of clay) reproduces a classic
behaviour of turbidity currents widely discussed in the literature (Kneller & Buckee, 2000;
Middleton, 1966; Simpson, 1997). The current accelerates (waxing flow – Kneller, 1995) due
to the buoyancy flux with clearly defined head at the front. The thickness of the head is
greater than the body, indicating the flow undergoes a large resistance of the ambient fluid
and also from gravitational forces acting over the body. As consequence, a large billow
(shear vortex) takes place behind the head (high mixing zone).
The body presents the peak of velocity and after this point the flow starts to decelerate
gradually (waning flows - Kneller, 1995). Concomitantly, the concentration of sediment
within the flow follows the velocity behaviour. In the head, sediments are held in
suspension by virtue of the high-turbulence intensity (no depositional zone) and then, the
suspended sediments start to settle (fall out) with the decrease in velocity. The current
becomes diluted and finally there is only the sedimentation of finer particles by
decantation (very long time for cohesive particles because of low settling velocity).
In these currents the main mechanism of grain support is turbulence (inertial forces) with
high Reynolds numbers along the entire current (despite the low concentration of mixtures)
except for the final stages of the flow (tail). The evaluation of the turbulent intensity (root
mean square - RMS) shows that turbulence occurs mainly in the head and particularly in the
vortex generated behind the head whilst in the body, turbulence occurs around shear layer
(mixing zone). Along the vertical profile there was absence of high RMS values near the
Hydrodynamics – Natural Water Bodies
274
bottom, which may explain the initiation of the deposition just after the passage of the front.
For the flows of this region, the presence of cohesive sediments at low concentrations (< 5%)
implies in no significant changes on the flow behaviour.
During the flow movement, the main mechanism of deposition was by individual particles
(grain-to-grain) falling out from suspension by gravity (decelerating flow). Consequently,
the dissipation of turbulence caused the lost of sediment-transport capacity of the flow and
the grains segregated naturally, i.e. the coarse grains (high setting velocity) were deposited
first followed by fine grains and then by colloidal particles (after the stop indeed). As a
result, the deposits generated normal gradation (decreasing mean grain size towards to the
top - fining upward). For the flows containing clay in suspension, the deposit is
characterized by a non-cohesive layer of grains near the bottom with a layer of clay (as a
resulted of settling) at the top. The contact between the non-cohesive and cohesive grains is
very sharp, clearly indicating different stages of deposition. Despite the fact that clay may
form flocs, due to the cohesion of their particles, there was no evidence of the formation of
large flocs. The depositional rate for this class of flows was linear (deposit thickness
increased at constant rate) starting just after the passage of the head.
4.2 Region II
The Newtonian sediment gravity flows originated by the increase in concentration and the
presence of clay (around 50%) showed differences in the properties of the flow dynamics
and deposition. Both velocity and buoyancy flux increased in the flow causing a decreased
in the head height. As a result, the average velocities of the body and head were almost
identical, showing that buoyancy forces present in the head are in balance with gravitational
forces. Yet, the head of the current is slightly higher then the body and is characterized by
intense mixing zone. The main difference comparing with region I can be noticed after the
peak of velocity in the body, since the flow rapidly decelerates reaching low values of
velocity until completely stopped (tail). The quick deceleration is related to formation of an
inner layer of grains more concentrated near the bottom. For a short time the flow becomes
stratified (bipartite) changing the velocity and concentration profile instantly and implying
in different mechanisms of deposition.
The sediment-support mechanism of the non-cohesive flows (low content of clay) is driven
by the turbulence of the flow (in the head), Kelvin-Helmholtz instabilities behind the head
and along the mixture layer at the upper and the bottom surfaces. The high values of
turbulence intensity were measured throughout vertical profile explaining a period of no
deposition at early stages of the flow. Also, the concentrated near-bed layer (mainly non-
cohesive) is characterized by high turbulence intensity and its internal undulations are
closely related to instabilities at the upper surface.
The flows generated from experiments adjacent to rheological threshold in Fig. (7), the
increase of amount of clay and/or concentration caused a decrease in turbulence intensity.
Also, not only the turbulence plays a key role on these flows but also the influence of the
matrix strength and cohesive interaction of the grains started to become relatively
significant. This fact is reflected on the behaviour of near-bed layer (mainly cohesive) which
is characterized by undulations and deformations, although not as considerable as those
presented by pure non-cohesive flows.
The mechanism of deposition in such flows differs from region I. Besides the grain-to-grain
sedimentation caused by dissipation of the turbulence intensity (typical behaviour of flows
Sediment Gravity Flows: Study Based on Experimental Simulations
275
next to boundary between regions I and II), other depositional processes start to play in the
flows regarding the amount of clay in the mixture.
In non-cohesive flows, the sediment in suspension settled down creating a concentrated
near-bed layer that was constantly fed by sediments from the top (fall out). As consequence,
the space between grains became more restricted causing rapid deposition of sediments
(high depositional rate in the first stages of the flow where there was insufficient time for the
natural segregation of the grains). Hence, the deposit generated partially graded beds, i.e.,
massive (coarse size) deposits at the bottom followed by fining upwards particles on the top
(final stages of flow with low depositional rate).
Despite the presence of clay in the mixtures gives the impression to modify the mechanism of
deposition of these currents, again, for this group of experiments the deposits show a clear
division between the non-cohesive grains (at the bottom) and cohesive grains (at the top).
4.3 Region III
The region III corresponds to Newtonian flows with high-concentration and low presence of
clay (up to maximum of 20%). The hydrodynamics followed the processes described before
(region II), considering the higher values of velocity (amongst all regions) and also the flux
of buoyancy, which does not allow the grains settled down in the early stages of the flow.
The magnitude of forces acting over the head (mainly buoyancy) and over the body (mainly
gravitational) was similar reducing the head height. Once more the flow generates a very
wavy concentrated layer close to the bottom, creating a bipartite flow which caused sudden
deposition (high-depositional rate) of large amount of sediments. Then, the diluted current
flows over the bed previously deposited (low-depositional rate).
The support mechanism of grain in these flows is basically turbulence generated at the head
(high values of RMS) as well as the upper and lower surfaces. However, additional
sediment-support mechanisms as hindered settling and dispersive pressure may occur
within the concentrated near-bed layer (mainly non-cohesive). On the other side, the
mechanism of deposition for these flows represents an evolution of the processes described
in region II. Since the suspended load of sediment becomes progressively concentrated
towards the bottom, the continuous supply of the grain from the top (fall out) compress the
inner layer reducing space for grains to move. At this point, there is a rapid deposition of
grains. This process may be a first signal of frictional freezing, where non-cohesive grains
settle quickly (collapse) without segregating grains by size. As a result, deposit is partially
graded; being massive graded near the bottom and normally graded (fining upward) on the
top.
4.4 Region IV
The flows classified as region IV are non-Newtonian, which consequently leads to changes
in hydrodynamic properties, such as sediment-support mechanism and depositional
processes, mainly because of the yield strength.
In this class of flows dominated by cohesive particles, the hydrodynamic processes are
closely related to the region II. The head of the current is the local of high velocity, turbulent
intensity and mixing, whilst the viscous forces play a significant role on the body causing
deceleration and then, the early stage of deposition. It was also verified the formation of a
concentrated layer (mainly dominated by clay) at the bottom. The presence of this
deformable clay/mud near-bed layer is followed by a constant value of inner concentration.
Hydrodynamics – Natural Water Bodies
276
The sediment-support mechanism is influenced by the content of clay once the turbulence is
damped within the current (being only verified in the head of the flow). The cohesive matrix
begins to act internally changing the hydrodynamic behaviour of the current. The buoyancy
of the interstitial fluid (water and clay) and pore-pressure also contribute to keep the grains
in suspension inside the clay/mud near-bed. This behaviour differs from Newtonian non-
cohesive flows (regions II and III). In region IV, the concentration has not yet reached the
gelling concentration for cohesive mixtures (Winterwerp, 2002).
During the flow, it was possible clearly identify the shear-like flow near the bed and plug-
like flow above that, which is dominated by viscous forces acting on the flow. However, the
flow can not be classified as completely laminar, since spots of turbulence (high intensity)
can be generated within this layer. Also, in the plug-like flow, fluid shear stress is lower
than yield strength of the mixture, generating an instantaneously mass deposit (cohesive
freezing). As it occurs suddenly, there is no segregation (selection) of the grains. On the
other side, the shear stress at the bed is higher enough to allow the settled of non-cohesive
sediments. As a result, the final deposit is divided into three distinct depositional layers:
low-content clay (~ 5%) bottom layer (shear-like flow); an intermediate ungraded matrix of
sand and clay/mud layer (plug-like flow) and; a clay dominant layer on the top (tail and
settling deposition).
4.5 Region V and Region VI - Debris flow like sediment gravity flow
Regions V and VI have very similar behaviour with high concentration and high amount of
cohesive material (Herschel-Bulkley rheological model). This region represents the other
extreme of sediment gravity flows evolution and their transformations.
The hydrodynamic of the current was influenced by the clay content presenting a strong
waxing flow-phase (high-turbulence intensity only at the head) and abrupt deceleration,
after the arrival of deformable clay/mud near-bed layer (for Region V) and practically not
undulating/deformable (for region VI). The plug-like flow in the body induced cohesive
freezing, in which a large amount of sediments are deposited in few seconds (high-
depositional rate). In this region, the content of clay in the mixture at high concentrations is
influenced by the gelling concentration. According to the literature, this occurs at
concentrations of clay between 80 and 180 g/l, equivalent to a solid volume fraction of 0.03
and 0.07 (Whitehouse et al., 2000; Winterwerp, 2001, 2002). The mixtures simulated in the
regions V and VI correspond to this range of values. Therefore, the cohesive forces acting on
these deposits are transmitted to all mass deposited and not only to each single particle
causing a thick ungraded chaotic deposit.
The sediment-support mechanism is highly influenced by the increased of apparent viscosity
of the mixture and matrix strength which is induced by electrostatic interactions of clay
particles. Thus, turbulence is damped throughout the flow, with local spots of high-turbulence
intensity close to the bottom (high values), as well as at the interface between the deposit
generated by clay/mud near-bed layer and the remaining flow (body and tail). This final stage
of the flow generates a normally graded deposit (coarse-tail grading on the top) associated to
the mechanism of deposition described in the region I (turbidity currents like flows).
4.6 Mean vertical profiles
Based on the experimental results, Fig. (8) illustrated the idealized pattern for each region
concerning the average velocity, concentration and sediment flux vertical profiles.
Sediment Gravity Flows: Study Based on Experimental Simulations
277
Fig. 8. Mean vertical profiles of velocity, concentration and sediment flux for the six regions
of sediment gravy flows.
4.6.1 Velocity profiles
Concerning the flows classified as Newtonian (regions I, II and III), the velocity profile
presented the classical behaviour of turbidity current (see description section 1.1) with a
maximum velocity point located at some distance from the bottom and two distinct zones:
an inner zone near the wall and an outer zone up to the top surface (Fig 8, top-left).
Applying the model developed by Michon et al., (1955) and modified by Altinakar, (1988) it
was possible to establish analytical equations for non-dimensional velocity profiles in terms
of initial concentration of the flow.
The model consists in a relationship between a non-dimensional velocity and geometry
parameters and also separates the velocity profile in two zones (the threshold is height of
maximum velocity - h
m
). The equations below present the results of applied methodology
for the inner zone (z < h
m
) including the parameters fitted for this group of experiments.
0.4
uz
=
Uh
max max
(7)
And for the outer zone (z > h
m
) is,
19
27
m
tm
zh
hh
u
e
U
.
.
max
(8)
Those equations can be applied to a wider range of currents with different behaviours as the
first approximation of the non-dimensional velocity profile for Newtonian sediment gravity
Hydrodynamics – Natural Water Bodies
278
flows. However, in order to extrapolate the results to natural fields, it must take into
consideration the maximum velocity value and its location within the current.
For the flows classified as non-Newtonian (regions IV, V and V) the velocity profile
changes drastically and can be divided in four zones (Fig. 8 top-right): the shear-like flow
zone (near the bottom), strongly influenced by viscous sublayer; the plug-like flow zone:
occurs when the value of the shear stress is lower than yield strength; and the other two
zones from the remaining diluted current (similar to Newtonian flows described above).
The first two zones involve the evaluation of the shear stress at the wall (viscous sublayer)
and the thickness of the plug. For the last two zones above the plug-like flow the model
of Michon et al., (1955) can be adjusted adding the plug-like flow velocity and its
thickness.
The velocity profiles measured for the high-density currents were similar to those cited by
(McCave & Jones, 1988; Postma et al., 1988, Talling et al., 2007). To express these profiles
in terms of equations require a detailed analysis of stress distribution along the vertical
profiles (to establish the shear zone and plug zone) as well as the estimative of the
thickness of the near–bed layer (inner flow). In nature those parameters are not easily
estimated. The detailed evaluation of these parameters can be found in Manica, (2009).
4.6.2 Concentration profile
The mean concentration profile measured in the experiments show the transition between
the six regions of sediment gravity flows (Fig. 8). For flows classified as
Newtonian (regions I, II and III) the profile is practically more invariable along the
vertical (region I) with a slight increase (creating an inflexion point) at the concentration
values near the bottom. The curve is similar to an exponential trend (regions II and III),
corresponding typical profiles of open-channel flows (e.g. rivers). An empirical
exponential law can be fit in such type of curves considering non-dimensional parameters
defined as: local concentration divided by concentration measured at 5% of the total
height of the flow (concentration of reference – C
r
); and the distance from the bottom
divided by total height of the current (z/h
t
). The equation fitted for the experimental
results is expressed by
40
122
t
z
h
r
Cz
e
C
.
()
.
(9)
Considering the non-Newtonian sedimentary gravity flows (regions IV, V and VI), the
vertical profile of concentrations is strongly influenced by the clay/mud inner layer, which
generates high-levels of concentration and, practically stratified the profile into two regions
(threshold is the inner layer thickness – see Fig. 1). In terms of analytical adjustment of these
peculiar curves, the definition of this threshold point is crucial, once it can be presumed for
z < h
i
that concentration assumes the value of concentration of reference. Above the
clay/mud inner layer, equation (9) can be applied.
The methodology presented here to obtain the non-dimensional concentration profiles
(Fig. 9) was straightforward in order to simplify at maximum the input parameters.
Methodologies found in literature such as (Graf & Altinakar, 1998, Parker et al., 1987) were
tested and applied showing very similar results.
Sediment Gravity Flows: Study Based on Experimental Simulations
279
Fig. 9. Concentration profiles measured and fitted curves for the two groups of sediment
gravity flows simulated: a) regions I, II and III; b) regions IV, V and VI.
4.6.3 Reduced Flux of Sediment
The evaluation of the reduced flux of sediments gives the idea of the mass conservation
during the flow, since velocity, concentration and, initial properties of the flow (reduced
gravity) are taken into account (eq. 10). Through the evaluation of this parameter, it is
possible to check which zone within the flow the sediments are being transported as seen in
the experimentally-derived profiles in Fig. 8.
ma
Flux vol mean mean
a
Sg Chu
(10)
The differences among all classes of sedimentary gravity flows simulated were evidenced,
particularly, the influence of the cohesive particles (non-Newtonian regions), which
implying in a great amount of sediments at the bottom of the current.
5. Spatial evolution of the sediment gravity flows
The limitations of the simulations in terms of the length of the tank do not allow a complete
study on spatial variability of the sediment gravity flows from their origin to the final
deposit. Nonetheless, the full characterization of the main parameters involved in the flow
such as time series, vertical profiles, rheology, deposition and so on, may be applied in order
to extrapolate the results to natural ambient. Based on that, a detailed spatial analysis was
accomplished and the flow evolution for each region will be described below.
Concerning the flows from regions I and II, both concentration and presence of clay
increased sediment capacity of transport of the flow, indicating the current could flow
further. At the early stages (near the source) the gravity flow is more concentrated with high
buoyancy flux and high-turbulence. As the flow propagates downstream, the hydrodynamic
Hydrodynamics – Natural Water Bodies
280
processes (e.g. entrainment of ambient water at the upper surface) and depositional
processes (e.g. deposition of sediment over time and space) take place, transforming the
inner properties of the flow. As a result, the current become more diluted due to
deceleration of the flow, losing their capacity of transport (grains settled down) and then,
tend to stop. The final deposit shows coarse grains in the proximal areas, due to deposition
by gravity (high-settling velocity) and a gradually grain size thinning towards to
downstream (low-settling velocity). The Fig. 10 illustrates a model of propagation for flows
from region I to region II, also considering their transition points.
Fig. 10. Spatial evolution scheme of the sediment gravity flow for regions I and II.
In the flows characterized by high concentration and high content of clay (regions II and III)
the hydrodynamic properties of the flow change during the run by virtue of the presence of
concentrated near-bed layer. The suspended sediment rapidly settled down after the
formation of this concentrated layer, causing a reduction in buoyancy flux. As consequence,
the remaining diluted current is not able to travel further. This process occurs mainly in the
proximal and intermediate zones, where the final deposit is, basically, massive graded. After
this zone, the deposits were mainly generated by settling of the grains (gravity) up to distal
zone (Fig. 11).
The spatial evolution of the deposit for non-Newtonian mixtures (regions IV, V and VI)
showed a distinct behaviour. The increase of flow sediment capacity of transport by reason
of high concentration and high presence of clay was counter-balanced by viscous forces,
which dominated the flow dynamics and consequently, the generation of the clay/mud
near-bed layer. Thus, the bulk of sediment from regions IV, V and VI was not able to travel
long distances. Within the plug-like flow, the shear stress of the flow was not enough to
prevail over the yield strength of the mixture. As a result, the deposit showed a great
quantity of sediment in the proximal zone, whilst only a remaining diluted current flows
(with more fine particles) moving to distal zones. The Fig. 12 illustrates this idealized model.
The main difference between the idealized transition models of evolution to non-Newtonian
sediment gravity flow regards the dynamic of the clay/mud near-bed layer and the final
Sediment Gravity Flows: Study Based on Experimental Simulations
281
deposit. From region IV to V, a concentrated inner layer presents a high deformation and
undulation over time, with a shear–like flow near the bottom and a plug-like flow above
(generating the three layer deposit commented on section 4.4). On the other side, from
region V to VI (Fig. 13), the near-bed layer is practically a solid mass of mixture flowing
downstream, generating a thick clay/muddy deposit at proximal zone.
Fig. 11. Spatial evolution scheme of the sediment gravity flow for regions II and III.
Fig. 12. Spatial evolution scheme of the sediment gravity flow for regions VI and V
Hydrodynamics – Natural Water Bodies
282
Fig. 13. Spatial evolution scheme of the sediment gravity flow for regions V and VI
6. Conclusion
This chapter presented an experimental study of sediment gravity flows in which six types
of flows were distinguished based on a comparison of hydrodynamic, depositional and
rheological properties. A phase diagram was created, showing the boundaries between
these flow types in terms of rheological behaviour, bulk volumetric concentration and clay
concentration. The main characteristics of the flow types are summarized below:
Type I: Low density flow; Newtonian; grains supported by upward component of
turbulence; no hindered settling; segregation of grains and normally graded beds; Type II:
Newtonian; grains supported by turbulence; turbulent flow with gently undulating high-
concentration near-bed layer; partial hindered settling and partial size segregation forming
partially graded beds; Type III: Newtonian; fully turbulent flow with strongly undulating
high-concentration near-bed layer; hindered settling resulting in rapid deposition and
generation of partially graded beds; Type IV: non-Newtonian (plastic); viscous flow;
formation of plug and shear flow (mud layer close the bottom); viscous forces cause freezing
of the flow and forming graded beds of muddy sand and; Types V and VI: non-Newtonian
(plastic); viscous flow with thick mud layer; grain support by matrix strength; weakly
undulating internal mud layer (type VI show no undulations); cohesive freezing forms an
ungraded muddy sand with coarse-tail grading on top.
The six types of flow/deposits classified represent the transition between the two most
known types of sedimentary gravity flows: from turbidity currents (low-concentration, low
clay and Newtonian behaviour) to debris flow (high-concentration and high clay content
and non-Newtonian behaviour). The experimental study allows the comparison and
extrapolation of the results obtained from physical model to natural environments.
However it must be considered the experimental simplifications adopted. Apart from that,
the rheological properties of mixtures and some hydrodynamic (e.g. cohesion effects) and
depositional (e.g. settling velocity) properties are scale-independent and can be applied for
further interpretation.
Sediment Gravity Flows: Study Based on Experimental Simulations
283
The experiments simulated a single catastrophic event and do not consider a continuous
sediment supply from rivers (for instance, plumes and hyperpycnal flows among others)
which can change some properties of the flow along time and space. Moreover, the limit of
maximum value of volumetric concentration was 35% by volume. In this case, regions III
(see Amy et al., 2006) and region VI (see e.g. Hampton, 1972; Ilstad et al., 2004; Marr et al.,
2001; Mohrig et al., 1999; Mohrig & Marr, 2003) were left with an open boundary to further
experiments and perhaps the creation of a complementary experimental-derived
classification of sediment gravity flows.
7. Nomenclature
%Clay clay content in the mixture (%)
C
r
concentration of reference (%)
C
vol
volumetric concentration (%)
C(z) volumetric concentration at the point z (%),
∂u/∂z strain rate (1/s)
g acceleration of gravity (m/s²)
h
b
body height (m),
h
h
head height (m),
h
i
inner layer thickness (m),
h
m
height of the point of maximum velocity (m),
h
mean
mean current height (m),
h
t
or H overall height of the current (cm),
consistence coefficient
n power law coefficient
S
flux
sediment flux (m³/s³)
u current velocity (m/s),
U
max
maximum current velocity (m/s),
u
mean
mean current velocity (m/s),
Z or z distance to bottom (cm)
Greek letters
coefficient of dynamic viscosity of pure water (Pa.s)
dynamic viscosity coefficient (Pa.s)
ap
apparent viscosity coefficient (Pa.s)
a
density of ambient fluid (kg/m³)
m
density of mixture (kg/m³)
i
yield strength - critical shear stress (Pa)
0
shear stress at the bottom (Pa)
lam
laminar component of shear stress (Pa)
turb
turbulent component of shear stress (Pa)
x
shear stress (Pa)
8. Acknowledgement
A grateful thanks to: CNPq – Brazilian National Council for Scientific and Technological
Development - to support my PhD “sandwich” program at University of Leeds; the head of
Hydrodynamics – Natural Water Bodies
284
NECOD – Density Currents Research Center, IPH/UFRGS - Professor Rogério D. Maestri; to
Professor Ana Luiza de O. Borges and professor Jaco H. Baas for their support and also to
my colleagues Eduardo Puhl and Richard E. Ducker.
9. References
Amy, L. A., Talling, P. J., Edmonds, V. O., Sumner, E. J. & Leseur, A. (2006) An experimental
investigation on sand-mud suspension settling behaviour and implications for
bimodal mud content of submarine flow deposits.
Sedimentology Vol.53, pp. 1411–
1434, ISSN 0037-0746
Altinakar, M. S. (1988). Weakly depositing turbidity currents on small slopes. PhD thesys à
Ecol. Pol. Fed. Lausanne.
Baas, J.H.; Kesteren, W.V.; Postma, G. (2004). Deposits of depletive high-density turbidity
currents: a flume analogue of bed geometry, structure and texture.
Sedimentology,
v51, pp. 1053-1088 ISSN 13653091|
Bouma, A. H. (1962).
Sedimentology of some flysch deposits: a graphic approach to facies
interpretation
. Amsterdam. Netherlands
Britter, R. E.; Simpson, E. J. (1978). Experiments on the dynamics of a gravity current head.
Journal of Fluid Mechanics, Vol. 88, pp. 223-240. ISSN: 0022-1120.
Coussot, P. (1997).
Mudflow Rheology and Dynamics. Taylor & Francis. ISBN 905410693X.
Einstein, A. (1906) Investigations on the theory of the Brownian movement (from the
annalen
der physik
, Vol. 4), No. 19, pp. 289-306
Elisson, T.H.; Turner, J. S. (1959). Turbulent entrainment in stratified flows.
Journal of Fluid
Mechanics
, Vol. 6, pp. 423-448 ISSN: 00221120
Fischer, R. V. (1983). Flow transformations in sediment gravity flows.
Geology, Vol. 11, pp.
273-274, ISSN 0091-7613
Gani, M. R. (2004). From Turbid to Lucid: A straightforward approach to sediment gravity
flows and their deposits.
The Sedimentary Record. September, 2004, Vol. 2, No. 3, pp.
4-8.
Graf, W. e Altinakar, M. S. (1998). Turbidity currents, In:
Fluvial Hydraulics: Flow and
Transport processes in channels of simple geometry
. W. H. Graff, (Ed.) 468-516, Jonh
Wiley e Sons, ISBN: 978-0-471-97714-8 New York- US.
Hampton, M.A. (1972). The role of subaqueous debris flow in generating turbidity currents.
Journal of Sedimentary Petrology, Vol. 42, No 4, pp. 775-793 ISSN 0016-7606
Ilstad, T., Elverhøi, A., Issler, D., & Marr, J. (2004). Subaqueous debris flow behaviour and its
dependence on the sand/clay ratio: a laboratory study using particle tracking.
Marine Geology, Vol. 213, pp. 415–438, ISSN 0025-3227
Kneller, B. (1995). Beyond the turbidite paradigm: physical models for deposition of
turbidites and their implications for reservoir prediction. In:
Characterization of deep
marine clastic systems.
A.J. Hartley (Ed). Pp. 31-49, Geological Society London. ISBN:
1897799357. London, UK.
Kneller, B.C., Bennett, S.J. & McCaffrey, W.D. (1999) Velocity structure, turbulence and fluid
stresses in experimental gravity currents.
Journal of Geophys. Research. Oceans., Vol.
94, pp. 5281-5291.
Kneller, B. & Buckee, C. (2000). The structure and fluid mechanics of turbidity currents: a
review of some recent studies and their geological implications.
Sedimentology,
Vol.47, Suppl. 1, pp. 62-94, ISSN 0091-7613.
Sediment Gravity Flows: Study Based on Experimental Simulations
285
Kuenen, P. H. (1950). Turbidity currents of high density. In: Proceedings of 18
th
International
Geological Congress (1948)
, London, pp. 44-52.
Lowe, D. R. (1979). Sediment gravity flows: Their classification and some problems of
application to natural flows and deposits.
SEPM (Special Publication n. 27), pp 75-82.
Lowe, D. R. (1982). Sediment gravity flows: II. Depositional models with special reference to
the deposits of high-density turbidity currents.
Journal of Sedimentary Petrology, Vol.
52, No. 1, pp. 279-297.
Normark, W.R. & Piper, D. J. W. (1991). Initiation processes and flow evolution of turbidity
currents: implications for the depositional record.
SEPM (Special Publication n. 46).
pp. 207-230.
Manica, R. (2009).
Correntes de turbidez de alta densidade: condicionantes hidráulicos e
deposicionais
. PhD thesys, Instituto de Pesquisas Hidráulicas, Universidade Federal
do Rio Grande do Sul, Porto Alegre - Brazil.
Marr, J.G., Harff, P.A., Shanmugan, G. & Parker, G. (2001) Experiments on subaqueous
sandy gravity flow: the role of clay and water content in flow dynamics and
depositional structures.
GSA Bulletin, Vol. 113, No. 11, pp. 1377-1386.
McCave, I, N & Jones, P.N (1988). Deposition of ungraded muds from high-density non
turbulent turbidity currents.
Nature, Vol. 333, pp 250-252, ISSN 0016-7649
Michon, X.; Goddet, J. & Bonnefille, R. (1955).
Etude Theorique et experimentale des courants de
densite
. 2 vol. Lab. Nat. d’Hydralique Chatou, França.
Middleton, G. V. (1966). Experiments on density and turbidity currents I. Motion of the
head.
Canadian Journal of Earth Sciences, Ottawa, Vol. 3, pp. 523-546.
Middleton, G. V. (1993). Sediment deposition from turbidity currents.
Annual Review of Earth
Planet Science,
Vol. 21, pp. 89-114.
Middleton, G. V. & Hampton, M. A. (1973). Sediment gravity flows: mechanics of flow and
deposition. In
Turbidites and Deep Water Sedimentation G. V. Middleton and A. H.
Bouma (eds.). Anaheim, California, SEPM. Short Course Notes, 38p
Mohrig, D.; Elverhoi, A.; & Parker, G. (1999). Experiments on the relative mobility of muddy
subaqueous and subaerial debris flows, and their capacity to remobilize antecedent
deposits.
Marine Geology. Vol. 154, pp. 117-129.
Mohrig, D. & Marr, J.G. (2003). Constraining the efficiency of turbidity current from
submarine debris flow and slides using laboratory experiments.
Marine and
Petroleum Geology
, Vol. 20, pp. 883-899
Parker, G., Fukushima, Y., & Pantin, H.M., (1986). Self accelerating turbidity currents:
Journal of Fluid Mechanics, Vol. 171, pp. 145–181.
Parker, G., Garcia, M., Fukushima, Y. & YU, W. (1987) Experiments on turbidity currents
over a erodible bed.
Journal of Hydraulic Research, Vol. 25, pp. 123-147.
Parsons, J. D; Friedrichs C. T.; Traykovsky P. A.; Mohrig, D.; Imran, J.; Syvitsky, P. M.;
Parker, G.; Puig, P.; Buttles, J. L. & Garcia, M. H. (2010). The mechanics of sediment
gravity flows. In
Continental Margin Sedimentation: From Sediment Transport to
Sequence Stratigraphy.
C. A. Nittrouer, J. A. Austin, M. E. Field, J. H. Kravitz, J. P. M.
Syvitski, P. L. Wiberg, John Wyley &Sons, ISBN 9781405169349, New York, US.
Postma, G.; Nemec, W. & Kleinspehn, K.L. (1988). Large floating clasts in turbidites: a
mechanism for their emplacement.
Sedimentary Geology, Vol. 58, pp. 47-61.
Simpson, E. J. (1972). Effects of the lower boundary on the head of a gravity current.
Journal
of Fluid Mechanics
, Vol. 53, pp. 759-768.
Hydrodynamics – Natural Water Bodies
286
Simpson, E. J. (1997). Gravity currents in the enviroment and the laboratory. 2.ed. Cambridge
University, ISBN 0521664012, UK
Talling, P. J.; Wynn, R. B.; Masson; D. G., Frenz, M.; Cronin, B. T.; Schiebel,R;
Akhmetzhanov, A. M., Dallmeier-Tiessen, S., Benetti, S.; Weaver, P. P. E.;
Georgiopoulou, A.; Zuhlsdorff, C. & Amy, L. A. (2007). Onset of submarine debris
flow deposition far from original giant landslide.
Nature. Vol. 450. pp. 541-544
Wan, Z.; &Wang, Z., (1994),.
Hyperconcentrated Flow. IAHR Monograph Series, A. A.
Balkema. Rotterdam. 290p
Whitehouse, R., Soulsby, R., Roberts, W. & Mitchener, H. (2000).
Dynamics of Estuarine Muds.
London, UK.
Winterwerp, J. C. (2001). Stratification effects by cohesive and non-cohesive sediment,
J.
Geophys. Research
, Vol. 106, No. 22, pp. 559 -574.
Winterwerp, J.C. (2002). On the flocculation and settling velocity of estuarine mud.
Cont.
Shelf Research
. Vol. 22, pp. 1339–1360.