báo cáo hóa học: " Knowledge discovery in databases of biomechanical variables: application to the sit to stand motor task" docx
Bạn đang xem bản rút gọn của tài liệu. Xem và tải ngay bản đầy đủ của tài liệu tại đây (850.45 KB, 10 trang )
BioMed Central
Page 1 of 10
(page number not for citation purposes)
Journal of NeuroEngineering and
Rehabilitation
Open Access
Research
Knowledge discovery in databases of biomechanical variables:
application to the sit to stand motor task
Giuseppe Vannozzi*
1
, Ugo Della Croce
2
, Antonina Starita
3
,
Francesco Benvenuti
4
and Aurelio Cappozzo
1
Address:
1
Department of Human Movement and Sport Sciences, University Institute for Movement Science, Roma,
2
Department of Biomedical
Sciences, University of Sassari, Sassari, Italy,
3
Department of Informatics, University of Pisa, Pisa, Italy and
4
Department of Rehabilitation, AUSL
11, San Miniato, Pisa, Italy
Email: Giuseppe Vannozzi* - ; Ugo Della Croce - ; Antonina Starita - ;
Francesco Benvenuti - ; Aurelio Cappozzo -
* Corresponding author
knowledge discoverydata miningassociation ruleshuman movementsit to stand
Abstract
Background: The interpretation of data obtained in a movement analysis laboratory is a crucial
issue in clinical contexts. Collection of such data in large databases might encourage the use of
modern techniques of data mining to discover additional knowledge with automated methods. In
order to maximise the size of the database, simple and low-cost experimental set-ups are
preferable. The aim of this study was to extract knowledge inherent in the sit-to-stand task as
performed by healthy adults, by searching relationships among measured and estimated
biomechanical quantities. An automated method was applied to a large amount of data stored in a
database. The sit-to-stand motor task was already shown to be adequate for determining the level
of individual motor ability.
Methods: The technique of search for association rules was chosen to discover patterns as part
of a Knowledge Discovery in Databases (KDD) process applied to a sit-to-stand motor task
observed with a simple experimental set-up and analysed by means of a minimum measured input
model. Selected parameters and variables of a database containing data from 110 healthy adults, of
both genders and of a large range of age, performing the task were considered in the analysis.
Results: A set of rules and definitions were found characterising the patterns shared by the
investigated subjects. Time events of the task turned out to be highly interdependent at least in
their average values, showing a high level of repeatability of the timing of the performance of the
task.
Conclusions: The distinctive patterns of the sit-to-stand task found in this study, associated to
those that could be found in similar studies focusing on subjects with pathologies, could be used as
a reference for the functional evaluation of specific subjects performing the sit-to-stand motor task.
Published: 29 October 2004
Journal of NeuroEngineering and Rehabilitation 2004, 1:7 doi:10.1186/1743-0003-1-7
Received: 30 August 2004
Accepted: 29 October 2004
This article is available from: />© 2004 Vannozzi et al; licensee BioMed Central Ltd.
This is an Open Access article distributed under the terms of the Creative Commons Attribution License ( />),
which permits unrestricted use, distribution, and reproduction in any medium, provided the original work is properly cited.
Journal of NeuroEngineering and Rehabilitation 2004, 1:7 />Page 2 of 10
(page number not for citation purposes)
Background
In the last decade quantitative movement analysis has
been increasingly used in clinical contexts [1]. This analy-
sis makes use of fairly complex instrumentation and of
models of the musculo-skeletal system. It provides a great
amount of information, such as space and time character-
istics of the motor task analysed, joint and segment kine-
matics and kinetics and electromyographic patterns of
muscular recruitment. An integrated analysis of measured
and estimated biomechanical quantities allows for the
description of the subject performance, for the discrimi-
nation among different motor strategies and, therefore, it
supports the clinical decision-making process [2].
Modern complex instrumentation and models, such as
stereophotogrammetric systems and multi-segment mod-
els of the human body, provide a thorough and faithful
description of the subject's movement at a local level (e.g.
joints kinematics), to be used at its best as a support to the
functional assessment of subsystems of the locomotor
apparatus (e.g. joint function) [3]. However, the large
amount of measured information is not paralleled by the
capability of such information of supporting the assess-
ment of the overall subject's mobility [4]. Simpler experi-
mental set-ups and models may be more appropriate to
functionally assess a subject performing a specific motor
task [5]. In recent years, clinical tests have been devised
aimed at quantitatively assessing the level of a subject's
activity limitation based on simple and encumbrance-free
experimental set-ups associated with mechanical models
of the musculo-skeletal system. These models are
designed to be associated with both the subject and the
specific task being performed [6]. In this context, Mini-
mum Measured Input Models (MMIM) have been pro-
posed and proven to offer effective insights into the motor
task execution [7]. Simplified, and therefore low-cost,
experimental set-ups facilitate the gathering of data both
locally (a shorter examination time is needed) and in
multi-centre contexts (more laboratories can afford the
necessary experimental set-up), allowing the collection of
a great quantity of data which may be sent to a single data
repository.
However, even simplified experimental setups and mod-
els may provide a large amount of biomechanical data
that requires considerable human efforts to be interpreted
[8]. In fact, traditional methods of data analysis for the
extraction of knowledge rely on a direct analysis, which is
usually demanding and time-consuming, and on the
interpretation of an experienced analyst [9]. Such analysis
becomes hardly applicable when dealing with data col-
lected multi-centrically.
The aim of this study was to extract knowledge regarding
the execution of a specific motor task. The term "knowl-
edge" refers here to any relationship among attributes
associated with the phenomenon under analysis. These
relationships can be intended as causal and, therefore,
suitable for the interpretation endeavours, or at least as
tools for evidencing the presence of a repeatable pattern of
variables. The declared goal was pursued by searching
relationships among large amounts of biomechanical
quantities by using an automatic method. Some data min-
ing techniques (data mining is a step of a process called
Knowledge Discovery in Databases (KDD)) lend them-
selves to be effectively used in this context since they may
reveal meaningful patterns and data structures from mas-
sive databases [10,11]. A specific data mining technique
was applied to the data yielded by the analysis of sit-to-
stand (STS) trials performed by healthy adults and carried
out using the above-mentioned MMIM approach. The STS
motor task was chosen because it has been shown to be
adequate for determining the level of subject-specific
motor ability [12]. In addition, the data provided by
MMIMs were shown to be powerful overall descriptors of
motor tasks. A group of unrestricted age and gender
healthy adults was used with the goal of discovering
knowledge inherent to the way healthy adults perform the
selected motor task.
In order to properly frame this study, a summary descrip-
tion of the MMIM approach and an overview of the KDD
process are reported.
Methods
A MMIM applied to the STS task – The TIP model
A MMIM is a model of a portion of the musculoskeletal
system that includes the invariant aspects of both the
modelled mechanical system and the motor task being
performed. Therefore, a MMIM requires a minimum
amount of measurements and provides a physiology-
related description of the motor task [4]. In analysing the
STS, only measurements from a single force platform are
needed. The task is divided in two time phases: before-
and after-seat-off (BSO and ASO). In each time phase a
Telescopic Inverted Pendulum (TIP) model is applied. A
TIP is characterised by a fixed base of support and by a
massless link joining the base of support of the moving
portion of the body to its centre of mass (CM). The link
can elongate, controlled by a linear actuator (LA), and can
rotate around its base of support, controlled by two actu-
ators acting in the sagittal (SA) and frontal (FA) plane,
respectively. The kinematics of, and the dynamic actions
on, the CM of the modelled portion of the body involved
in the movement are needed as model inputs. The outputs
of the TIPs are the kinematic and kinetic variables associ-
ated with the actuators. During BSO the TIP is applied to
the upper part of the body with its base of support posi-
tioned on the chair, while during ASO the TIP is applied
to the whole body and its base of support is located at the
Journal of NeuroEngineering and Rehabilitation 2004, 1:7 />Page 3 of 10
(page number not for citation purposes)
ankles. In order to apply the TIP model in each phase, sub-
ject specific and experimental set-up parameters are set. A
list of TIP parameters and TIP output variables may be [7]
collected into a database.
The KDD process
The KDD process was introduced in order to provide a
framework in which data-miners could work in a logical
and sequential way, considering all the research aspects
from the data acquisition to the information extraction
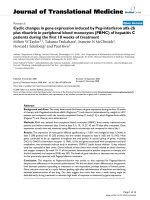
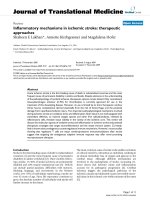
[13,14]. An iterative five phase process may be adopted
(Figure ) [15].
Initially, the domain understanding, the parameter selec-
tion, and the goal definition need to be set. A subset of
interest of the stored dataset can then be isolated. Pre-
processing is performed to reduce noise and fill possible
gaps in the target dataset. Elimination of outliers, correc-
tions of wrong elements in the database and reduction of
dimensionality are crucial transformations to reach an
adequate level of suitability of the database.
Data mining "is a well-defined procedure that takes data as
input and produces output in the form of models or pat-
terns" [16] and is the core of the KDD process. It is used
with different aims such as Exploratory Data Analysis
(EDA) [17], Descriptive Modelling [18], Predictive Model-
ling such as Classification and Regression [19], Retrieval
by Content [20] and Discovering Patterns or Rules [21].
Innovative techniques for the data mining have been
introduced to be used either in conjunction with or in
alternative to traditional statistical methods for two main
reasons. First, while classical statistics is applied to data
collected according to a specific goal of the analyst, data
mining methods are applied to data already collected and
aim at finding unknown relationships among them. Sec-
ondly, data mining allows to infer general rules with ade-
quate approximation, even if the amount of data available
is not as large as that generally required by inferential sta-
tistics [16].
The selection of the data mining technique is based on the
specific analysis. Prediction, clustering, classification and
research of association rules are the most common tasks
and each of them may be accomplished with various algo-
rithms. Finally, data interpretation helps the user in man-
aging and understanding the results: visualisations
(clustering) or extraction of symbolic rules are common
ways of evaluating the discovered knowledge.
The search for association rules
The technique of research of association rules, which aims
at finding the most recurrent patterns in a database, was
selected for the data mining. Given a database D of exper-
imental trials T, each experimental trial is a record of D
and is made of a set X of literals called items. An item rep-
resents a specific value of an attribute of a table of D, and
a record can be represented as an attribute (i.e. an output
variable or a model parameter) together with its value
[21]. The problem may be defined as follows. Let I = {i
1
,
i
2
, , i
m
} a set of items of D therefore, T can be seen as a
group of items such that T I. An association rule can be
defined as a logical implication:
X Y
A scheme of the KDD processFigure 1
A scheme of the KDD process. Input data are initially selected and target data are isolated. Pre-processing and transformation
are performed to ensure the database reliability. Data mining is the core analysis. The knowledge discovery process ends with
the interpretation of the results.
⊆
⇒
Journal of NeuroEngineering and Rehabilitation 2004, 1:7 />Page 4 of 10
(page number not for citation purposes)
where X I is the antecedent of the rule, Y I is the con-
sequent and X ∩ Y = . A rule X Y, over a set of trials
T, has a confidence c if c % of the trials in T containing X,
also include Y. The same rule in the same context has a
support s if s % of the trials in T contain X Y. The confi-
dence of a rule X Y can be calculated from the support
of the antecedent X and the support of the union of the
antecedent X and the consequent Y:
Confidence is an index of the validity of a rule. A high
confidence means that there is a strong relationship
between X and Y in the sense that the presence of a pattern
X in a trial implies, with a high probability, the presence
of Y in the same trial. Given a set of trials T, finding "inter-
esting" association rules in T is the problem of generating
all the rules whose both support and confidence are
greater than a set threshold (minimum support and mini-
mum confidence).
The extracted rules were reported in the following format:
A → B [c % ]
where the first item was the antecedent of the rule, the
item which followed was the consequent, while the value
indicated in square brackets was the confidence. The
implication was intended to be valid only one way, from
the left to the right. In case of validity of both directions,
"definitions" were obtained:
A ←→ B [c-min %]
composed by two rules having the two items both as ante-
cedent and consequent whose confidence c-min was the
lowest of the two c values associated with the one way
rules. The search for association rules followed the path
illustrated in Figure 1. Initially, data were read from the
sources and displayed, allowing for a straightforward
selection of the dataset of interest. Next, the subset of data
were prepared to the analysis by eliminating possible out-
liers and filling possible gaps in the database due to incor-
rect applications of the model. Typically, data preparation
is the most time consuming phase of the KDD, but is also
highly crucial since the effectiveness of a data mining
analysis relies on the consistency of the database.
Since the theory of association rules was formulated to
deal with qualitative attributes [22] characterised by a lim-
ited number of scores, the virtually infinite values of
quantitative attributes were assigned to a limited amount
of intervals identified by progressive numbers. Such dis-
cretisation process [23] for each attribute A, generated a
variable number n of partitions (A
i_n
; i = 1, , n). The first
partition A
1_n
included the lowest values of A and the last
partition A
n_n
included highest values of A. Items (i.e. the
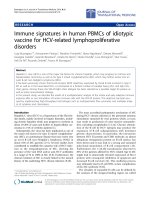
attribute associated with a relevant discretised value) sim-
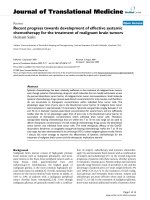
ilar to the qualitative items could thus be generated (Fig-
ure 2).
Self organising maps (SOM) were used to cluster the val-
ues of the attributes. SOMs are widely known as a power-
ful clustering tool [24] and could overcome the
disadvantages related to other unsupervised approaches
as the equal frequency intervals or the equal interval width
techniques. [25]. The latter methods, imposing an equal
number of points belonging to each interval or, similarly,
each interval having a pre-determined length, may gener-
⊆ ⊆
∅
⇒
∪
⇒
c
XY
X
=
∪support
support
()
()
Example of a discretisation process of a quantitative attributeFigure 2
Example of a discretisation process of a quantitative attribute. Grey areas represent the different partitions, i.e. the items. Ver-
tical lines represent the values of the quantitative attribute.
Journal of NeuroEngineering and Rehabilitation 2004, 1:7 />Page 5 of 10
(page number not for citation purposes)
ate meaningless or even empty intervals. SOMs were cho-
sen and purposely implemented to properly isolate
residual outliers [26] from the distribution of values of an
attribute, to correctly define the clouds of values and to
automatically set the optimal number of intervals [27].
Values and/or intervals were mapped in a discrete domain
as integer numbers and items were created. In this way,
the database became a set of itemsets.
The search of frequent itemsets was performed on the
selected dataset. Itemsets with support greater than the
minimum support were found. The set of itemsets that
appeared frequently in the transactions of the database
was then identified. This step of the process was the most
demanding in terms of processing time and computer
memory occupation.
The search for association rules was accomplished by
using the APRIORI algorithm [10] which was shown to
perform better then other common algorithms such as AIS
[21] and SETM [28]. The APRIORI algorithm iterated the
two following steps:
• building of a candidate set Ck of itemsets, counting their
occurrences;
• defining "large itemsets" Lk on the basis of support
constraints.
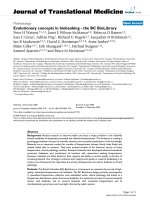
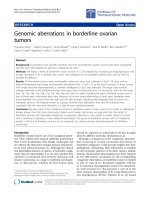
In figure 3, the main steps of the algorithm are illustrated.
Each frequent itemset generated a set of rules and each
rule was scored by its confidence. Only rules whose confi-
dence was higher than the minimum confidence reached the
following phase. The selected association rules repre-
sented the knowledge extracted from the database
expressed in a quasi natural language that the user could
interpret. Efforts were made toward a clustered
representation of the set of rules to increase readability
and interpretability of information.
A software project for the data mining phase was pur-
posely designed and implemented as follows: the software
received as input all data from the database and returned
a text file containing a list of the discovered association
The Apriori algorithm applied to the database under analysisFigure 3
The Apriori algorithm applied to the database under analysis. The two phases of the Apriori algorithm are highlighted. The
first, referred as "join step" phase, aimed at the generation of the candidate itemsets C
k
built starting from L
k-1
, the frequent
itemset of the previous phase. In the second phase the C
k
itemsets underwent to a "pruning" procedure that selected the fre-
quent itemsets L
k
on the base of the support check.
Journal of NeuroEngineering and Rehabilitation 2004, 1:7 />Page 6 of 10
(page number not for citation purposes)
rules and all the possible unified rules and definitions
derived from the entire dataset. Support and confidence
thresholds were set to 35% and 85%, respectively. Con-
sidering that in a rule more than one consequent can be
found [29], a maximum number of consequent items had
to be set. In this analysis such number was experimentally
set to 4 to avoid the presence of meaningless items in the
resulting rules.
Materials
Healthy adult volunteers (N = 110), both males and
females between 22 and 87, participated in the study, exe-
cuting a total of more than 1100 trials. They were initially
asked to sit on a seat. The height of the seat was set at a
value equal to the subject's tibial plateau height [30]. Sub-
jects could choose the distance of their feet from the seat
and had to keep them parallel at a distance equal to that
measured between iliac anterior superior spines. Both
footprints were then drawn on the floor, ensuring that the
subject's feet were in the same position during all the
trials. In addition, medio-lateral and antero-posterior
coordinates of selected foot points were measured.
Anthropometric parameters, such as the body mass and
the length of the lower limb segments, were also obtained.
Subjects were asked to rise from the seat at the preferred
speed after an audio start signal and look at a frontal one
metre distant fixed point at the height of 80% of their
eyes' height, maintaining the orthostatic posture until the
stop signal. Arms were kept crossed on the chest during
the trial to avoid that arm swing could affect CM
movements.
Ground reaction forces were measured using a six compo-
nent Bertec force platform (0.4 m*0.6 m), positioned
under both the seat and the subject's feet. Data were col-
lected at a sampling rate of 100 Hz and pre-processed with
an internally developed Labview
®
software (National
Instruments Inc.). First, force platform signals were digit-
ally low-pass filtered (second order Butterworth filter 15
Hz cut-off frequency). Data were then fed into the TIP
model, which yielded the kinematic and kinetic time
functions (displacement, velocity, force/couple and
power) of the LA and SA. FA variables were not analysed
since their contribution to the motor strategy was consid-
ered negligible, given the sagittal symmetry of the STS
motor task. From these functions a subset of kinematic
and kinetic variables (KK-set) was extracted including
time events of the task (normalised with respect to the
duration of the whole task, see caption of Table 1 for the
complete list of variables) and together with experimental
set-up and subject specific parameters were stored in a
Microsoft Access database, and loaded using a Windows
ODBC interface [31]. The resulting database contained a
total of more than 52,000 items. The number of analysed
attributes was set to 47, as listed in Table 1.
Table 1: The 47 attributes analysed. They included subject initial conditions (ankle and thigh angles) and experimental setup/
anthropometric parameters (seat height, thigh length, foot length, TIP1 hinge and malleoli coordinates), KK-set variables and
important time instants. The KK-set was made of displacements (Disp), velocities (Vel), forces or couples and powers referred to the
two LA and SA actuators. So referred to seat-off. In addition, ML, AP and V referred to the medio-lateral, antero-posterior and
vertical directions. Finally, the attributes labelled with an initial "T" represented the instant of occurrence of the corresponding
quantity (e.g. the attribute MaxLAVelASO referred to the maximum value of LA velocity after the seat-off and the attribute
TMaxLAVelASO represented the corresponding instant of occurrence).
Anthropometric and Experimental set-up Attributes Kinematic and Kinetic Attributes Time-Attributes
RightAnkleAngle MaxSADispBSO Duration
LeftAnkleAngle MaxSAVelBSO
APRightMalleolusCoord MaxSACoupleBSO TMaxSADispBSO
APLeft MalleolusCoord MaxSAPowerBSO TMaxSAVelBSO
APHingeCoord SADispSo TMaxSAForceBSO
MLRightMalleolusCoord SAVelSo TMaxSAPowerBSO
MLLeftMalleolusCoord SACoupleSo
MLHinge Coord SAPowerSo t
So
VRightMalleolusCoord MaxSADispASO
VLeftMalleolusCoord MaxSAVelASO TMaxSADispASO
VHingeCoord MaxSACoupleASO TMaxSAVelASO
SeatHeight MaxSAPowerASO TMaxSAForceASO
ThighLength MaxLADispASO TMaxSAPowerASO
ShankLength MaxLAVelASO TMaxLADispASO
FootLength MaxLAForceASO TMaxLAVelASO
RightThighAngle MaxLAPowerASO TMaxLAForceASO
LeftThighAngle TMaxLAPowerASO
Journal of NeuroEngineering and Rehabilitation 2004, 1:7 />Page 7 of 10
(page number not for citation purposes)
Results
Various rules and definitions were found. Among them,
some referred to obvious relationships such as those
related to symmetry between right and left coordinates,
others related a single item of a temporal parameter
(TMaxSADispASO
3_3
) as a consequent of the following
kinematic and kinetic items:
a) MaxSADispBSO
3_6
and MaxSAPowerBSO
1_6
, before seat-
off;
b) SAVelSo
3_6
, at seat-off;
c) MaxLADispASO
3,4_6
, MaxLAForceASO
4_5
,
MaxSADispASO
3_6
and MaxSAVelASO
2,3_5
, after seat-off;
and of the following time events:
Duration
1_6
, TMaxSADispBSO
3_6
, TMaxSAVelBSO
3_6
,
TMaxSACoupleBSO
2_6
, TMaxSAPowerBSO
2_6
,
TMaxLADispASO
5_6
and TMaxSAPowerASO
3_5
.
The attribute TMaxSADispASO was the attribute with the
lowest number of partitions (three partitions) and its last
partition included about 90% of the observations.
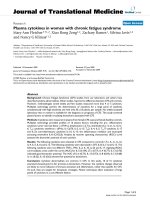
The discovered definitions and rules that could not be eas-
ily predicted are illustrated in Figure 4 using a cluster rep-
resentation, which highlights inner and crossed
relationships among items of each phase of the task; val-
ues of confidence are reported in the figure caption.
Graphic cluster representation of both the rules and the definitions found in the studyFigure 4
Graphic cluster representation of both the rules and the definitions found in the study. The first ones, marked with a single-
ended arrow, were found to have a confidence ranging from 86% to 96%. The second ones, marked with a double-ended
arrow, both presented a confidence of 95%. Involved items are positioned according to the STS time subdivision (BSO and
ASO phases and seat-off timing).
Journal of NeuroEngineering and Rehabilitation 2004, 1:7 />Page 8 of 10
(page number not for citation purposes)
The definitions related exclusively time instant items:
• TMaxSADispBSO
3_6
←→ t
so3_6
[95 %],
• TMaxSAAngVelASO
3_5
←→ TMaxSAPowerASO
3_5
[95 %],
The first definitions related the 'average' time of occur-
rence of maximum sagittal displacement during BSO (par-
tition 3 of 6) to 'average' values of t
So
(partition 3 of 6).
The second definition associated the time instant of max-
imum sagittal velocity to that of maximum power, both
after the seat-off. Moreover, meaningful rules were found
that involved as consequent the item MaxSAPowerBSO
1_6
.
This item showed relationships, with a value of confi-
dence varying between 86% and 96%, with the following
kinematic and kinetic items:
MaxSACoupleBSO
2_6
, MaxSADispBSO
3_6
,
MaxLAForceASO
4_5
, and MaxSAVelASO
2_5
; and the follow-
ing temporal items:
TMaxSACoupleBSO
2_6
, TMaxSAPowerBSO
1_6
,
TMaxSAPowerASO
3_5
and SAVelSo
3_6
.
The partitions corresponding to the attributes involved in
both rules and definitions, their support and their range
of variability expressed in the relevant units of measure-
ment (UoM), are reported in Table 2.
The items reported in Table 2 belong to a subset of 18
attributes of the original 47. Only a limited number of
items was involved in the discovered rules.
Discussion
The data mining analysis allowed for the discovery of
both definitions and rules relating various items obtained
from a MMIM analysis of the STS motor task. The most
obvious and/or expected relationships, such as those
related to the symmetry between right and left coordi-
nates, also noticeable by a visual examination of the task
as performed by the investigated subject, were included in
the set of discovered rules and definitions. The finding of
such relationships provided elements to confirm the
validity of the data mining analysis. The set of rules found
that related the temporal item TMaxSADispASO
3_3
to vari-
ous temporal, kinematic and kinetic items needs a further
analysis to be interpreted. In fact, the attribute TMax-
SADispASO was mapped in only three partitions and most
of its observations were concentrated in the last partition.
This circumstance rendered highly probable the presence
of rules relating the item TMaxSADispASO
3_3
to those
items of the various attributes with support higher than
35%. Therefore, these rules were used to highlight items
involved with a considerable support and therefore the
usefulness of such rules was deemed limited. In general,
when interpreting a rule/definition found, the analyst
should be aware not only of both its confidence and the
support of the items forming it, but also of the number of
partitions in which the attributes involved in the rule/def-
inition were divided. The fewer are the partitions used for
a quantitative attribute, the higher is the probability of
finding rules/definitions unsuitable for drawing specific
patterns. This is particularly true when most of the obser-
vations fall in a single partition of the attribute. Con-
versely, some of the rules and definitions discovered by
Table 2: Items involved in the discovered rules and definitions, their support and their range of values.
Item Support (%) Range UoM
Duration
1_6
45.0 1.01 1.61 s
MaxSADispBSO
3_6
41.3 29 36 deg
MaxSACoupleBSO
2_6
35.5 0.06 0.09 Nm kg
-1
m
-1
MaxSAPowerBSO
1_6
81.5 0.00 0.08 Wkg
-1
m
-1
SAVelSo
3_6
40.1 0.58 0.77 rad s
-1
MaxSADispASO
3_6
59.7 -3 14 deg
MaxSAVelASO
2,3_5
84.7 0.44 1.32 rad s
-1
MaxLADispASO
3,4_6
87.2 45.4 54.5 % of TIP2 final length
MaxLAForceASO
4_5
43.9 10.85 11.94 N kg
-1
TMaxSADispBSO
3_6
36.7 39.2 48.0 % of duration
TMaxSAVelBSO
3_6
37.9 34.6 42.1 % of duration
TMaxSACoupleBSO
2_6
47.5 10.3 15.1 % of duration
TMaxSAPowerBSO
1,2_6
92.1 20.5 26.3 % of duration
t
So3_6
35.4 46.9 55.9 % of duration
TMaxSADispASO
3_3
89.2 87.1 99.9 % of duration
TMaxSAVelASO
3_5
44.6 42.0 54 % of duration
TMaxSAPowerASO
3_5
45.4 42.2 54.4 % of duration
TMaxLADispASO
5_6
36.4 90.8 96.3 % of duration
Journal of NeuroEngineering and Rehabilitation 2004, 1:7 />Page 9 of 10
(page number not for citation purposes)
the data mining analysis highlighted relationships that
could not be easily predicted otherwise. The two
definitions reported in the results section, that related
time instant items, indicated that specific 'average' timings
(items belonging to central partitions of the correspond-
ing attribute) of the sit-stand task were closely related.
This finding is consistent with those present in the litera-
ture [32,33]. In particular referring to the second defini-
tion reported, since power is the product of moment and
angular velocity, the definition that associates 'average'
values of the instant of maximum sagittal velocity to those
of maximum power after the seat-off could be predicted.
Very interestingly, the relationships of the item
MaxSAPowerBSO
1_6
with several KK-set items showed the
importance of the SA in the execution of the task. In fact,
almost all rules relating KK-set items to the
MaxSAPowerBSO
1_6
regarded the sagittal actuator. When
the maximum SA power during BSO occurred early in the
task, its value was among the lowest (TMaxSAPowerBSO
1_6
→ MaxSAPowerBSO
1_6
). Low values of SA maximum
power during BSO also occurred in combination with
low-to-medium couple values (MaxSACoupleBSO
2_6
→
MaxSAPowerBSO
1_6
) and early in the phase
(TMaxSACoupleBSO
2_6
→ MaxSAPowerBSO
1_6
). The latter
rules showed that before seat-off kinetic variables of the
main actuator are strongly related to each other and their
timing. Given a value of one of them, a limited range of
values is to be expected for the others. Moreover, 'average'
SA velocity at seat-off was found to be present in combi-
nation with low maximum SA power at BSO (SAVelSo
3_6
→ MaxSAPowerBSO
1_6
) showing that relatively high
speeds at seat-off could be reached even when the power
exerted before seat-off was low. The presence of low value
partitions in the rules may suggest that most healthy
adults tend to use the least amount of energy necessary to
complete the first phase of the task, showing an effective
strategy of reduction of the energy expenditure [34]. A val-
idation of this hypothesis could be obtained in a rehabil-
itative context, by studying databases containing data of
samples of different populations (i.e. healthy subjects ver-
sus subjects with a specific motor functional limitation).
The rules relating the low maximum SA power during
BSO to variables occurring during ASO allowed for BSO-
ASO crossed inferences. When medium-to-high maxi-
mum LA force during the elevation of the centre of mass
toward the standing position was found, a low maximum
SA power was generated by the SA before seat-off
(MaxLAForceASO
4_6
→ MaxSAPowerBSO
1_6
). Moreover,
consistent with the relationship to the SA velocity at seat-
off, low maximum power of the SA during BSO occurred
in combination with low-to-medium maximum velocity
values during ASO (MaxSAVelASO
2_6
→
MaxSAPowerBSO
1_6
) showing that after seat-off a low-to-
medium SA velocity can be reached and kept during the
remaining part of the task, even when a low power is
exerted before seat-off. Finally, average timing of occur-
rence of maximum SA power after seat-off implied a low
maximum SA power before seat-off (TMaxSAPowerASO
3_5
→ MaxSAPowerBSO
1_6
) showing that, when the task is
performed with an 'average' distribution of the time
instants, the power exerted before seat-off is at its lowest
values.
The results' representation of Figure 4 could be used as the
main outcome of the knowledge discovery process to be
used by the analyst as a reference for the examined popu-
lation. In the case of the present study, the patterns found
are representative of the most common characteristics of
the way healthy adults, of both genders and in a wide age
range, perform the sit-to-stand task. Any deviation from
these patterns found in a healthy adult could be consid-
ered as an uncommon characteristic. The patterns result-
ing from the analysis of a database containing a subgroup
of the subjects examined in the present study (i.e. female
subjects or subjects over the age of 65) could be consid-
ered as specific of the selected subgroup. Similarly, if the
analysis is applied to a database of subjects affected by a
specific pathology then the resulting patterns would char-
acterise that population of subjects. The comparison of
those patterns and the patterns found in the present study
would highlight how differently the two groups perform
the task. In perspective, from a rehabilitation standpoint,
the output of data mining analyses applied to various
groups of subjects performing various tasks could be used
as a reference tool to evaluate the performance of subject
under examination and, therefore, her/his level of
mobility.
Conclusions
The study focused on finding the most frequent patterns
of biomechanical variables and parameters obtained from
dynamometric measurements of healthy subjects per-
forming the sit-to-stand motor task. Data collected in a
large database underwent a knowledge discovery process.
The size of the database is strongly related to the simplic-
ity of the data acquisition procedures. Simple and less
expensive experimental set-ups allow the gathering of
more data and in more locations than high-cost experi-
mental set-ups and procedures. Data acquired from force
platforms, processed with specific biomechanical models,
represent a favourable condition to apply knowledge dis-
covery processes effectively. In this study, data from vol-
unteers in a large age range and of both genders were
analysed in order to extract the most common patterns of
healthy people performing the task. The results of the
knowledge discovery process showed that sit-to-stand
time events were strongly interdependent. Low maximum
sagittal power values before seat-off were strongly related
Publish with BioMed Central and every
scientist can read your work free of charge
"BioMed Central will be the most significant development for
disseminating the results of biomedical research in our lifetime."
Sir Paul Nurse, Cancer Research UK
Your research papers will be:
available free of charge to the entire biomedical community
peer reviewed and published immediately upon acceptance
cited in PubMed and archived on PubMed Central
yours — you keep the copyright
Submit your manuscript here:
/>BioMedcentral
Journal of NeuroEngineering and Rehabilitation 2004, 1:7 />Page 10 of 10
(page number not for citation purposes)
to numerous parameters both before and after seat-off,
highlighting, among other characteristics, that most often
a low power before seat-off is related to a regular occur-
rence of time instants and to low-to-medium sagittal
speed from seat-off to the end of the task. The patterns
found may be considered as typical rules of the sit-to-
stand motor task and could constitute the basis for com-
parisons of patterns characteristic of different groups. The
knowledge acquired in this study is the first step in the
direction of developing a robust clinical tool to evaluate
subject mobility.
Acknowledgements
Supported by CNR, project "Un sistema Web-Based per gli operatori della ria-
bilitazione dell'apparato locomotore" and by MIUR, project "Valutazione
dell'abilità posturale e locomotoria umana per scopi clinici".
References
1. Blanc Y: The role of movement analysis in clinics. In Rapporti
ISTISAN 00/24 2000:3-6.
2. Gage JR: Gait Analysis: An essential tool in the treatment of
cerebral palsy. Clin Orthop 1993, 288:126-134.
3. Frigo C, Davis R: Strengths and Weaknesses of Motion Analy-
sis. In ISEK Newsletter 1–1995 [ />1995/article3.html].
4. Cappozzo A: Minimum measured-input models for the assess-
ment of motor ability. Journal of Biomechanics 2002,
35(4):437-446.
5. Andriacchi TP, Alexander EJ: Studies of locomotion: past, pres-
ence and future. Journal of Biomechanics 2000, 33(10):1217-1224.
6. Loslever P, Laassel EM, Angue JC: Combined statistical study of
joint angles and ground reaction forces using component
and multiple correspondence analysis. IEEE Trans Biomed Eng
1994, 41:1160-1167.
7. Papa E, Cappozzo A: A telescopic inverted-pendulum model of
the musculo-skeletal system and its use for the analysis of
the sit-to-stand motor task. Journal of Biomechanics 1999,
32:1205-1212.
8. Cappozzo A, Camomilla V, Della Croce U, Mazzà C, Quagliarella L,
Vannozzi G, Zok M: Musculo-Skeletal System Modelling in the
Evaluation of the Motor Disability. Theoretical Issues in Ergonomics
Science 2005 in press.
9. Lavrac N, Keravnou E, Zupan B: Intelligent Data Analysis in Med-
icine. In Encyclopedia of Computer Science and Technology, (New York)
2000, 42:113-157.
10. Agrawal R, Imielinski T, Swami A: Database mining: a perform-
ance perspective. IEEE Transactions on knowledge and data
engineering 1993, 5(6):914-925.
11. Bonato P, Mork PJ, Sherrill DM, Westgaard RH: Data Mining of
Motor Patterns Recorded with Wearable Technology. IEEE
Engineering in Medicine and Biology Magazine 2003, 22(3):110-119.
12. Papa E, Cappozzo A: Sit-to-stand motor strategies investigated
in able bodied young and elderly subjects. Journal of
Biomechanics 2000, 33:1113-1122.
13. Reinartz TP: Focusing Solutions for Data Mining: Analytical
Studies and Experimental Results in Real-World Domains. In
Lecture Notes in Computer Science Volume 1623. Springer Verlag; 1999.
14. Carbone PL, Kerschberg L: Intelligent Mediation in Active
Knowledge Mining: Goals and General Description. In Proceed-
ings of AAAI workshop on KDD 1993:241-253.
15. Fayyad UM, Piatetsky-Shapiro G, Smyth P: From Data Mining to
Knowledge Discovery: An overview. In In Advances in Knowledge
Discovery and Data Mining Edited by: Fayyad UM, Piatetsky-Shapiro G,
Smyth P, Uthurusamy R. Menlo Park, CA: AAAI Press; 1996:1-34.
16. Hand D, Mannila H, Smyth P: Principles of Data Mining The MIT Press;
2001.
17. Tukey JW: Exploratory Data Analysis Reading, MA: Addison-Wesley;
1977.
18. Everitt BS, Dunn G: Applied Multivariate Data Analysis New York: Hal-
stead Press; 1991.
19. Duda RO, Hart PE, Stork DJ: Pattern Recognition New York: Wiley;
2001.
20. Jones KS, Willet P: Readings in Information Retrieval Edited by: Sparck
Jones K, Willet P. Morgan Kaufmann Publishers CA; 1997.
21. Agrawal R, Imielinski T, Swami A: Mining association rules
between sets of items in large databases. In In Proceeds of the
ACM SIGMOD Conference on Management of Data New York. ACM
Press,; 1993:207-216.
22. Agrawal R, Srikant R: Fast algorithms for mining association
rules. In Proceedings of the 20th Int conference on very large databases:
San Diego, Chile 1994:487-499.
23. Ho KM, Scott PD: Zeta: A global method for discretization of
continuous variables. In Proceedings of the Third International Confer-
ence on Knowledge Discovery and Data Mining 2001:191-194.
24. Kohonen T: Self-Organization and Associative Memory. Springer informa-
tion sciences series 3rd edition. Springer-Verlag, New York, NY; 1989.
25. Fayyad UM, Irani KB: On the handling of continuous-valued
attributes in decision trees generation. Machine Learning 1992,
8:87-102.
26. Muruzábal J, Muñoz A: On the visualization of outliers via self
organizing maps. Journal of Computation and Graphical Statistics
1997, 6:355-382.
27. Vesanto J, Alhoniemi E: Clustering of the Self-Organizing Map.
IEEE Transactions on Neural Networks 2000, 11(3):586-600.
28. Houtsma M, Swami A: Set-oriented mining of association rules.
Research report RJ 9567 IBM, Almaden research center, San Jose,
California 1993.
29. Srikant R, Agrawal R: Mining Quantitative Association Rules in
Large Relational Tables. In Proceedings of the ACM-SIGMOD Confer-
ence on Management of Data, Montreal, Canada 1996:1-12.
30. Mazzà C, Benvenuti F, Baccini F, Stanhope S: Association Between
Subject Functional Status, Seat Height and Movement Strat-
egy in Sit-to-Stand Performance. Journal of American Geriatric
Society 2004, 52(10):1750-1754.
31. Starita A, Majidi D, Iannone A: Progettazione e sviluppo di un sis-
tema per la gestione e la refertazione del rischio di caduta in
soggetti geriatrici. In Atti del Convegno Nazionale di Analisi del Movi-
mento in Clinica, Roma 1999:114.
32. Schenkman M, Berger RA, Riley PO, Mann RW, Hodge WA: Whole
body movements during rising to standing from sitting. Phys-
ical Therapy 1990, 70:638-651.
33. Kralj A, Jaeger RJ, Munih M: Analysis of standing up and sitting
down in humans: definitions and normative data
presentation. Journal of Biomechanics 1990, 23:1123-1138.
34. Cappozzo A: Considerations on clinical gait evaluation. Journal
of Biomechanics 1983, 16:302.