báo cáo hóa học: " Too much or too little step width variability is associated with a fall history in older persons who walk at or near normal gait speed" pdf
Bạn đang xem bản rút gọn của tài liệu. Xem và tải ngay bản đầy đủ của tài liệu tại đây (257.59 KB, 8 trang )
BioMed Central
Page 1 of 8
(page number not for citation purposes)
Journal of NeuroEngineering and
Rehabilitation
Open Access
Research
Too much or too little step width variability is associated with a fall
history in older persons who walk at or near normal gait speed
Jennifer S Brach*
1
, Jaime E Berlin
1
, Jessie M VanSwearingen
1
,
Anne B Newman
2
and Stephanie A Studenski
3
Address:
1
University of Pittsburgh, Department of Physical Therapy, 6035 Forbes Tower, Pittsburgh, PA 15260, USA,
2
University of Pittsburgh,
Department of Epidemiology, 6035 Forbes Tower, Pittsburgh, PA 15260, USA and
3
University of Pittsburgh, Division of Geriatric Medicine, 6035
Forbes Tower, Pittsburgh, PA 15260, USA
Email: Jennifer S Brach* - ; Jaime E Berlin - ; Jessie M VanSwearingen - ;
Anne B Newman - ; Stephanie A Studenski -
* Corresponding author
Abstract
Background: Decreased gait speed and increased stride time, stride length, double support time,
and stance time variability have consistently been associated with falling whereas step width
variability has not been strongly related to falls. The purpose was to examine the linear and
nonlinear associations between gait variability and fall history in older persons and to examine the
influence of gait speed.
Methods: Gait characteristics and fall history were obtained in 503 older adults (mean age = 79;
61% female) participating in the Cardiovascular Health Study who could ambulate independently.
Gait characteristics were recorded from two trials on a 4 meter computerized walkway at the
subject's self-selected walking speed. Gait variability was calculated as the coefficient of variation.
The presence of a fall in the past 12 months was determined by interview. The nonlinear association
between gait variability and fall history was examined using a simple three level classification derived
from the distribution of the data and from literature based cut-points. Multivariate logistic
regression was used to examine the association between step width variability (extreme or
moderate) and fall history stratifying by gait speed (1.0 m/s) and controlling for age and gender.
Results: Step length, stance time, and step time variability did not differ with respect to fall history
(p > .33). Individuals with extreme step width variability (either low or high step width variability)
were more likely to report a fall in the past year than individuals with moderate step width
variability. In individuals who walked ≥ 1.0 m/s (n = 281), after controlling for age, gender, and gait
speed, compared to individuals with moderate step width variability individuals with either low or
high step width variability were more likely to have fallen in the past year (OR and 95% CI 4.38
[1.79–10.72]). The association between step width variability and fall history was not significant in
individuals who walked < 1.0 m/s (n = 224).
Conclusion: Extreme (either too little or too much) step width variability is associated with falls
in the past year in older persons who walk at or near normal gait speed and not in older persons
who walk slowly (<1.0 m/s).
Published: 26 July 2005
Journal of NeuroEngineering and Rehabilitation 2005, 2:21 doi:10.1186/1743-
0003-2-21
Received: 18 March 2005
Accepted: 26 July 2005
This article is available from: />© 2005 Brach et al; licensee BioMed Central Ltd.
This is an Open Access article distributed under the terms of the Creative Commons Attribution License ( />),
which permits unrestricted use, distribution, and reproduction in any medium, provided the original work is properly cited.
Journal of NeuroEngineering and Rehabilitation 2005, 2:21 />Page 2 of 8
(page number not for citation purposes)
Background
Variability of gait can be quantified using both temporal
and spatial gait characteristics. Variability of temporal
characteristics such as stride time, double support time
and stance time and spatial characteristics such has stride
length has been consistently associated with falling, with
increased variability being associated with fall risk [1-3].
The association between step width variability and fall
risk has been inconsistent. Gabell and Nayak suggest that
step width is related to balance control and that an
increase in step width will lead to greater stability, a pos-
sible compensation for instability [4]. In bivariate analy-
sis, step width variability was related to falls with
individuals who had fallen demonstrating reduced varia-
bility in stride width; however in multivariate analyses the
association between step width variability and future falls
was not significant [3]. Given the conflicting findings on
step width variability and the belief that step width is
believed to be related to balance control [4], we feel that
it is important to further investigate the association
between step width variability and fall risk.
When examining the association between gait variability
and falls the influence of gait speed on the relation has
often not been considered. Most of the research examin-
ing the association between gait variability and falls has
either been conducted in older persons walking at a near
normal walking speed [1] or has not included the effects
of walking speed on the association between gait charac-
teristics and falls [3]. Even though there is some evidence
to suggest that reduced gait speed is more strongly associ-
ated with fear of falling than risk of falling [3], several
studies have reported that older persons who walk slowly
are at risk for falling [5-9]. However, in individuals who
are walking at a near normal walking speed gait variability
has been shown to be a stronger indicator of fall risk than
gait speed [1]. Gait variability appears to be an early indi-
cator of fall risk in highly mobile older persons. However,
whether gait variability, specifically step width variability,
provides useful information about fall risk in people who
walk slowly is unknown. Therefore the purpose of this
manuscript is two-fold: 1) to examine the linear and non-
linear association between gait variability (especially step
width variability) and fall history and 2) to examine the
influence of gait speed on the association between gait
variability and fall history. We hypothesized that in peo-
ple who walk at a near normal gait speed that step width
variability, a gait characteristic believed to be related to
balance control, would be a better indicator of falls than
step length variability, a gait characteristic related to the
automatic stepping pattern [4]. We believe that individu-
als walking at a near normal walking speed are less likely
to have disruption of the automatic stepping pattern and
therefore are less likely to have increased step length vari-
ability (i.e. making step length variability an unlikely indi-
cator of falls in people who walk at a near normal walking
speed). Step width which is related to balance control and
not so much the automatic stepping pattern, is more var-
iable in people walking at a normal speed, thus making it
a potential indicator of fall risk in people walking at a near
normal walking speed [10].
Methods
This is a cross-sectional study of the association between
gait variability and fall history in community-dwelling
older adults. Measures of gait characteristics and fall his-
tory were obtained during a single clinic visit.
Subjects
A sample of ambulatory older adults was recruited from
the Pittsburgh site of the Cardiovascular Health Study
(CHS), a population-based, ongoing longitudinal multi-
center study of coronary heart disease and stroke risk in
community-dwelling older adults age 65 years and older
[11,12]. At the initiation of the CHS in 1989–90, individ-
uals were identified from the Health Care Financing
Administration sampling frame. Individuals who were 65
years or older, noninstitutionalized, expected to remain in
the area for 3 years and able to give informed consent were
included in the study. Individuals who were wheelchair-
bound in the home or were receiving hospice care, radia-
tion therapy or chemotherapy for cancer were excluded
[11,12]. In 1989–90 an original cohort of 5201 predomi-
nately Caucasian (i.e. > 95% Caucasian) men and women
were enrolled, and in 1992–93 a cohort of 687 African
Americans was added.
Subjects included in the analyses were men and women
from the 1998–99 clinic visit of CHS at the Pittsburgh site.
Subjects at the Pittsburgh site who could walk without the
assistance of another person, who did not use an assistive
device for ambulation, and who could follow directions
to complete the gait assessment were included (n = 503).
Measures
Gait Characteristics
The GaitMat II™ system was used for the gait analysis [13].
The GaitMat II™ consists of a 4-meter long walkway on
which the subject walks and a computer system which
controls the GaitMat II™ and analyzes the data. In addi-
tion to the 4-meter long walkway, there are initial and
final one meter inactive sections to allow for acceleration
and deceleration of the participant. The GaitMat II™ is an
automated gait analysis system based on the opening and
closing of pressure sensitive switches when the participant
walks on the walkway. After two practice passes on the
GaitMat, each subject completed two passes on the Gait-
Mat II at their self-selected walking speed for data
collection.
Journal of NeuroEngineering and Rehabilitation 2005, 2:21 />Page 3 of 8
(page number not for citation purposes)
We were primarily interested in gait speed and variability
of step length, step width, step time, and stance time. Step
length and width represent spatial characteristics in two
different planes. Step time and stance time were selected
as the temporal gait characteristics since they have been
widely studied by other investigators. Gait speed was
determined by dividing the time between the first and last
switch closure by the distance traversed. Step length was
determined as the distance between two consecutive foot-
prints, measured from the heel of one footprint to the heel
of the next footprint. Step width was determined as the
distance between the outer most borders of two consecu-
tive footprints. Step time was determined as the time
between initial foot-floor contact of one foot to the initial
foot-floor contact of the contralateral side for two consec-
utive steps. Stance time was determined as the time the
foot was in contact with the floor (i.e. from initial foot-
floor contact until final foot-floor contact).
Gait variability was expressed as the coefficient of varia-
tion (CV) which is SD/mean × 100. The CV for each step
length, step width, step time, and stance time was calcu-
lated using two passes on the GaitMat. Prior testing
showed no difference in right and left step CV, so both
were used to calculate the CV [10].
Fall History
Fall history over the past 12 months was obtained through
a structured interview. Participants were asked the follow-
ing: "During the past year, have you had a fall? (Do not
include falls during skiing, skating, or other activities,
such as walking on ice that may affect balance.)" Partici-
pants, who reported a fall, were then asked to report the
number of falls in the past year.
Data Analysis
Prior to data analyses the gait variability data were exam-
ined for normality. The gait variability data were relatively
normally distributed (mean values approximately equal
to median, low values for skewness and kurtosis). For step
width variability there were a few extreme outliers with
individuals having high values for step width variability.
The raw data were visually examined to make sure there
was not an error in data collection. The values were accu-
rate and were attributed to individuals crossing one foot
over the other when walking. Since these high values rep-
resented a natural phenomenon and were not due to data
collection error they were retained in the analyses. Inde-
pendent t-tests were used to compare the gait variability
data (step width, step length, stance time, and step time)
between the individuals who had reported a fall in the
past year and those who did not report a fall in the past
year for the entire sample and then stratifying by walking
speed (less than or greater than or equal to 1.0 m/s) [5,14-
16].
After discovering the large standard deviation associated
with the step width variability measure, we decided to
explore if the association between step width variability
and fall history was nonlinear. A simple four level classifi-
cation (quartiles) was used to explore the potential non-
linear association between step width variability and fall
history. Since the range of values for the lowest and high-
est quartile was much larger than the range of values for
the middle two quartiles we decided to explore the associ-
ation using a 10 level classification (deciles). Once again,
the range of values for the lowest and highest deciles were
much larger than the range of values for the middle 8
deciles so we further divided the sample by examining the
lowest and highest 5% of the sample in regards to step
width variability. The classification of step width variabil-
ity was collapsed into three groups: low step width varia-
bility (step width variability CV < 7%; lowest 5% of
sample), moderate step width variability (step width vari-
ability CV = 7–30%; middle 90% of sample), and high
step width variability (step width variability CV > 30%;
highest 5% of the sample). Fall history (% fallen in the
past year) was compared across the groups using chi-
square tests for the entire sample and then stratifying by
gait speed (less than or greater than or equal to 1.0 m/s).
A series of logistic regression models were used to exam-
ine the association between step width variability and fall
history. The first model examined the bivariate associa-
tion between step width variability and fall history. The
second model controlled for age and gender, and the third
model accounted for gait speed. The series of models was
calculated for the entire sample and then stratifying the
sample by gait speed (less than or greater than or equal to
1.0 m/s). An interaction between gait speed and step
width variability was also examined in the entire sample.
Initially, step width variability was examined as a 3 level
variable (low, moderate and high). However, after strati-
fying the sample by gait speed the numbers of subjects in
the low and high step width variability groups were low
(gait speed ≥ 1.0 m/s and low step width variability n = 3;
gait speed < 1.0 m/s and high step width variability n = 9)
so the models are presented with step width variability as
a dichotomous variable with step width either being
extreme (low or high) or moderate.
Results
Eighty-one (16%) of the 503 participants reported experi-
encing one or more falls in the past year (32 reported fall-
ing more than once). Individuals who had reported a fall
in the past year were slightly older, and more likely to be
female than individuals who had not fallen in the past
year (Table 1). The average gait speed for the sample was
1.03 m/s (SD = .21).
Journal of NeuroEngineering and Rehabilitation 2005, 2:21 />Page 4 of 8
(page number not for citation purposes)
In the entire sample, individuals who had reported a fall
in the past year did not differ on any of the measures of
gait variability when compared to individuals who had
not reported a fall (Table 2). Likewise, gait speed did not
differ between individuals who reported and did not
report a fall in the past year. When stratifying the sample
by gait speed, individuals who walked faster than 1.0 m/s
and reported a fall in the past year were more variable in
step width than individuals who had not fallen in the past
year (Table 3). In individuals who walked slowly (< 1.0
m/s) gait variability did not differ with respect to fall
history.
There was no association between step length, step time
and stance time variability groupings (quartiles or cut-
point based groupings) and fall history (p > .25). Step
Table 1: Characteristics of entire study cohort and stratifying by past year fall history
Total sample N = 503 No falls N = 422 ≥1 fall N = 81 P-value*
Age (years) 79.3 (4.1) 79.1 (3.9) 80.3 (5.1) .02
Weight (lbs) 154.9 (28.9) 154.8 (28.3) 155.0 (32.4) .96
Height (cm) 164.3 (9.3) 164.5 (9.4) 163.0 (9.0) .18
ADL difficulty n (%) 148 (29.4) 122 (28.9) 26 (32.1) .56
African American n (%) 113 (22.5) 93 (22.0) 20 (24.7) .80
Female n (%) 306 (60.8) 248 (58.8) 58 (71.6) .03
Gait Characteristics
Step width (m) 0.21 (.04) 0.22 (0.04) 0.21 (0.05) .46
Step length (m) 0.57 (0.09) 0.57 (0.09) 0.56 (0.10) .14
Stance time (s) 0.73 (0.09) 0.73 (0.09) 0.73 (0.10) .71
Step time (s) 0.56 (0.06) 0.56 (0.06) 0.56 (0.06) .81
Gait speed (m/s) 1.03 (0.21) 1.04 (.20) 1.02 (.23) .40
* P-values are for independent t-test comparing continuous data and chi square comparing categorical data between individuals who reported no
falls and those who reported ≥ 1 fall in the past year.
Table 2: Mean (SD) Gait Characteristics stratifying by past year fall history
No falls N = 422 ≥ 1 fall N = 81 p-value
Gait Variability CV* (%)
Step width 17.8 (16.4) 21.8 (22.6) .06
Step length 6.3 (3.0) 6.5 (3.1) .62
Stance time 4.9 (2.0) 5.2 (2.1) .33
Step time 4.7 (1.8) 4.7 (1.8) .90
*CV = coefficient of variation
Table 3: Mean (SD) gait characteristics stratifying by gait speed and past year fall history.
Gait Speed < 1.0 Gait Speed ≥ 1.0 m/s
No falls n = 185 ≥ 1 fall n = 37 p-value No falls n = 237 ≥ 1 fall n = 44 p-value
Gait Variability CV* (%)
Step width 15.6 (15.9) 15.7 (7.7) .95 19.6 (16.6) 26.8 (29.1) .02
Step length 7.5 (3.4) 7.7 (3.7) .77 5.4 (2.3) 5.5 (2.2) .77
Stance time 5.7 (2.3) 6.0 (2.3) .47 4.3 (1.5) 4.5 (1.5) .55
Step time 5.4 (1.7) 5.3 (2.1) .83 4.1 (1.6) 4.2 (1.3) .79
Gait speed (m/s) .85 (.11) .82 (.14) .11 1.18 (.13) 1.18 (.14) .98
*CV = coefficient of variation
Journal of NeuroEngineering and Rehabilitation 2005, 2:21 />Page 5 of 8
(page number not for citation purposes)
width variability examined as a three level categorical var-
iable (low, <7%; moderate 7–30%; or high, > 30%) was
associated with fall history in the entire sample (Figure
1A). Individuals with extreme step width variability
(either low or high) were more likely to report a fall in the
past year than individuals with moderate step width vari-
ability (p = .006); thus providing evidence that the associ-
ation between fall history and step width variability may
be nonlinear. The association remained in individuals
who walked faster than 1.0 m/s, p = .0008 (Figure 1B), but
was not significant in those who walked slowly, p = .39
(Figure 1C). The lack of significant findings in those indi-
viduals who walked slowly could possibly be attributed to
inadequate power due to the small sample size in the
extreme step width variability groups (low step width var-
iability n = 14 and high step width variability n = 9).
In the entire sample, after controlling for age, gender, and
gait speed, compared to individuals with moderate step
width variability individuals with low or high step width
variability were 2.76 times more likely to have fallen in
the past year (OR and 95% CI were 2.76 [1.40–5.45]). In
individuals who walked ≥ 1.0 m/s (n = 281), after control-
ling for age, gender, and gait speed, compared to individ-
uals with moderate step width variability individuals with
either low or high step width variability were 4.38 times
more likely to have fallen in the past year (OR and 95% CI
were 4.38 [1.79–10.72]). The association between step
width variability and fall history was not significant in
individuals who walked < 1.0 m/s (Table 4). In the entire
sample, the interaction term between gait speed and step
width variability was not significant (p = .16).
Discussion
This study of gait variability and fall history in commu-
nity-dwelling older individuals has two key findings. First,
among community-dwelling older persons ambulating
independently the association between step width varia-
bility and fall history was nonlinear. Consistently it has
been shown that increased variability of stride length,
stride time, and stride speed are related to falls [2,3,17],
where as decreased step width variability has been only
associated with falls during walking in one research report
[3]. The lack of significant findings associating step width
variability with fall history may be the result of assuming
a linear relationship between step width variability and
falls. For step width variability the normal situation is to
have a moderate amount of variability. We discovered
that not only having too little step width variability but
also having too much step width variability was associ-
ated with a history of falls.
Gabell and Nayak suggest that step width is related to bal-
ance control and that an increase in step width variability
could indicate a lack of compensation for instability [4].
Both young and older person who have not fallen demon-
strate an increased level of step width variability (median
step width variability in young and old is 20.62 and
26.84, respectively) compared to variability of other gait
characteristics such as step length (median step length
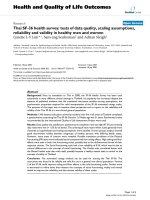
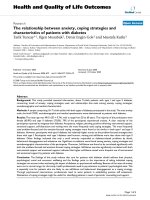
Percent of participants who reported a fall in the past year by amount of step width variability (low, moderate, or high) for (A) the entire sample, (B) individuals with a gait speed ≥ 1.0 m/s, and (C) individuals with a gait speed < 1.0 m/s (C)Figure 1
Percent of participants who reported a fall in the past year by
amount of step width variability (low, moderate, or high) for
(A) the entire sample, (B) individuals with a gait speed ≥ 1.0
m/s, and (C) individuals with a gait speed < 1.0 m/s (C). P-val-
ues are for Chi-square.
Low
(n=17)
Moderate
(n=457)
High
(n=31)
0
5
10
15
20
25
30
35
40
45
50
Step Width Variability
% Fallen Past Year
Low
(n=3)
Moderate
(n=256)
High
(n=22)
0
10
20
30
40
50
60
70
Step Width Variability
% F al len Pas t Year
Low
(n=14)
Moderate
(n=199)
High
(n=9)
0
5
10
15
20
25
30
35
40
45
50
Step Width Variability
% Fallen Past Year
(A)
(B)
(C)
P=0.006
P=0.0008
P=0.39
Journal of NeuroEngineering and Rehabilitation 2005, 2:21 />Page 6 of 8
(page number not for citation purposes)
variability in young and old is 5.41 and 5.31, respectively)
and stride time (median stride time variability in young
and old is 2.60 and 3.21, respectively), suggesting that a
moderate amount of step width variability is required to
adapt to the situation and to "stay on ones feet" [3,4].
Individuals who are unable to vary their step width (i.e.
individuals with low step width variability) may be lack-
ing the skills necessary to adjust their step width to main-
tain their balance. On closer inspection of the raw gait
data of individuals who vary their step width a lot (i.e.
individuals with high step width variability), high step
width variability was often associated with crossing one
foot over the other during walking, a gait deviation that
clinically is indicative of unsteady walking.
The second major finding is that step width variability was
associated to fall history only in people walking at a near
normal walking speed (>1.0 m/s) [5,14-16]. Gait speed
has previously been associated with fall status [5,6,9,18].
In people who walk slowly, fall risk may be due to numer-
ous abnormalities independent of step width variabil-
ity[7,19-23]. Our findings suggest that in individuals who
are not identified to be at risk for falls by their gait speed
(i.e. those walking at a near normal gait speed) variability
of step width may provide valuable information about fall
risk. In people walking at a near normal walking speed,
some degree of step width variability may be adaptive
where too little or excessive step width variability on a
simple non-challenging mat surface may be abnormal.
Excessive step width variability in a non-challenging situ-
ation (i.e. where adaptation is not necessary) could poten-
tially be an early indicator of fall risk in highly mobile
people.
Our findings are somewhat conflicting to other research
examining gait variability and falls. Specifically, we found
no association between fall history and variability of step
length, stance time and step time where others have
shown an association with similar gait characteristics[1-
3,17]. One potential explanation may be the way the gait
characteristics were measured in this study. Gait variabil-
ity was calculated from a limited number of steps, in most
cases less than twelve steps. Others that have shown an
association between stride time and swing time variability
have calculated variability using data from hundreds if
not thousands of steps [1,2,24,25]. Since the two method-
ologies, gait mat and pressure sensitive insoles, have yet to
be directly compared, we do not know if similar informa-
tion regarding gait variability is obtained. A major
strength of the methodology used was the ability to exam-
ine step width, a spatial gait characteristic. The methodol-
ogies that capture hundreds/thousands of steps are based
on temporal measures of gait and do not record the spatial
characteristics such as step width. Our methodology was
similar to that used in the research by Maki where they
showed an association between stride length, double
Table 4: Association of step width variability with past year fall history: Odds Ratios (95% Confidence interval) and Adjusted Odds
Ratios (95% Confidence interval) for age, gender and gait speed.
Model 1 Model 2 Model 3
Total Sample n = 503
Mod step width CV* N = 455 1 1 1
Low/High Step width CV N = 48 2.65 (1.36, 5.14) 2.70 (1.37, 5.31) 2.76 (1.40, 5.45)
Age (years) 1.08 (1.02, 1.14) 1.08 (1.02, 1.15)
Gender .55 (.33, .93) .51 (.30, .89)
Gait speed (m/s) 1.32 (.38, 4.63)
Speed < 1.0 m/s N = 222
Mod Step width CV N = 199 1 1 1
Low/High Step width CV N = 23 1.42 (.49, 4.08) 1.56 (.52, 4.70) 1.56 (.50, 4.79)
Age (years) 1.08 (1.00, 1.17) 1.08 (.99, 1.17)
Gender .42 (.17, 1.02) .38 (.15, .99)
Gait speed (m/s) .22 (.01, 4.33)
Speed ≥ 1.0 m/s N = 281
Mod Step width CV N = 256 1 1 1
Low/High Step width CV N = 25 4.35 (1.81, 10.47) 4.38 (1.79, 10.72) 4.38 (1.79, 10.72)
Age (years) 1.09 (1.00, 1.18) 1.09 (1.00, 1.19)
Gender .67 (.33, 1.33) .65 (.32, 1.31)
Gait speed (m/s) 1.62 (.12, 21.11)
*CV = coefficient of variation
Journal of NeuroEngineering and Rehabilitation 2005, 2:21 />Page 7 of 8
(page number not for citation purposes)
support time, and stride velocity variability and future
falls [3]. The discrepancy in findings may be partly
explained by the fact that on average both our total sam-
ple and our sub-sample of individuals walking slowly (i.e.
< 1.0 m/s) were walking faster then their sample (mean
gait speed our total sample = 1.03 m/s, mean gait speed
our sub-sample = 0.85 m/s, mean gait speed Maki's sam-
ple = 0.70 m/s).
Finally, it is important to note that we examined the asso-
ciation of gait variability to falls over the past year where
others have look at the association with future falls [2,3].
In actuality, the participants' gait was measured after the
person had fallen. Having experienced a fall, the partici-
pant may have changed the way they walked, possibly
walking slower since fear of falling is related to gait speed
[3], thus influencing the results. Classification of fall sta-
tus was based on the participants' remembering if they
had fallen during the past year. One of the limitations of
using past year fall status is the likelihood of recall error
which may lead to misclassification of the sample. Ideally,
we would have preferred to examine the association
between recurrent falls (i.e. falling 2 or more times in the
past year) and gait variability; however, only a limited
number of participants experienced more than one fall (n
= 32). When examining gait variability between individu-
als who had not fallen in the past year and those who had
reported falling two or more times in the past year the
results were similar to those reported; however they are
not presented given the limited power of the analyses.
It is important to note that the older persons included in
this study are relatively healthy. For example, the fall rate
of the sample (16%) is much lower than what is tradition-
ally reported for community-dwelling older persons. Also,
in order to be included in this study the individual had to
be a participant of an ongoing research study (i.e. CHS),
travel to the research clinic of the study examination, and
had to be able to walk independently without an assistive
device, all criteria that could potentially bias the sample
towards being healthier than the average community-
dwelling older person. However, this sample is ideal for
examining early indicators for fall risk that occur prior to
assistive device use and decreases in gait speed.
Conclusion
Extreme step width variability (i.e. either too much or too
little) is associated with fall history in older adults walking
at or near normal walking speed. Further research is
required to determine if extreme step width variability is a
predictor of falls in older persons without mobility
limitations.
Competing interests
The author(s) declare that they have no competing
interests.
Authors' contributions
JSB participated in the design of the study, carried out the
gait data collection, analyzed the data, and drafted the
manuscript. JEB participated in the data analyses and
manuscript preparation. JVS participated in the design of
the study, data analyses, and writing the manuscript. ABN
conceived of the study, participated in the design of the
study, data analyses and writing the manuscript. SAS par-
ticipated in the data analyses and writing of the
manuscript.
Acknowledgements
This research was funded by the National Institutes of Health Public Health
Service grant TG32 AG00181, and the National Institutes of Health con-
tracts N01-HC-85079 through 85085 and HL 87079 through 87086. At the
time of data collection JS Brach was supported in part by the National Insti-
tutes of Health Public Health Service grant TG 32AG00181. Currently, JS
Brach is supported by the University of Pittsburgh Older American's Inde-
pendence Center grant 1 P30 AG024827-01.
References
1. Hausdorff JM, Edelberg HK, Mitchell SL, Goldberger AL, Wei JY:
Increased gait unsteadiness in community-dwelling elderly
fallers. Arch Phys Med Rehabil 1997, 78:278-283.
2. Hausdorff JM, Rios DA, Edelberg HK: Gait variability and fall risk
in community-living older adults: a 1-year prospective study.
Arch Phys Med Rehabil 2001, 82:1050-1056.
3. Maki BE: Gait changes in older adults: predictors of falls or
indicators of fear? J Am Geriatr Soc 1997, 45:313-320.
4. Gabell A, Nayak USL: The effect of age and variability in gait.
Journal of Gerontology 1984, 39:662-666.
5. Imms FJ, Edholm OG: Studies of gait and mobility in the elderly.
Age and Ageing 1981, 10:147-156.
6. Wolfson L, Whipple R, Amerman P, Tobin JN: Gait assessment in
the elderly: A Gait Abnormality Rating Scale and its relation
to falls. J Gerontol 1989:M12-M19.
7. Lipsitz LA, Jonsson PV, Kelly MM, Koestner JS: Causes and corre-
lates of recurrent falls in ambulatory frail elderly. J Gerontol
1991, 46:M114-M122.
8. VanSwearingen JM, Paschal KA, Bonino P, Yang JF: The Modified
Gait Abnormality Rating Scale and recognizing recurrent
fall risk of community-dwelling, frail older veterans. Phys Ther
1996, 76:994-1002.
9. VanSwearingen JM, Pachal KA, Bonino P, Chen T: Assessing recur-
rent fall risk of community-dwelling, frail older veterans
using specific tests of mobility and the Physical Performance
Test of function. J Gerontol Med Sci 1998, 53:M457-M464.
10. Brach JS, Berthold R, Craik R, VanSwearingen JM, Newman A: Gait
variability on community-dwelling older adults. J Am Geriatr
Soc 2001, 49:1646-1650.
11. Tell GS, Fried LP, Hermanson B, Manolio TA, Newman A, Borhani
NO: Recruitment of adults 65 years and older as participants
in the cardiovascular health study. Ann Epidemiol 1993,
3:358-366.
12. LP F, Borhani NO, PL E, Furberg CD, Gardin JM, Kronmal RA, Kuller
LH, Manolio TA, Mittelmark MB, AB N, O'Leary DH, Psaty B, Rauta-
harju P, Tracy RP, Weler PG: The cardiovascular health
study:design and rationale. Ann Epidemiol 1991, 1:263-276.
13. Walsh JP: GaitAnalysis: Theory and Application. 1995:125-142.
14. Blanke DJ, Hageman PA: Comparison of gait of young and eld-
erly men. Phys Ther 1989, 69:144-148.
15. Hageman PA: Gait characteristics of healthy elderly: a litera-
ture review. Issues on Aging 1995, 18:14-18.
Publish with Bio Med Central and every
scientist can read your work free of charge
"BioMed Central will be the most significant development for
disseminating the results of biomedical research in our lifetime."
Sir Paul Nurse, Cancer Research UK
Your research papers will be:
available free of charge to the entire biomedical community
peer reviewed and published immediately upon acceptance
cited in PubMed and archived on PubMed Central
yours — you keep the copyright
Submit your manuscript here:
/>BioMedcentral
Journal of NeuroEngineering and Rehabilitation 2005, 2:21 />Page 8 of 8
(page number not for citation purposes)
16. Hageman PA, Blanke DJ: Comparison of gait of young women
and elderly women. Phys Ther 1986, 66:1382-1387.
17. Hausdorff JM, Edelberg HK, Cudkowicz ME, Fiatarone Singh MA, Wei
JY: The relationship between gait changes and falls. J Am Ger-
iatr Soc 1997, 45:1406.
18. VanSwearingen JM, Paschal KA, Bonino P, Yang JF: The Modified
Gait Abnormality Rating Scale and recognizing recurrent
fall risk of coomunity-dwelling, frail older veterans. Phys Ther
1996, 76:994-1002.
19. Campbell A, Borrie MJ, Spears GF: Risk factors for falls in a com-
munity-based prospective study of people 70 years and
older. J Gerontol 1989, 44:112-117.
20. Nevitt MC, Cummings SR, Kidd S, al : Risk factors for recurrent
nonsyncopal falls: a prospective study. JAMA 1989,
261:2663-2668.
21. Nevitt MC, Cummings SR, Hudes ES: Risk factors for injurious
falls: a prospective study. Journal of Gerontology: Medical Sciences
1991, 46:M164-M170.
22. Studenski S, Duncan PW, Chandler J, al : Predicting falls: the role
of mobility and nonphysical factors. J Am Geriatr Soc 1994,
42:297-302.
23. Tinetti ME, Speechley M, Ginter SF: Risk factors for falls among
elderly persons living in the community. New Engl J Med 1988,
319:1701-1707.
24. Hausdorff JM, Purdon P, Peng CK, Ladin Z, Wei JY, Goldberger AL:
Fractal dynamics of human gait: stability of long-range cor-
relations in stride interval fluctuations. J Appl Physiol 1996,
80:1448-1457.
25. Hausdorff JM, Ladin Z, Wei JY: Footswitch system for measure-
ment of the temporal parameters of gait. J Biomechanics 1995,
28:347-351.