báo cáo hóa học: " A kinematic analysis of a haptic handheld stylus in a virtual environment: a study in healthy subjects" pptx
Bạn đang xem bản rút gọn của tài liệu. Xem và tải ngay bản đầy đủ của tài liệu tại đây (488.19 KB, 8 trang )
BioMed Central
Page 1 of 8
(page number not for citation purposes)
Journal of NeuroEngineering and
Rehabilitation
Open Access
Methodology
A kinematic analysis of a haptic handheld stylus in a virtual
environment: a study in healthy subjects
Jurgen Broeren*
1,2
, Katharina S Sunnerhagen
†1
and Martin Rydmark
†2
Address:
1
Rehabilitation medicine, Institute of Neuroscience and Physiology, The Sahlgrenska Academy at Göteborg University, Guldhedsgatan
19, Göteborg, Sweden and
2
Mednet – Medical Informatics & Computer Assisted Education, Institute of Biomedicine, The Sahlgrenska Academy at
Göteborg University, Box 420 Göteborg, Sweden
Email: Jurgen Broeren* - ; Katharina S Sunnerhagen - ;
Martin Rydmark -
* Corresponding author †Equal contributors
Abstract
Background: Virtual Reality provides new options for conducting motor assessment and training
within computer-generated 3 dimensional environments. To date very little has been reported
about normal performance in virtual environments. The objective of this study was to evaluate the
test-retest reliability of a clinical procedure measuring trajectories with a haptic handheld stylus in
a virtual environment and to establish normative data in healthy subjects using this haptic device.
Methods: Fifty-eight normal subjects; aged from 20 to 69, performed 3 dimensional hand
movements in a virtual environment using a haptic device on three occasions within one week.
Test-retest stability and standardized normative data were obtained for all subjects.
Results: No difference was found between test and retest. The limits of agreement revealed that
changes in an individual's performance could not be detected. There was a training effect between
the first test occasion and the third test occasion. Normative data are presented.
Conclusion: A new test was developed for recording the kinematics of the handheld haptic stylus
in a virtual environment. The normative data will be used for purposes of comparison in future
assessments, such as before and after training of persons with neurological deficits.
Background
Virtual Reality (VR) technology provides new options for
conducting motor assessment and training within compu-
ter-generated 3 dimensional (3D) environments for per-
sons with stroke and other diagnoses with motor deficits
such as cerebral palsy, parkinson's disease or multiple
sclerosis [1-6]. Findings in many studies suggest that train-
ing in a virtual environment has effects and indicate
improvements in functional abilities. The advantages of
VR are its possibility to provide both a systematic training
arena and an assessment tool [7]. The potential of VR to
identify the underlying deficit can facilitate the planning
of clinically relevant intervention programmes targeted at
a specific deficit. In addition, the accuracy of the compu-
terized assessment can be used to measure progress objec-
tively and to isolate more subtle aspects in patients with
neurological diseases [8]. Evaluating the effect of an inter-
vention where semi-subjective evaluations of current
approaches cannot discriminate changes could be a key
factor in outcome measures for rehabilitation. Most stud-
ies use matched controls to compare the performance
with patients or to identify characteristics of the interven-
Published: 9 May 2007
Journal of NeuroEngineering and Rehabilitation 2007, 4:13 doi:10.1186/1743-0003-4-13
Received: 2 May 2006
Accepted: 9 May 2007
This article is available from: />© 2007 Broeren et al; licensee BioMed Central Ltd.
This is an Open Access article distributed under the terms of the Creative Commons Attribution License ( />),
which permits unrestricted use, distribution, and reproduction in any medium, provided the original work is properly cited.
Journal of NeuroEngineering and Rehabilitation 2007, 4:13 />Page 2 of 8
(page number not for citation purposes)
tion used. The findings allow us to decide whether the
results from patients are due to the impairment or if they
are poorer/better then the matched controls.
In a recent study by Viau [9], a VR task was validated as a
tool for studying arm movements in healthy and stroke
subjects by comparing movement kinematics in a virtual
environment and in the physical world. They concluded
that both healthy and stroke subjects used similar move-
ment strategies. However, the differences in movements
made by healthy subjects in the two environments could
be explained by the absence of haptic feedback and the
use of a 2 dimensional environment instead of 3D virtual
environment [9]. Bardorfer and colleagues [10] con-
ducted a study in patients with neurological diseases for
hand motion analysis using the PHANTOM Premium 1.5-
haptic interface (rendering sensory feedback). They evalu-
ated a test for kinematic analysis to measure motor abili-
ties. Since the wrist was unsupported during
measurements, the arm was evaluated as a whole. The
study demonstrated that this haptic interface was suitable
for the Upper Extremity (UE) assessment for persons with
neurological impairments. The authors further concluded
that the results were objective and repeatable. [10].
In our research, we use a semi-immersive workbench with
force feedback provided by a haptic device (yielding sen-
sory feedback) to develop a precise quantitative kinematic
assessment tool and a training device for hand movement
in healthy subjects and in victims with neurological
impairments, especially for stroke patients [11,12].
To date very little has been reported on normal perform-
ance in VR environments concerning arm function. The
aims of the present study are 1) to investigate whether any
learning effects were achieved by repeating tests and 2) to
develop normative data on 3-dimensional hand trajecto-
ries in a virtual environment for healthy subjects.
Methods
Subjects
The study included 58 healthy adults (right-hand domi-
nant), 30 females and 28 males, mainly hospital or uni-
versity employees. We sought persons who were novel VR
users, i.e. did not work with VR equipment. The controls
were recruited via direct contact, person to person, by tel-
ephone or by mail, or via their work manager. The age of
the subjects ranged from 20 to 69 years with a mean of
42.8 years. Inclusion criteria were: no history of brain dys-
function according to history, no psychiatric illness or
substance abuse, no dyslexia, Swedish as first language, no
serious visual (including colour blindness and squinting)
or hearing impairment, no acute illness and right hand
dominant.
All subjects underwent a neuropsychological examination
with the Barrow Neurological Institute Screen for Higher
Cerebral function (BNIS) to confirm normal cognitive
function. The BNIS [13] is a short screening test developed
to systematically assess a variety of higher cerebral func-
tions. It examines: language functions, orientation to per-
son, place, and time; learning and memory skills; visual
object recognition; right-left orientation; concentration;
visual scanning and the presence or absence of hemi-inat-
tention; the capacity to detect and manipulate informa-
tion sequentially, constructional praxis; pattern
recognition, affect expression, perception and control,
and awareness of memory impairment.
All gave their written informed consent to participate and
the study was approved by the Ethics Committee at Göte-
borg University (S549-03).
Instrumentation
The VR environment consists of a semi-immersive work-
bench in which a stereo display and haptic feedback tech-
nology are combined into a form in which the user looks
and reaches into a virtual space. A haptic device gives the
impression of sensation feedback to the users when
touching virtual objects. This gives the user the ability to
interact with objects by touching, and moving their hand.
A precise and detailed recording of hand movements is
therefore possible. The PHANTOM
®
Desktop™ haptic
device
is a desk mounted robot
sampling at 1000 Hz with 6 degrees of freedom. Here, we
resampled the haptic x, y, and z data at 47–52 Hz. In this
instance, the force feedback workspace was ~ 160 W × 120
H × 120 D mm.
Procedure
We administered an arm test developed in a previous
study [12]. The subjects had to move the haptic stylus to
different targets (#32) in the virtual world generated by
the computer. The targets appeared one after the other
and disappeared when pointed at. Each target consists of
a whole circle (diameter ~ 3.0° viewing angle). The target
placements (#32) in the 3D space were apparently ran-
dom to the subjects but were actually set according to a
pre-set kinematic scheme for evaluation purposes. All
tests were time stamped, giving the basic pattern of hand
movement. The subjects were tested in three sessions
within one week; each session consisted of three trials
with two different handgrips. Two types of handgrip pos-
tures were studied, i.e. pen grip and cylinder grip. In this
study a pen grip means that the haptic stylus is sur-
rounded by the thumb, index and middle finger. A cylin-
der grip means that the haptic stylus is held in the palm,
with the thumb against the four fingers. The procedure
was standardized concerning sitting position and instruc-
tions in each test. The subjects were seated comfortably on
Journal of NeuroEngineering and Rehabilitation 2007, 4:13 />Page 3 of 8
(page number not for citation purposes)
a chair without an armrest, and both forearms rested in a
neutral position on the table working with the arm unsup-
ported. They were then instructed to pick up the haptic
stylus first with a pen grip; this test was repeated three
times. They were subsequently tested with the cylinder
grip, and this test was also repeated three times. A 30 sec-
ond rest between tests was allowed to reduce any possible
fatigue effect. When the haptic stylus was picked up, a tar-
get became visible on the computer screen. The test started
when the first target was pointed at. Each subject was
asked to move as accurately and quickly as possible to
each target. The assessment started as soon as the subject
pointed at the first target.
All participants were tested between 10 AM and 4 PM. All
tests were performed with the right hand.
Data analysis
Kinematic data sampling and information processing
Hand position data (haptic stylus end-point) were gath-
ered during each trial. The x-, y- and z-coordinates, which
were time stamped, gave the basic pattern of hand move-
ment. Time and distance to complete the whole exercise
were also recorded, as this velocity was calculated. Move-
ment quality was computed from the distance value. This
is the distance traversed by the haptic stylus, calculating
the length of the pathway divided by the straight line dis-
tance required to obtain a hand path ratio (HPR). Thus, a
hand trajectory that followed a straight line pathway to
the target would have an HPR equal to 1, whereas a hand
trajectory that travelled twice as far as needed would have
a HPR of 2.
Subsequently, the 3D kinematics of hand movement was
visualized for one selected identical target-to-target move-
ment for all subjects. In this case the midpoint trajectory
of the trial was chosen, i.e. moving the haptic stylus from
the one target to the next target. It should be emphasized
that each subject generates approximately 288 (3 × 32 × 3)
target-to-target movements through the entire dataset for
each handgrip. This movement reflects a reaching move-
ment (diagonally upwards, forward) in the physical envi-
ronment.
For kinematical analysis of the target-to-target movement,
the following were calculated: (1) time, (2) HPR, (3) max
velocity (m/s) and (4) max acceleration (m/s
2
). In this
case we used the second and third trials in the first test ses-
sion.
Statistical analysis
Test-retest consistency
The consistency between test and retest was evaluated
with the 95% limits of agreement (LOA) method [14,15].
In this case we used the second and third trials in the first
and the third test sessions (this method calculated the
limits within which we expected the differences between
two measurements by the same method to lie). To assess
possible learning effects we used the Wilcoxon signed-
rank test for paired scores between test sessions 1 and 3.
Normative data
We used the second and third trials in the first test session
to establish normative data. Descriptive statistics, i.e.
mean, standard deviations, median and 2.5-10-25-75-90-
97.5 percentiles for the whole exercise and for the specific
target-to-target movement, were calculated.
Results
Younger vs. older subjects
We examined the performance of the subjects by dividing
them into two different age groups, i.e. younger adults
(20–-44 years) and older adults (45–69). There were no
significant differences in measures between the two
groups for the whole exercise, and we decided to treat the
material as a single age group.
Test-retest consistency
The mean differences between the test-retest, SD of differ-
ence and 95 % limits of agreement (LOA) were calculated
Table 1: Test-retest consistency for sessions 1 and 3 for the cylinder and pen grips (n = 58). The mean differences between test and
retest and 95% limits of agreement (LOA) for Time, Hand Path Ratio (HPR) and Velocity are given.
Cylinder grip Pen grip
Mean difference* 95% LOA Mean difference* 95% LOA
Session 1 Time (s) 2.14 - 8.83 +13.10 1.92 - 6.14 + 9.99
HPR 0.07 - 0.35 + 0.49 0.07 - 0.26 +0.40
Velocity (m/s) 0.00 - 0.06 +0.06 - 0.01 -0.04 + 0.04
Session 3 Time (s) 1.22 -6.20 + 9.74 1.22 - 4.24 + 6.68
HPR 0.02 - 0.32 + 0.41 0.02 - 0.39 + 0.42
Velocity (m/s) -0.01 - 0.08 + 0.06 -0.01 - 0.07 + 0.05
* Difference between subtests 2 and 3
Journal of NeuroEngineering and Rehabilitation 2007, 4:13 />Page 4 of 8
(page number not for citation purposes)
for the selected variables, shown in Table 1 (session 1).
The Bland and Altman plots for the different parameters
illustrating the test-retest agreement for both handgrips
are shown in Figure 3. The assumptions of LOA were com-
pared against the average of two measurements. The dif-
ferences did not vary in any systematic way in both
assessments and the two different grip types. All measure-
ments were within the 95% limits of agreement. The anal-
ysis between session 1 and session 3 indicated a learning
effect. The Wilcoxon signed-rank test for paired scores
revealed that session difference was significant for all
tested variables, p < 0.01 (Table 2). We then again tested
for test-retest stability but this time within the second and
third trials in the third test session (Table 1, session 3).
The results also showed here no large variation in the two
different grip types. All measurements were within the
95% limits of agreement.
Table 3 give the mean (SD), median and percentiles (2.5-
10-25-75-90-97.5) for time (s), HPR and velocity (m/s)
for the cylinder and pen grips. Time (s), p = 0.01 increased
with the pen grip as compared to the cylinder grip. In con-
trast, velocity (m/s), p = 0.03 and HPR, p = 0.18, did not
have any significant effect on the difference in holding the
haptic handheld stylus.
Detailed recording of hand movements
The visual inspection of the detailed x-, y-, z-graphs for the
hand trajectories for one target-to-target movement
revealed a greater variability in movement pattern for the
cylinder grip as compared to the pen grip. Data from ten
"typical" subjects (5 females and 5 males) are presented in
Figure 5.
The mean, median and percentiles (2.5-10-25-75-90-
97.5) for movement durations, max velocity and max
acceleration for the cylinder and pen grips are shown in
Table 4. There were no differences between the cylinder
grip and pen grip regarding time (s), HPR, max velocity
(m/s) and max acceleration (m/s
2
), p > 0.01.
Discussion
The purpose of this study was to describe a novel tech-
nique for hand movement patterns analysis. The advan-
Table 3: Percentiles for Time (s), Hand Path Ratio and Velocity (m/s) for Cylinder and Pen (whole exercise).
Cylinder grip Pen grip
Time (s) HPR Velocity (m/s) Time (s) HPR Velocity (m/s)
Mean (SD) 34.95 (8.59) 1.77 (0.35) 0.25 (0.08) 37,49 (9.62) 1.86 (0.45) 0.25 (0.07)
Median 33.1 1.66 0.24 35.6 1.73 0.24
2,5 23.0 1.40 0.12 24.6 1.39 0.12
10 26.6 1.42 0.16 29.0 1.48 0.16
Percentiles 25 29.4 1.54 0.20 30.7 1.60 0.19
75 39,4 1,94 0.30 42.3 2.00 0.28
90 45,8 2,42 0.38 45.1 2.28 0.35
97.5 71,6 2,97 0.45 74.1 3.61 0.44
Table 2: Changes in mean between tests 1 and 3 for Time (s), Hand Path Ratio (HPR) and Velocity (m/s) for the cylinder and pen grip.
Cylinder grip Pen grip
Session 1
Mean (SD)
Session 3
Mean (SD)
p value Session 1
Mean (SD)
Session 3
Mean (SD)
p value
Time (s) 34.95 (8.59) 28,78 (6,07) 0.0001 37,49 (9.62) 30,14 (7,92) 0.001
HPR 1.77 (0.35) 1,69 (0.27) 0.001 1.86 (0.45) 1,77 (0.33) 0.01
Velocity (m/s) 0.25 (0.08) 0.29 (0.08) 0.0001 0.25 (0.07) 0.29 (0.09) 0.001
Journal of NeuroEngineering and Rehabilitation 2007, 4:13 />Page 5 of 8
(page number not for citation purposes)
tages of the proposed system are that it has the potential
to take a single measurement that takes less than one
minute and produce kinematic data. Further, the meas-
ures are objective and repeatable and provide quantitative
data [10].
The results of this study indicate good test-retest reliability
of the assessment. The use of multiple trials was recom-
mended by Mathiowetz et al. [16] to improve test-retest
reliability. The difference between sessions 1 and 3 does
suggest a possible learning effect, which we consider to be
advantageous. However, this effect is desirable when
patients are training, and this information thus identifies
the importance of having normative data to compare
with.
A standardized test was developed for two different grip
types. The cylinder grip was chosen so that the required
movement would replicate the natural-world action of
holding a handle. Secondly, many stroke victims' fine
motor control with the hand and fingers is often impaired
in the chronic stage of their disease [17], and the cylinder
grip is then easier to use. The pen grip was chosen for the
reason that it is a precision grip and enables the person to
carry out a wide range of movements when using tools
[18].
The data presented for the whole exercise on time, HPR
and velocity showed no differences between the different
grip types. This can be explained by the fact that a homo-
geneous group of subjects was investigated here, reducing
the inter subject variability and thereby improving relia-
bility measures. The x-, y-, z-graphs from the target-to-tar-
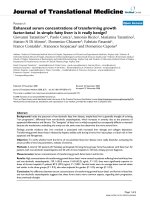
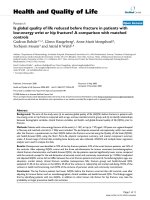
Semi – immersive workbench
, with haptic device and stereoscopic shutter glassesFigure 1
Semi – immersive workbench
, with
haptic device and stereoscopic shutter glasses.
Table 4: Percentiles for Time (s), Hand Path Ratio, and Max Velocity (m/s) and Max acceleration (m/s
2
), for cylinder- and pen grip
(target-to-target).
Cylinder grip Pen grip
Time (s) HPR Max Vel (m/s) Max Acc (m/s
2
) Time (s) HPR Max Vel (m/s) Max Acc (m/s
2
)
Mean (SD) 0.99 (0.41) 0.72 (0.16) 0.54 (0.19) 0.17 (0.13) 1.05 (0.44) 0.71 (0.16) 0.52 (0.17) 0.16 (0.11)
Median 0.90 0.78 0.51 0.12 0.93 0.76 0.48 0.13
2,5 0.46 0.28 0.28 0.05 0.47 0.31 0.28 0.06
10 0.57 0.44 0.34 0.07 0.70 0.43 0.35 0.07
Percentiles 25 0.70 0.66 0.43 0.08 0.80 0.63 0.41 0.09
75 1.13 0.84 0.60 0.19 1.13 0.82 0.60 0.17
90 1.54 0.87 0.73 0.33 1.61 0.87 0.73 0.31
97.5 2,33 0.91 1.08 0.65 2.36 0.91 1.00 0.51
Journal of NeuroEngineering and Rehabilitation 2007, 4:13 />Page 6 of 8
(page number not for citation purposes)
get movement in the different grip types were diverse. It
seems that the hand path trajectories with the cylinder
grip were more distributed, i.e. more dispersed within the
workspace, than the pen grip movements, which were
more arched and concentrated. When the subjects used
the pen grip, the hand trajectories were more arched; this
was not shown in the HPR measure, where the difference
between the two grips was not significant. The velocity vs.
time and the acceleration vs. time graphs indicate the pos-
sibility of saccade-like patterns of movement, with great
inter-individual variability, but no clear difference was
observed between subjects or grip types.
Evaluating the effects of therapy for rehabilitation practice
is important both for rehabilitation personal and patients.
Characterizing the features of reaching and quantifying
specific variables allows therapists to treat specific deficits
[19].
The normative data collected in this study will be used in
a clinical evaluation unit (database), which will allow
rehabilitation staff to measure and monitor patients' per-
formance during assessment runs. All assessments will, by
default, generate time-stamped motion data (x, y, z, yaw,
pitch, roll and target press information) at 1000 Hz. These
data are stored together with time/date and subject infor-
mation for subsequent analysis.
Conclusion
A new test was developed for UE performance in a virtual
environment. The study demonstrates that it is feasible to
collect a 3D quantitative kinematic measure in real time.
Furthermore, these data can be stored in a database. Uti-
lizing this system, the values of the progress in the exer-
cises can easily be stored and re-accessed for further
examination and evaluation.
Competing interests
The author(s) declare that they have no competing inter-
ests.
Authors' contributions
JB carried out the study, drafted the manuscript and made
the statistical analyses. KSS and MR participated in its
design and co-ordination and helped to draft the manu-
script and make the statistical analyses.
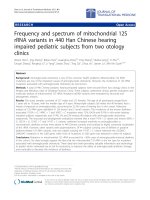
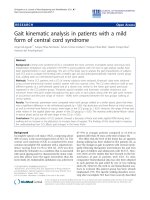
A screenshot of the stimuliFigure 3
A screenshot of the stimuli.
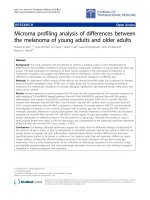
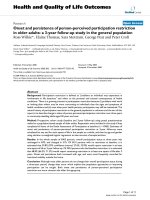
Different handgrip postures, cylinder grip (left) and pen grip (right)Figure 2
Different handgrip postures, cylinder grip (left) and pen grip (right).
Journal of NeuroEngineering and Rehabilitation 2007, 4:13 />Page 7 of 8
(page number not for citation purposes)
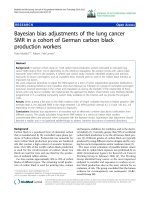
Scatter-plot of the difference between the second and third measure for Time, Hand Path Ratio (HPR) and Velocity within the first test session (n = 58) for cylinder and pen gripFigure 4
Scatter-plot of the difference between the second and third measure for Time, Hand Path Ratio (HPR) and Velocity within the
first test session (n = 58) for cylinder and pen grip. The horizontal lines indicate the mean difference (middle) and the upper
and lower limits of agreement.
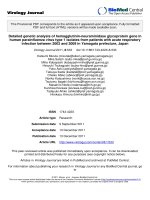
Detailed x-, y-, z-plot for the hand trajectories of ten subjects for one button to button movementFigure 5
Detailed x-, y-, z-plot for the hand trajectories of ten subjects for one button to button movement. Left figure cylinder grip and
right figure pen grip.
Publish with BioMed Central and every
scientist can read your work free of charge
"BioMed Central will be the most significant development for
disseminating the results of biomedical research in our lifetime."
Sir Paul Nurse, Cancer Research UK
Your research papers will be:
available free of charge to the entire biomedical community
peer reviewed and published immediately upon acceptance
cited in PubMed and archived on PubMed Central
yours — you keep the copyright
Submit your manuscript here:
/>BioMedcentral
Journal of NeuroEngineering and Rehabilitation 2007, 4:13 />Page 8 of 8
(page number not for citation purposes)
Acknowledgements
We wish to thank all subjects for their collaboration. We also thank Hans
Aniansson for carrying out the neuropsychological examinations, Sara and
Lisa Broeren for drawing velocity and acceleration profiles and Ragnar
Pascher for programming the software. This study was in part supported by
the Swedish Stroke Victims Association, the Hjalmar Svensson Research
Foundation, Amlöv foundation, Wennerströms foundation, Per Olof Ahl
foundation, the Göteborg Foundation for Neurological Research, the Fed-
eration of Swedish County Councils (VG region), the Trygg-Hansa insur-
ance company, the Swedish Research Council (VR K2002-27-VX-14318-
01A) and VINNOVA (2004-02260).
References
1. Holden MK: Virtual environments for motor rehabilitation:
review. Cyberpsychol Behav 2005, 8(3):187-211.
2. Sveistrup H: Motor rehabilitation using virtual reality. J Neuro-
engineering Rehabil 2004, 1(1):10.
3. Weiss P, Rand D, Katz N, Kizony R: Video capture virtual reality
as a flexible and effective rehabilitation tool. Journal of Neuro-
Engineering and Rehabilitation 2004, 1(1):12.
4. Baram Y, Miller A: Virtual reality cues for improvement of gait
in patients with multiple sclerosis. Neurology 2006,
66(2):178-181.
5. You SH, Jang SH, Kim YH, Kwon YH, Barrow I, Hallett M: Cortical
reorganization induced by virtual reality therapy in a child
with hemiparetic cerebral palsy. Dev Med Child Neurol 2005,
47(9):628-635.
6. Albani G, Pignatti R, Bertella L, Priano L, Semenza C, Molinari E, Riva
G, Mauro A: Common daily activities in the virtual environ-
ment: a preliminary study in parkinsonian patients. Neurol Sci
2002, 23 Suppl 2:S49-50.
7. Rizzo AA, Wiederhold M, Buckwalter JG: Basic issues in the use of
virtual environments for mental health applications. Stud
Health Technol Inform 1998, 58:21-42.
8. Rizzo AA, Kim GJ: A SWOT Analysis of the Field of Virtual
Rehabilitation and Therapy. In Presence: Teleoperators and Virtual
Environments 2005, Volume 14( 2):119-146.
9. Viau A, Feldman AG, McFadyen BJ, Levin MF: Reaching in reality
and virtual reality: a comparison of movement kinematics in
healthy subjects and in adults with hemiparesis. J Neuroengi-
neering Rehabil 2004, 1(1):11.
10. Bardorfer A, Munih M, Zupan A, Primozic A: Upper Limb Motion
Analysis Using Haptic Interface. IEE Transactions on Mechatronics
2001, 6(3):253-260.
11. Broeren J, Bjorkdahl A, Pascher R, Rydmark M: Virtual reality and
haptics as an assessment device in the postacute phase after
stroke. Cyberpsychol Behav 2002, 5(3):207-211.
12. Broeren J, Rydmark M, Sunnerhagen KS:
Virtual reality and hap-
tics as a training device for movement rehabilitation after
stroke: a single-case study. Arch Phys Med Rehabil 2004,
85(8):1247-1250.
13. Denvall V, Elmstahl S, Prigatano GP: Replication and construct
validation of the Barrow Neurological Institute Screen for
Higher Cerebral Function with a Swedish population. J Reha-
bil Med 2002, 34(4):153-157.
14. Bland JM, Altman DG: Statistical methods for assessing agree-
ment between two methods of clinical measurement. Lancet
1986, 1(8476):307-310.
15. Bland JM, Altman DG: Applying the right statistics: analyses of
measurement studies. Ultrasound Obstet Gynecol 2003,
22(1):85-93.
16. Mathiowetz V, Volland G, Kashman N, Weber K: Adult norms for
the Box and Block Test of manual dexterity. Am J Occup Ther
1985, 39(6):386-391.
17. Hermsdorfer J, Hagl E, Nowak DA, Marquardt C: Grip force con-
trol during object manipulation in cerebral stroke. Clin Neu-
rophysiol 2003, 114(5):915-929.
18. Flanagan JR, Johansson RS: Hand movements . In Ecyclopedia of
human brain Volume 2. Edited by: Ramachandran VS. San Diego, CA ,
Academic Press; 2002:399-414.
19. Kamper DG, McKenna-Cole AN, Kahn LE, Reinkensmeyer DJ: Alter-
ations in reaching after stroke and their relation to move-
ment direction and impairment severity. Arch Phys Med Rehabil
2002, 83(5):702-707.