báo cáo hóa học: " Locomotor adaptation to a powered ankle-foot orthosis depends on control method" ppt
Bạn đang xem bản rút gọn của tài liệu. Xem và tải ngay bản đầy đủ của tài liệu tại đây (567.35 KB, 13 trang )
BioMed Central
Page 1 of 13
(page number not for citation purposes)
Journal of NeuroEngineering and
Rehabilitation
Open Access
Research
Locomotor adaptation to a powered ankle-foot orthosis depends on
control method
Stephen M Cain*
1,4
, Keith E Gordon
2,4
and Daniel P Ferris
1,2,3,4
Address:
1
Department of Biomedical Engineering, University of Michigan, 1107 Carl A. Gerstacker, 2200 Bonisteel Blvd., Ann Arbor, MI 48109-
2099, USA,
2
Division of Kinesiology, University of Michigan, 401 Washtenaw Avenue, Ann Arbor, MI 48109-2214, USA,
3
Department of Physical
Medicine and Rehabilitation, University of Michigan, Ann Arbor, MI 48109, USA and
4
Human Neuromechanics Laboratory, University of
Michigan, 401 Washtenaw Avenue, Ann Arbor, MI 48109-2214, USA
Email: Stephen M Cain* - ; Keith E Gordon - ; Daniel P Ferris -
* Corresponding author
Abstract
Background: We studied human locomotor adaptation to powered ankle-foot orthoses with the
intent of identifying differences between two different orthosis control methods. The first orthosis
control method used a footswitch to provide bang-bang control (a kinematic control) and the
second orthosis control method used a proportional myoelectric signal from the soleus (a
physiological control). Both controllers activated an artificial pneumatic muscle providing plantar
flexion torque.
Methods: Subjects walked on a treadmill for two thirty-minute sessions spaced three days apart
under either footswitch control (n = 6) or myoelectric control (n = 6). We recorded lower limb
electromyography (EMG), joint kinematics, and orthosis kinetics. We compared stance phase EMG
amplitudes, correlation of joint angle patterns, and mechanical work performed by the powered
orthosis between the two controllers over time.
Results: During steady state at the end of the second session, subjects using proportional
myoelectric control had much lower soleus and gastrocnemius activation than the subjects using
footswitch control. The substantial decrease in triceps surae recruitment allowed the proportional
myoelectric control subjects to walk with ankle kinematics close to normal and reduce negative
work performed by the orthosis. The footswitch control subjects walked with substantially
perturbed ankle kinematics and performed more negative work with the orthosis.
Conclusion: These results provide evidence that the choice of orthosis control method can
greatly alter how humans adapt to powered orthosis assistance during walking. Specifically,
proportional myoelectric control results in larger reductions in muscle activation and gait
kinematics more similar to normal compared to footswitch control.
Introduction
Advancements in robotic technology have enabled several
research groups around the world to build working
robotic exoskeletons for assisting human locomotion [1-
8]. The exoskeletons have a range of intended uses includ-
ing enhancing human performance in healthy individu-
als, replacing motor capabilities in disabled individuals,
and aiding in neurological rehabilitation. In each case,
Published: 21 December 2007
Journal of NeuroEngineering and Rehabilitation 2007, 4:48 doi:10.1186/1743-0003-4-48
Received: 7 March 2007
Accepted: 21 December 2007
This article is available from: />© 2007 Cain et al; licensee BioMed Central Ltd.
This is an Open Access article distributed under the terms of the Creative Commons Attribution License ( />),
which permits unrestricted use, distribution, and reproduction in any medium, provided the original work is properly cited.
Journal of NeuroEngineering and Rehabilitation 2007, 4:48 />Page 2 of 13
(page number not for citation purposes)
improvements in computer processing, energy efficiency,
and sensors and actuators are allowing devices to far sur-
pass previous expectations.
In order for robotic exoskeletons to better assist humans,
it is imperative to determine how humans respond to
mechanical assistance given by exoskeletons. Most of the
published research has focused on hardware and software
development. Few studies have actually measured human
motor adaptation or physiological responses when using
the devices. The human response is a key aspect that deter-
mines the success of the exoskeleton. Different exoskele-
ton control methods could produce extremely different
levels of adaptation and adaptation rate, meaning that
certain control schemes could prevent a user from effec-
tively using an exoskeleton.
One of the main factors likely affecting how humans
respond to mechanical assistance from an exoskeleton is
the method of control. A wide range of control algorithms
have been used by different research groups. They can rely
on kinematic, kinetic, or myoelectric feedback, or some
combination of these [3,7-15]. Because each research
group has their own custom-built hardware along with
their own control algorithm, it would be difficult to sepa-
rate the effects of controller from hardware even if human
response results were readily available in the literature.
We developed a single-joint ankle exoskeleton (i.e. pow-
ered ankle-foot orthosis) that can supply mechanical
plantar flexion assistance during walking [14-17]. For this
study, we studied locomotor adaptation in healthy sub-
jects walking with the powered ankle-foot orthosis using
two different orthosis control methods. By using the same
exoskeleton to evaluate each orthosis control method, we
can separate the effects of the controller from the hard-
ware. One group of subjects used footswitch control that
activated the orthosis when the forefoot made contact
with the ground [16]. A second group of subjects used
proportional myoelectric control that activated the ortho-
sis based on soleus electromyography amplitude [14,18].
The two orthosis control methods were chosen based on
our previous experience and familiarity with how they
could be used with our specific exoskeleton. The foots-
witch control is a simple and purely kinematic/kinetic
orthosis control method, depending only upon the gait
kinematics of the subject and the forces acting on the foot
during gait. The proportional myoelectric control is an
orthosis control method depending only upon the sub-
ject's motor commands.
The purpose of this study was to directly compare human
responses to a robotic exoskeleton using two different
orthosis control methods. The two control methods affect
the relationship of the efferent signal to movement in dif-
ferent ways. In footswitch control the supplied exoskele-
ton torque and the efferent signal are not well related –
existence of muscle activation or motor commands does
not guarantee that the exoskeleton is producing torque. In
proportional myoelectric control, the supplied exoskele-
ton torque is related directly to the motor command. We
hypothesized that different control methods (footswitch
versus proportional myoelectric) used to control a pow-
ered ankle-foot orthosis would produce differences in
how subjects adjusted gait kinematics and muscle activa-
tion to adapt to the powered exoskeleton.
Methods
Twelve healthy subjects [(mean ± standard deviation) 6
male, 6 female, age 25.15 ± 2.5 years, body mass 74.1 ±
11.84 kg] gave informed consent and participated in the
study. The University of Michigan Medical School Institu-
tional Review Board approved the protocol.
Hardware
We fabricated a custom ankle-foot orthosis (AFO) for
each subject's left leg (Figure 1). Construction and testing
of the AFO has been described in detail [14-16]. Each AFO
consisted of a carbon fiber shank section and polypropyl-
ene foot section. A metal hinge joining the shank and foot
sections permitted free sagittal plane rotation of the ankle.
Each orthosis weighed approximately 1.1 kilograms,
which adds distal mass to a subject's left leg. The added
distal mass likely slightly increased the metabolic cost of
walking [19]. The passive orthosis also slightly affected
subjects' ankle kinematics, causing slightly increased
plantar flexion (<1 degree) during swing.
We attached a pneumatic artificial muscle to the posterior
of each AFO. Inflating (pressurizing) the pneumatic mus-
cle created a plantar flexor torque. The artificial pneumatic
plantar flexor muscle had a moment arm of approxi-
mately 10 centimeters. Air was supplied to the pneumatic
muscle by four parallel proportional pressure regulators
(MAC Valves, Inc., Wixom, MI) via nylon tubing (0–6.2
bar). An analog-controlled solenoid valve (MAC Valves,
Inc., Wixom, MI) was attached in parallel with the air sup-
ply to assist in exhausting unwanted air from the pneu-
matic muscle. Pressurization of the pneumatic muscle and
solenoid valve activity produced sounds that were audible
to the subject.
Testing protocol
Subjects completed two identical sessions of testing wear-
ing the AFO. Each session went as follows: 10 minutes of
treadmill walking with the AFO passive (Passive AFO), 30
minutes of treadmill walking with the AFO powered
(Active AFO), and finally 15 minutes of walking with the
AFO passive (Passive AFO). The transitions from passive
to powered, and powered to passive, occurred without
Journal of NeuroEngineering and Rehabilitation 2007, 4:48 />Page 3 of 13
(page number not for citation purposes)
stopping. For safety, we gave the subject an oral count-
down to when the transition would occur. The second ses-
sion of testing was completed three days after the first
session. This three day rest period was chosen to allow the
subjects to recover from any muscle fatigue and soreness
that may have occurred during the first session.
All subjects were naive, never experiencing walking with a
powered orthosis until the first day of training. Before test-
ing, subjects were told that the powered orthosis would
provide "extra push-off force." We instructed subjects to
walk in the manner they preferred and that it would take
some time to adjust to the powered orthosis.
Control
The pressure in the pneumatic muscle was controlled by
one of two real-time control schemes: proportional myo-
electric control or foot switch control (Figure 1). Subjects
experienced either proportional myoelectric control or
foot switch control (six subjects, 3 male and 3 female, in
each control scheme).
In the footswitch control scheme, we controlled the pres-
sure in the pneumatic muscle through the use of a fore-
foot footswitch (B & L Engineering, Tustin, CA). This
footswitch control was implemented through a desktop
computer and a real-time control board (dSPACE, Inc.,
Northville, MI). The software was composed in Simulink
(The Mathworks, Inc., Natick, MA) and converted to Con-
trolDesk (dSPACE, Inc., Northville, MI). The software sent
a 0 to 10 V analog signal to the proportional pressure reg-
ulators and solenoid valves to control the activation and
deactivation (pressure) of the pneumatic muscles. The
software program regulated air pressure in the pneumatic
muscle via an on-off or "bang-bang" controller. If the volt-
age signal from the footswitch was below the threshold
value (a threshold was used to ensure a consistent pres-
sure control signal), then the software signaled for zero or
minimum pressure in the pneumatic muscle. If the volt-
age signal was above the threshold, the software signaled
for maximum pressure in the pneumatic muscle.
In the proportional myoelectric control scheme, the pres-
sure in the pneumatic muscle was proportional to the
processed soleus electromyography (EMG). The EMG sig-
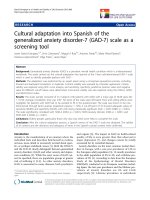
Two orthosis control methodsFigure 1
Two orthosis control methods. Two control schemes (A, gray arrows: proportional myoelectric control, and B, black arrows: footswitch control)
were used to activate the artificial pneumatic muscle. This pneumatic muscle was fastened to the shank and heel sections of a carbon fiber ankle-foot
orthosis that allowed free sagittal plane rotation at the ankle joint. When activated, this muscle produced a plantar flexion torque at the ankle.
Soleus EMG
Control Signal
Computer
Interface
Air
Compressor
Control Signal
Computer
Interface
Footswitch Signal
B
A
Journal of NeuroEngineering and Rehabilitation 2007, 4:48 />Page 4 of 13
(page number not for citation purposes)
nal was processed as follows: It was first high-pass filtered
with a second-order Butterworth filter (cutoff frequency
20 Hz) to remove movement artifact, full wave rectified,
and low-pass filtered with a second-order Butterworth fil-
ter (cutoff frequency 10 Hz) in order to smooth the signal.
Setting threshold cutoff values appropriately eliminated
background noise in the signal. The amplitude of the con-
trol signal was scaled with adjustable gains. The control
was implemented in the same way as the footswitch con-
trol except that the control signal was proportional. Data
from the six subjects who used proportional myoelectric
control was previously reported by Gordon and Ferris
[18].
Because the control signal that resulted from the myoelec-
tric control scheme was proportional, it was important to
set the gain of the control signal consistently. We tuned
the gain separately each day to ensure that the relation-
ship between the soleus EMG and the control signal
remained the same. To set the gain, we followed the fol-
lowing procedure: 1) While the subject walked with the
AFO passive (the first Passive AFO period), we adjusted
the gain without activating the AFO so that a maximum
control signal (10 V) was produced at the maximum or
peak of the soleus EMG. 2) We then doubled the gain. 3)
After doubling the gain, we did not change it for the
remainder of the training session.
It is important to note that there is not a simple linear rela-
tionship between the control signal amplitude (whether it
is from electromyography or a footswitch) and the force
developed by the muscle/torque provided by the orthosis.
The control signal directly controlled the pressure sup-
plied to the pneumatic muscle. Increasing pressure in the
muscle increases the force developed by the muscle. How-
ever the force that the muscle actually develops is affected
by its activation (pressure), the muscle length, and the
bandwidth [16]. In isometric conditions, a pneumatic
muscle is able to develop 1700 N of force. As the muscle
shortens, less force is developed. When the muscle reaches
its minimum length (~71% of its resting length), the force
developed drops to zero. The force bandwidth of the arti-
ficial muscle is approximately 2.4 Hz, which is very simi-
lar to the 2.2 Hz force bandwidth of human muscle [20].
Approximately a 50 ms electromechanical delay existed
between onset of the control signal and the initial rise in
the artificial muscle tension. A more detailed description
of the pneumatic muscle performance can be found in
Gordon et al.[16]. There is no direct relationship between
the control signal and the force/torque provided by the
AFO. Therefore, a bang-bang control signal does not result
in an applied bang-bang torque or power at the ankle
joint.
Data collection
We recorded kinematic, kinetic, and electromyography
data from each subject during the first 10 seconds of every
minute as they walked on a treadmill at 1.25 m/s. Kine-
matic data was sampled at 120 Hz. All other signals were
sampled at 1200 Hz. Three-dimensional kinematic data
was recorded using a 6-camera video system (Motion
Analysis Corporation, Santa Rosa, CA) and twenty-nine
reflective markers placed on each subject's pelvis and
lower limbs. Step cycle data was collected using foots-
witches (B & L Engineering, Tustin, CA), which were
placed in each shoe. Artificial pneumatic muscle force was
measured using a compression load cell (Omega Engi-
neering, Stamford, CT) mounted in series with the pneu-
matic muscle. We recorded lower limb surface EMG
(Konigsberg Instruments, Inc., Pasadena, CA) from the
left soleus, tibialis anterior, medial gastrocnemius, lateral
gastrocnemius, vastus lateralis, vastus medialis, rectus
femoris, medial hamstring and lateral hamstring muscles
using bipolar surface electrodes. The EMG was bandpass
filtered with a lower bound of 12.5 Hz and an upper
bound of 920 Hz. We minimized crosstalk by visually
inspecting the EMG signals during manual muscle tests
prior to treadmill walking, moving electrode placement if
needed. We marked the position of the electrodes on each
subject's skin using a permanent marker to ensure the
same electrode placement for the second session of test-
ing. The sound of the pneumatic muscle inflating and
deflating was audible to the subjects for both control sig-
nals. No distinguishable difference between the noises
associated with each controller could be identified.
Data analysis
We created average step cycle profiles of each minute of
walking for EMG, kinematic, and kinetic variables for
each subject. Each minute's average step cycle was calcu-
lated from the complete step cycles that occurred during
the first 10 seconds of that minute. To examine how EMG
amplitude changed over time, we calculated the normal-
ized root mean squared (RMS) EMG values for each
minute of walking for each subject. RMS EMG values were
calculated from high pass filtered (cutoff frequency 40
Hz) and rectified EMG data for the complete gait cycle,
stance phase, and swing phase. All RMS EMG values were
normalized to the last minute of walking with the passive
AFO before activating the pneumatic muscle (the last pre-
passive minute), or what we called the Baseline condi-
tion. We also made average step profiles for the joint
angles that were created from the marker data (low-pass
filtered, cutoff frequency 6 Hz). In order to examine the
changes in the kinematics over time, we calculated joint
angle correlations between the average step cycle profiles
of each minute and the average joint profile from the last
pre-passive minute for the same session. We created aver-
age step cycle torque and power profiles for the AFO only
Journal of NeuroEngineering and Rehabilitation 2007, 4:48 />Page 5 of 13
(page number not for citation purposes)
(torque and power that the AFO was producing). From
these, we calculated the positive and negative work per-
formed by the AFO during a step cycle. Foot and shank
parameters were adjusted to account for added AFO mass
and inertia.
Four parameters were used to assess the adaptation rate
and degree of adaptation: soleus EMG RMS during the
stance phase, ankle angle correlation common variance,
positive orthosis work, and negative orthosis work. Soleus
EMG RMS during stance was chosen to assess how the
neural control of the subjects changed over the training
period. Ankle angle correlation common variance was
selected to measure how the kinematics of the walking
pattern changed (Figure 2). Ankle angle correlation com-
mon variance was calculated for each minute by plotting
the ankle angle of that minute versus the ankle angle dur-
ing the last minute of passive walking before activating the
orthosis (the Baseline condition). A linear fit of active ver-
sus passive ankle angle was calculated for each minute,
and a R
2
correlation value was found for each linear fit.
Positive and negative work allowed us to evaluate how
effectively subjects were able to use the powered orthosis.
Statistics
We used a general linear model (GLM), or multiple regres-
sion, to test for significant effects between controllers,
effects of minute within footswitch control group, and
effects of minute within proportional myoelectric control
group for the four outcome parameters (soleus EMG RMS,
ankle angle correlation common variance, positive ortho-
sis work, and negative orthosis work). The equation for
the general linear model is of the form y = β
0
+ β
1
x
1
+ β
2
x
2
+ + β
n
x
n
+ ε, where Y is the response variable, β
n
are
model parameters, and ε is the error. Our previous study
examining subjects using proportional myoelectric con-
trol found that subjects were at steady state walking
dynamics for the last 15 minutes of powered orthosis
walking on the second day of training [18]. As a result, we
used only the last 15 minutes of data on day 2 to test for
significant differences between controllers during steady
state. A general linear model was also used to test the
effect of controller on post-adaptation, or the period of
walking after turning the power to the AFO off. The entire
15 minutes of post-powered orthosis walking was used for
the post-adaptation analysis.
To test for differences in adaptation rate between control-
lers, we used the methodology of Noble and Prentice [21].
This method defines a band of normal variation within
steady state dynamics and then calculates the amount of
time required to reach and stay within that band. As men-
tioned above, we used data from the last 15 minutes of
powered walking on day two for the steady state period.
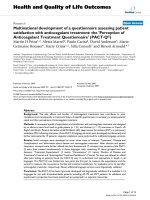
Ankle angle correlation common varianceFigure 2
Ankle angle correlation common variance. The plots above compare the two controllers (footswitch control = black, proportional myoelectrical
control = gray) and their effect on ankle kinematics during the subjects' first experience with the powered orthosis (day 1, 1
st
active minute) and the end
of training (day 2, 30
th
active minute) for all 12 subjects (n = 6 for each control scheme). On the first day during the first minute, the ankle kinematics
changed significantly regardless of the controller used. Initially, the proportional myoelectric control resulted in more perturbation at the ankle than the
footswitch control. At the end of training, subjects returned closer to normal (baseline) kinematics regardless of controller. Proportional myoelectric con-
trol resulted in more normal kinematics than footswitch control.
Footswitch control linear fit
Footswitch control
Proportional myoelectric control
Proportional myoelectric control linear fit
-20 -10 0 10 20
-30
-20
-10
0
10
Passive Ankle Angle (degrees)
Day 1: 1
st
active minute
-20 -10 0 10 20
Passive Ankle Angle (degrees)
Day 2: 30
th
active minute
R
2
= 0.37
R
2
= 0.12
R
2
= 0.72
R
2
= 0.90
Active
Ankle
Angle
(degrees)
Journal of NeuroEngineering and Rehabilitation 2007, 4:48 />Page 6 of 13
(page number not for citation purposes)
The band of steady state variation for each outcome
parameter was calculated as the mean ± two standard
deviations from the steady state period. Time to steady
state was defined as the time it took for a measure to enter
the steady state range and remain there for three consecu-
tive minutes without any two consecutive minutes outside
of the steady state range afterwards. This analysis was per-
formed for each subject individually. Differences in learn-
ing rate (time to steady state) were assessed using a
repeated measures ANOVA.
Overground walking
An overground testing session was used to measure the
amount of work and power that each subject produced
without the AFO. This let us estimate the amount of assist-
ance that the powered AFO was providing the subjects.
During the overground collection, a subject would walk
without wearing an AFO over two force plates at a speed
of 1.25 m/s (± 0.06 m/s). Subjects completed ten trials.
Force plate data and kinematic marker data were used to
calculate net torques and work performed about the ankle
joint by using commercial software (Visual3D, C-Motion,
Inc., Rockville, MD).
Results
Effects and responses
The walking patterns of the subjects changed substantially
when the AFO provided additional plantar flexion torque
at the beginning of training. The initial changes were sub-
stantial regardless of the controller used. When first expe-
riencing the powered AFO condition (minute 1, day 1),
the extra torque caused the subjects to walk with increased
plantar flexion. This plantar flexion was greatest at toe-off,
where it was approximately 17 degrees greater than
unpowered orthosis walking. The significant initial
change in ankle kinematics was also reflected in the ankle
angle correlation common variance, which decreased
from 1 during unpowered walking to 0.37 and 0.12 for
footswitch orthosis control and soleus proportional myo-
electrical orthosis control, respectively (Figure 2). Subjects
also initially demonstrated increased muscle activation
throughout the stance phase (Figures 3, 4, 5).
Muscle activation patterns were modified as the subjects
trained with the powered AFO. Examples of these changes
can be seen in Figures 4 and 5. By the end of the second
day of training, differences in the muscle activation pat-
terns compared to passive orthosis walking were very sub-
tle. The exception to this was the soleus muscle activation
amplitude in the subjects using proportional myoelectric
control (Figure 3). There were no significant differences in
stride time between orthosis control methods, condition,
or day. Footswitch subjects had a stride time of 1.26 ±
0.10 seconds (mean ± standard deviation) and propor-
tional myoelectric subjects had a stride time of 1.24 ± 0.12
seconds. The artificial plantar flexor produced a peak
torque that was approximately 47% of the peak torque
generated at the ankle when walking overground (Figure
3). As subjects trained with the powered AFOs, the torque
and power produced by the AFO became more focused at
toe-off (Figure 3).
Learning rates
There were significant differences in learning rates
between days, but few significant differences in learning
rates between controllers. All four of the movement
parameters (soleus EMG RMS, ankle angle correlation
common variance common variance, positive orthosis
work, negative orthosis work) showed significant differ-
ences by day (ANOVA, p < 0.005). For each measure and
both controllers, steady state was reached more quickly on
the second day of training (Figures 6 and 7). The only sig-
nificant difference in learning rate between controllers
was in negative orthosis work. Subjects reached negative
orthosis work steady state more quickly when using foot-
switch control than when using proportional myoelectric
control (ANOVA, p = 0.0115).
Steady state
The last 15 minutes of powered orthosis walking were
found to be constant (no change in movement parameters
with time) for both controllers and all movement param-
eters except ankle angle correlation common variance and
negative orthosis work when using footswitch control.
Time was found to have a significant effect on both meas-
urements (ankle angle correlation common variance p =
0.0417, negative orthosis work p = 0.0085), however the
rates of change were very small (ankle angle correlation
common variance slope = 0.0058 units/min, negative
orthosis work slope = 0.00051 J/kg/min). Differences in
the steady state walking patterns were found between con-
trollers. Subjects using proportional myoelectric control
reduced steady state EMG amplitudes of the soleus more
than subjects who used footswitch control (GLM, p =
0.0144, Figure 8). Subjects using proportional myoelectric
control walked with ankle kinematics (as measured by
ankle angle correlation common variance) closer to base-
line than subjects using footswitch control (GLM, p =
0.0417). At steady state, more negative orthosis work was
produced by subjects using footswitch control (GLM, p =
0.0085). There was a trend for subjects using footswitch
control to also produce more positive orthosis work but it
was not statistically significant (GLM, p = 0.0575).
Subjects using both controllers walked with kinematics
different from baseline (GLM, p < 0.03). Only subjects
using proportional myoelectric control reduced EMG
amplitudes of the soleus, medial gastrocnemius, and lat-
eral gastrocnemius below baseline (GLM, p < 0.03). It is
important to note that Gordon and Ferris [18] only found
Journal of NeuroEngineering and Rehabilitation 2007, 4:48 />Page 7 of 13
(page number not for citation purposes)
that the soleus EMG amplitude was significantly different
from baseline for subjects (n = 10) using proportional
myoelectric control.
Post-passive adaptation
No significant differences in post-passive adaptation rate
were found between the two controllers.
Discussion
Subjects using proportional myoelectric control returned
closer to their normal (Baseline) kinematic patterns by the
end of the second day compared to subjects using foots-
witch control. There are several aspects of the propor-
tional myoelectric control that could have contributed to
this difference. First, proportional control allows for a
more graded response in orthosis dynamics than the
bang-bang nature of footswitch control used in this study.
With step-to-step variability in orthosis output, it would
likely be easier for the nervous system to determine the
relationship between soleus activation and orthosis assist-
ance using proportional myoelectric control than using
footswitch control. Second, proportional myoelectric con-
trol put the orthosis under a control mode that is more
similar to the normal physiologic control that the nervous
Effects of the powered ankle-foot orthosis on soleus muscle activation, sagittal ankle angle, orthosis torque, and orthosis power under each control schemeFigure 3
Effects of the powered ankle-foot orthosis on soleus muscle activation, sagittal ankle angle, orthosis torque, and orthosis power under
each control scheme. The effects of the powered ankle-foot orthosis on soleus muscle activation, sagittal ankle angle, orthosis torque, and orthosis
power under each control scheme (footswitch control = thin black line, proportional myoelectrical control = thick gray line) are shown for the first and
last minutes of powered walking for both days. Soleus muscle activation and ankle angle are plotted with passive (normal) data (light gray dotted line) for
comparison. Orthosis torque and power are plotted with normal overground biological torque and power (light gray dashed line). Electromyography is
normalized to the peak Baseline (passive) value. After two training sessions, subjects using footswitch control continued to walk with increased plantar
flexion whereas subjects using proportional myoelectric control reached more normal ankle kinematics (as measured by ankle angle correlation common
variance). The powered ankle-foot orthosis was able to supply approximately forty percent of the biological ankle torque. Data shown is from all 12 sub-
jects (n = 6 for footswitch control, n = 6 for proportional myoelectric control, n = 12 for passive data). The average standard deviation over the stride
cycle for each signal and each condition is reported in each plot in units consistent with that signal.
Footswitch control - FS
Proportional myoelectric control - PMC
Passive (no AFO) - PA
Overground biological torque/power - OG
-30
-15
0
15
0
0.5
1
Day 1
1
st
active minute
Day 1
30
th
active minute
Day 2
1
st
active minute
Day 2
30
th
active minute
0 50 100
-1
0
1
2
% Gait Cycle
0 50 100
% Gait Cycle
0
0.5
1
0 50 100
% Gait Cycle
0 50 100
% Gait Cycle
Soleus (SOL)
EMG
(Normalized)
Ankle Angle
(degrees)
plantar flexion –
dorsiflexion +
Normalized
Torque
(Nm/kg)
Normalized
Power
(W/kg)
FS = 0.16
PMC = 0.19
PA = 0.11
FS = 0.15
PMC = 0.09
PA = 0.11
FS = 0.17
PMC = 0.12
PA = 0.11
FS = 0.20
PMC = 0.08
PA = 0.11
FS = 8.04
PMC = 4.71
PA = 3.73
FS = 8.81
PMC = 3.72
PA = 3.73
FS = 8.42
PMC = 5.81
PA = 4.82
FS = 9.42
PMC = 9.27
PA = 4.82
FS = 0.12
PMC = 0.15
OG = 0.18
FS = 0.15
PMC = 0.06
OG = 0.18
FS = 0.12
PMC = 0.10
OG = 0.18
FS = 0.12
PMC = 0.05
OG = 0.18
FS = 0.23
PMC = 0.29
OG = 0.37
FS = 0.19
PMC = 0.13
OG = 0.37
FS = 0.18
PMC = 0.11
OG = 0.37
FS = 0.17
PMC = 0.10
OG = 0.37
Journal of NeuroEngineering and Rehabilitation 2007, 4:48 />Page 8 of 13
(page number not for citation purposes)
system uses to generate motion. It is likely that the nerv-
ous system has some representation of the transfer func-
tion from soleus motor neuron recruitment to ankle
movement. Wearing the orthosis with proportional myo-
electric control would likely be interpreted as a relatively
minor change in the transfer function. Wearing the ortho-
sis with footswitch control would likely be a more non-
natural modification to lower limb movement control.
Both of the possibilities are dependant upon the relation-
ship between the efferent and afferent signals to the move-
ment generated by the orthosis. With both controllers, the
sensory signals or afferent signals are used by the central
nervous system to estimate the system's state. However,
the efferent signals or motor control signals must also be
used to make predictions about the system to control
movement [22]. With proportional myoelectric control,
the motor control signal is closely related to the orthosis
behavior, allowing for accurate prediction (Figure 9b).
With footswitch control, the orthosis control signal is not
related well to any motor control signals (Figure 9a). The
footswitch control has different effects, depending on
whether the foot is on the ground or in the air. This could
be thought of as trying to learn two different dynamics at
once – each is presented in rapid succession. Rapid succes-
sion of two dynamic systems interferes with motor learn-
ing [22]. We cannot separate out the relative importance
of the two possibilities with the data from this study, but
it is clear that the choice of controller can have substantial
effects on the walking pattern.
Effects of the powered ankle-foot orthosis on lower leg musclesFigure 4
Effects of the powered ankle-foot orthosis on lower leg muscles. Average medial gastrocnemius (MG), lateral gastrocnemius (LG), and tibialis
anterior (TA) muscle activations are plotted alongside passive orthosis muscle activations for the first and last minutes of powered orthosis walking for
both days of training and both controllers [footswitch control (FS) = thin black line, and proportional myoelectric control (PMC) = thick gray line]. Elec-
tromyographies are normalized to the peak passive values. By the end of the second day of training, muscle activation patterns were not much different
from normal (light gray dotted line). Each plot is the average of multiple subject data: 6 subjects for all footswitch control data, 5 subjects for proportional
myoelectrical control MG and LG, 4 subjects for proportional myoelectrical control TA. The average standard deviation over the stride cycle for each sig-
nal and each condition is reported in each plot in units consistent with that signal.
0
0.5
1
1.5
Day 1
1
st
active minute
Day 1
30
th
active minute
Day 2
1
st
active minute
Day 2
30
th
active minute
0
0.5
1
1.5
0 50 100
0.5
1
1.5
% Gait Cycle
0 50 100
% Gait Cycle
0 50 100
% Gait Cycle
0 50 100
% Gait Cycle
Footswitch control - FS
Proportional myoelectric control - PMC
Passive (no AFO) - PA
Medial gastrocnemius
(MG) EMG
(Normalized)
Lateral gastrocnemius
(LG) EMG
(Normalized)
Tibialis anterior (TA)
EMG
(Normalized)
FS = 0.20
PMC = 0.24
PA = 0.11
FS = 0.16
PMC = 0.11
PA = 0.11
FS = 0.19
PMC = 0.17
PA = 0.11
FS = 0.18
PMC = 0.12
PA = 0.11
FS = 0.16
PMC = 0.27
PA = 0.12
FS = 0.14
PMC = 0.13
PA = 0.12
FS = 0.17
PMC = 0.16
PA = 0.11
FS = 0.19
PMC = 0.11
PA = 0.11
FS = 0.28
PMC = 0.38
PA = 0.12
FS = 0.18
PMC = 0.14
PA = 0.12
FS = 0.19
PMC = 0.24
PA = 0.13
FS = 0.18
PMC = 0.16
PA = 0.13
Journal of NeuroEngineering and Rehabilitation 2007, 4:48 />Page 9 of 13
(page number not for citation purposes)
The artificial pneumatic plantar flexor produced a peak
torque 47% of the maximum ankle plantar flexor torque
produced when walking (Figure 3). We did not expect the
powered orthosis to provide all of the torque needed at
the ankle during gait. In a previous study by Gordon et
al.[16] the powered orthosis was only able to generate a
peak plantar flexor torque that was 57% of the peak net
ankle plantar flexor moment, regardless of the potential
force generation capabilities of the artificial pneumatic
plantar flexor. Gordon et al.[16] also found that the net
ankle moment remained approximately the same regard-
less of the assistance given to the subjects; the sum of the
AFO produced torque plus the physiological torque was
approximately equal to the physiological torque pro-
duced when walking without a powered orthosis. A good
estimate of what torque the ankle is producing is the dif-
ference between overground biological torque and the
torque produced by the powered orthosis (Figure 3). Pre-
viously, the powered orthosis was found to produce about
70% of the positive plantar flexor work done during nor-
mal walking [16].
It is possible that the footswitch control signal was pro-
ducing too much torque (more than required for normal
walking). Reducing the magnitude of the bang-bang con-
trol signal used for the footswitch control method could
allow a new dynamic equilibrium point closer with nor-
mal or baseline kinematics and reduced plantar flexion
activation.
Effects of the powered ankle-foot orthosis on upper leg musclesFigure 5
Effects of the powered ankle-foot orthosis on upper leg muscles. The vastus medialis (VM), vastus lateralis (VL), rectus femoris (RF), and medial
hamstrings (MH) muscle activations are plotted alongside passive orthosis muscle activations for the first and last minutes of powered orthosis walking for
both days of training and both controllers [footswitch control (FS) = thin black line, and proportional myoelectric control (PMC) = thick gray line]. Elec-
tromyographies are normalized to the peak passive values. By the end of the second day of training, muscle activation patterns returned very close to nor-
mal (light gray dotted line). Each plot is the average of multiple subject data: 6 subjects for all footswitch control data, 6 subjects for proportional
myoelectrical control MH, 5 subjects for proportional myoelectrical control VL and RF, 4 subjects for proportional myoelectrical control VM. The average
standard deviation over the stride cycle for each signal and each condition is reported in each plot in units consistent with that signal.
0
1
2
Day 1
1
st
active minute
Day 1
30
th
active minute
Day 2
1
st
active minute
Day 2
30
th
active minute
0
1
2
0
1
2
0 50 100
0
1
2
% Gait Cycle
0 50 100
% Gait Cycle
0 50 100
% Gait Cycle
0 50 100
% Gait Cycle
Footswitch control - FS
Proportional myoelectric control - PMC
Passive (no AFO) - PA
Vastus medialis (VM)
EMG
(Normalized)
Vastus lateralis (VL)
EMG
(Normalized)
Rectus femoris (RF)
EMG
(Normalized)
Medial hamstrings (MH)
EMG
(Normalized)
FS = 0.27
PMC = 0.38
PA = 0.13
FS = 0.13
PMC = 0.23
PA = 0.13
FS = 0.14
PMC = 0.15
PA = 0.12
FS = 0.34
PMC = 0.31
PA = 0.12
FS = 0.28
PMC = 0.44
PA = 0.11
FS = 0.10
PMC = 0.17
PA = 0.11
FS = 0.28
PMC = 0.19
PA = 0.13
FS = 0.20
PMC = 0.15
PA = 0.13
FS = 0.60
PMC = 0.50
PA = 0.18
FS = 0.25
PMC = 0.16
PA = 0.18
FS = 0.34
PMC = 0.18
PA = 0.16
FS = 0.29
PMC = 0.13
PA = 0.16
FS = 0.34
PMC = 0.43
PA = 0.11
FS = 0.18
PMC = 0.18
PA = 0.11
FS = 0.35
PMC = 0.38
PA = 0.14
FS = 0.16
PMC = 0.20
PA = 0.14
Journal of NeuroEngineering and Rehabilitation 2007, 4:48 />Page 10 of 13
(page number not for citation purposes)
The differences in soleus activation between the two con-
trollers (Figure 8) suggest that proportional myoelectric
control may lead to a lower metabolic cost of transport
than the footswitch control. Muscle activation requires
the use of metabolic energy. Although nonlinear factors
such as muscle length and velocity will affect the relation-
ship between muscle recruitment and metabolic cost [23],
the larger reductions in plantar flexor muscle recruitment
for proportional myoelectric control compared to foots-
witch control may override the differences in muscle-ten-
don kinematics. This is an important possibility to
consider given recent findings from Norris et al.[24]. They
showed that the metabolic cost of transport decreased by
about 13% when subjects walked with two powered AFOs
similar to the design used in this study [24]. However,
Norris et al.[24] used a bang-bang control algorithm that
started and stopped orthosis activation based on the
angular velocity of the foot. Thus, this type of control was
Soleus EMG RMS, ankle angle correlation common variance, positive orthosis work, and negative orthosis work changes across both training sessionsFigure 6
Soleus EMG RMS, ankle angle correlation common variance, positive orthosis work, and negative orthosis work changes across both
training sessions. Soleus EMG RMS, ankle angle correlation common variance, positive orthosis work, and negative orthosis work are plotted (mean ±
standard error) across both training sessions for each minute. Results for each controller [footswitch control = black line and dark shading, proportional
myoelectrical control = gray line and light shading] are shown along with the steady state band for each measure. Time till steady state was used as a meas-
ure of the adaptation rate. Differences in day 1 versus day 2 adaptation rates were significant (ANOVA, p < 0.005). On day 2, footswitch control resulted
in faster adaptation in negative orthosis work (GLM, p = 0.0115). At steady state, proportional myoelectric control resulted in less soleus activation (GLM,
p = 0.0342), closer to normal ankle kinematics (GLM, p = 0.0417), and less negative work (GLM, p = 0.0085) than footswitch control. The steady state
envelopes displayed are calculated for the group mean data (n = 6 for each controller) for display purposes only; individual subject analyses were calculated
in the same way and were used for statistical tests
.
Footswitch control
Proportional
myoelectric control
Footswitch control:
steady state ± 2
standard deviations
Proportional
myoelectric control:
steady state ± 2
standard deviations
Figure 6
Soleus
EMG RMS
(Normalized)
Ankle Angle
Correlation
Common Variance
(R
2
)
Normalized
Positive
Orthosis
Work (J/kg)
Normalized
Negative
Orthosis
Work (J/kg)
Passive
AFO
10 min
Passive
AFO
10 min
Passive
AFO
15 min
Passive
AFO
15 min
Active
AFO
30 min
Active
AFO
30 min
Day 1 Day 2
Journal of NeuroEngineering and Rehabilitation 2007, 4:48 />Page 11 of 13
(page number not for citation purposes)
similar to our footswitch control; it depended on motion
and not neurological signals. It seems feasible that pro-
portional myoelectric control might reduce the metabolic
cost of transport during walking more than 13%.
The two controllers produced similar adaptation rates for
most parameters. The only significant difference in adap-
tation rates between controllers was for negative orthosis
work. Subjects using footswitch control reached steady
state faster on both days of training compared to subjects
using proportional myoelectric control. Regardless of con-
trol mode, subjects adapted to the powered orthosis much
more quickly on the second day. This indicates that sub-
jects were able to store a motor memory of how to walk
with the orthosis and then recall that motor memory on a
later date. The controller used did not seem to affect this
formation or recall of the motor memory.
The results from this study may have been altered if sub-
jects had been allowed to practice using the orthosis for a
longer time period. Additional days of training might
have resulted in further adaptation to the walking pattern.
However, given the relative steady state nature of the out-
come parameters during the last 15 minutes of day two
(Figure 6), any additional changes would have likely
required multiple days.
Conclusion
The choice of controller for a robotic exoskeleton can have
a substantial effect on human-machine performance. If
the goal of the exoskeleton is to walk with relatively nor-
mal joint kinematics, proportional myoelectric control
should be preferred over footswitch control. In addition,
it seems reasonable to suggest that proportional myoelec-
tric control may provide metabolic savings greater than
those from footswitch control as well.
The findings of this study also have important implica-
tions for rehabilitation. While rate of motor adaptation
was not affected by controller, the steady state walking
dynamics were more similar for proportional myoelectric
control than footswitch control. This suggests that robotic
devices designed to facilitate adaptive training may bene-
fit from more direct nervous system control. Proportional
myoelectric control may also have the benefit of amplify-
ing movement errors during practice. Patton et al.[25]
found that practice with error-enhancing mechanical
forces was more effective in improving movement ability
of stroke subjects compared to practice with error-reduc-
ing mechanical forces. It would be very interesting to
examine how patients with neurological deficits
Steady state muscle activationFigure 8
Steady state muscle activation. Steady state EMG RMS values of the
soleus, medial gastrocnemius, and lateral gastrocnemius are plotted for
each controller and each day (mean ± standard error) [footswitch control
= solid bars, proportional myoelectrical control = hashed bars]. Average
data is used for each plot (n = 6), except for the proportional myoelectric
control medial gastrocnemius (n = 5) and lateral gastrocnemius (n = 5).
The RMS values are normalized by dividing by the RMS of the passive
orthosis condition. Proportional myoelectric control resulted in less mus-
cle activation for the soleus than footswitch control (GLM, p = 0.0144).
(asterisk) indicates significant difference between studies. (triangle) indi-
cates significant difference from baseline (GLM, p < 0.03).
6ROHXV 0HGLDO
*DVWURFQHPLXV
/DWHUDO
*DVWURFQHPLXV
6WHDG\6WDWH
(0*506
1RUPDOL]HG
)RRWVZLWFKFRQWURO
3URSRUWLRQDOP\RHOHFWULF
FRQWURO
Ÿ
Ÿ
Ÿ
Adaptation ratesFigure 7
Adaptation rates. Adaptation rates expressed as time in minutes to
steady state for ankle angle correlation common variance, soleus EMG
RMS, positive orthosis work, and negative orthosis work are plotted for
each controller and each day (mean + standard error) [footswitch control
= solid bars, proportional myoelectrical control = hashed bars]. Significant
differences in time to steady state were found between days for each con-
troller (GLM, p < 0.005). The only difference in between controllers was
the adaptation rate of the negative orthosis work, in which the footswitch
control was faster (GLM, p = 0.0115). (asterisk) indicates significant differ-
ence between studies.
0
5
10
15
20
25
30
35
ankle angle
correlation
common
variance
soleus EMG
RMS
positive
orthosis work
negative
orthosis work
Footswitch control day 1
Footswitch control day 2
Proportional myoelectric control day 1
Proportional myoelectric control day 2
Time to
steady state
(minutes)
*
Journal of NeuroEngineering and Rehabilitation 2007, 4:48 />Page 12 of 13
(page number not for citation purposes)
responded to walking practice with a powered orthosis
under proportional myoelectric control. It could improve
motor learning by enhancing errors in neuromuscular
activation patterns in a manner to that found by Patton et
al.[25]. Future studies are needed to examine this possibil-
ity.
Competing interests
The author(s) declare that they have no competing inter-
ests.
Authors' contributions
SMC recruited subjects, managed data collections, and
completed data analysis for the footswitch orthosis con-
trol method. KEG recruited subjects, managed data collec-
tions, and completed data analysis for the proportional
myoelectric orthosis control method. SMC completed all
data analysis for comparing the two orthosis control
methods, and drafted the manuscript. KEG edited the
manuscript. DPF conceived the study, provided guidance
on experimental design, assisted with data collections,
and edited the manuscript. All authors read and approved
the final manuscript.
Acknowledgements
The authors would like to thank Catherine Kinnaird and other members of
the Human Neuromechanics Laboratory for assistance with data collection
and analysis. This study was supported by NIH grant R01 NS045486 and
NSF GRFP.
References
1. Ferris DP, Sawicki GS, Domingo AR: Powered lower limb
orthoses for gait rehabilitation. Topics in Spinal Cord Injury Reha-
bilitation 2005, 11:34-49.
2. Kawamoto H, Sankai Y: Power assist system HAL-3 for gait dis-
order person. In Computer Helping People with Special Needs: 8th
International Conference, ICCHP 2002. Lecture Notes in Computer Science
Edited by: Miesenberger K, Klaus J, Zagler W. Berlin: Springer Verlag;
2002:196-203.
3. Suzuki K, Kawamura Y, Hayashi T, Sakurai T, Hasegawa Y, Sankai Y:
Intention-based walking support for paraplegia patient.
2005, 2703:2707-2713.
4. Zoss AB, Kazerooni H, Chu A: Biomechanical Design of the Ber-
keley Lower Extremity Exoskeleton (BLEEX). IEEE/ASME
Transactions on Mechatronics 2006, 11:128-138.
5. Kazerooni H, Steger R: The Berkeley Lower Extremity Exoskel-
eton. Journal of Dynamic Systems Measurement and Control-Transac-
tions of the Asme 2006, 128:14-25.
6. Jacobsen SC, Olivier M, Smith FM, Knutti DF, Johnson RT, Colvin GE,
Scroggin WB: Research robots for applications in artificial
intelligence, teleoperation and entertainment. International
Journal of Robotics Research 2004, 23:319-330.
7. Pratt JE, Krupp BT, Morse CJ, Collins SH: The RoboKnee: an
exoskeleton for enhancing strength and endurance during
walking. In IEEE International Conference on Robotics and Automation;
New Orleans, LA IEEE Press; 2004:2430-2435.
8. Blaya JA, Herr H: Adaptive control of a variable-impedance
ankle-foot orthosis to assist drop-foot gait. IEEE Transactions on
Neural Systems and Rehabilitation Engineering 2004, 12:24-31.
9. Kazerooni H, Steger R, Huang L: Hybrid Control of the Berkeley
Lower Extremity Exoskeleton (BLEEX). International Journal of
Robotics Research 2006, 25:561-573.
10. Ghan J, Steger R, Kazerooni H: Control and system identification
for the Berkeley lower extremity exoskeleton (BLEEX).
Advanced Robotics 2006, 20:989-1014.
11. Kawamoto H, Sankai Y: Power assist method based on Phase
Sequence and muscle force condition for HAL. Advanced
Robotics 2005, 19:717-734.
12. Hayashi T, Kawamoto H, Sankai Y: Control method of robot suit
HAL working as operator's muscle using biological and
dynamical information. 2005:3063-3068.
13. Kawamoto H, Lee S, Kanbe S, Sankai Y: Power assist method for
HAL-3 using EMG-based feedback controller. International Con-
ference on Systems, Man and Cybernetics; October 5–8. IEEE
2003:1648-1653.
14. Ferris DP, Czerniecki JM, Hannaford B: An ankle-foot orthosis
powered by artificial pneumatic muscles. Journal of Applied Bio-
mechanics 2005, 21:189-197.
15. Ferris DP, Gordon KE, Sawicki GS, Peethambaran A: An improved
powered ankle-foot orthosis using proportional myoelectric
control. Gait Posture 2006, 23(4):425-428.
16. Gordon KE, Sawicki GS, Ferris DP: Mechanical performance of
artificial pneumatic muscles to power an ankle-foot orthosis.
Journal of Biomechanics 2006, 39:1832-1841.
17. Sawicki GS, Domingo A, Ferris DP: The effects of powered ankle-
foot orthoses on joint kinematics and muscle activation dur-
ing walking in individuals with incomplete spinal cord injury.
J Neuroeng Rehabil 2006, 3:3.
18. Gordon KE, Ferris DP: Learning to walk with a robotic ankle
exoskeleton. J Biomech 2007, 40(12):2636-2644.
19. Browning RC, Modica JR, Kram R, Goswami A: The effects of add-
ing mass to the legs on the energetics and biomechanics of
walking. Med Sci Sports Exerc 2007, 39:515-525.
Comparison of control methodsFigure 9
Comparison of control methods. Comparing simplified block dia-
grams of footswitch (A) versus proportional myoelectric (B) control
reveals a fundamental difference in the neurological integration of the con-
trol signal. In each control method, physiological muscle and the artificial
pneumatic muscle act on the musculoskeletal system to create motion. A:
In footswitch control the control signal for the artificial pneumatic muscle
is generated by a footswitch. The signal from the footswitch depends on
the motion (kinematics) of the subject. The efferent copy cannot provide
the central nervous system with precise information about when the artifi-
cial pneumatic muscle is active or how strong it is contracting. B: In pro-
portional myoelectric control the control signal for the artificial pneumatic
muscle is generated by the subject's electromyographic activity. This signal
is closely related to the efferent signal sent to physiological muscle from
the central nervous system. The efferent copy therefore provides the cen-
tral nervous system with information about what the control signal is and
can be used effectively by the central nervous system to make predictions
about what the artificial pneumatic muscle is doing.
Publish with BioMed Central and every
scientist can read your work free of charge
"BioMed Central will be the most significant development for
disseminating the results of biomedical research in our lifetime."
Sir Paul Nurse, Cancer Research UK
Your research papers will be:
available free of charge to the entire biomedical community
peer reviewed and published immediately upon acceptance
cited in PubMed and archived on PubMed Central
yours — you keep the copyright
Submit your manuscript here:
/>BioMedcentral
Journal of NeuroEngineering and Rehabilitation 2007, 4:48 />Page 13 of 13
(page number not for citation purposes)
20. Aaron SL, Stein RB: Comparison of an EMG-controlled pros-
thesis and the normal human biceps brachii muscle. Am J Phys
Med 1976, 55:1-14.
21. Noble JW, Prentice SD: Adaptation to unilateral change in
lower limb mechanical properties during human walking.
Exp Brain Res 2006, 169(4):482-495.
22. Wolpert DM, Ghahramani Z: Computational principles of
movement neuroscience. Nat Neurosci 2000, 3:1212-1217.
23. Rall JA: Energetic aspects of skeletal muscle contraction:
implications of fiber types. Exerc Sport Sci Rev 1985, 13:33-74.
24. Norris JA, Granata KP, Mitros MR, Byrne EM, Marsh AP: Effect of
augmented plantarflexion power on preferred walking speed
and economy in young and older adults. Gait Posture 2007,
25(4):620-627.
25. Patton JL, Stoykov ME, Kovic M, Mussa-Ivaldi FA: Evaluation of
robotic training forces that either enhance or reduce error
in chronic hemiparetic stroke survivors. Exp Brain Res 2006,
168:368-383.