báo cáo hóa học: " A comparative study on approximate entropy measure and poincaré plot indexes of minimum foot clearance variability in the elderly during walking" pptx
Bạn đang xem bản rút gọn của tài liệu. Xem và tải ngay bản đầy đủ của tài liệu tại đây (516.74 KB, 10 trang )
BioMed Central
Page 1 of 10
(page number not for citation purposes)
Journal of NeuroEngineering and
Rehabilitation
Open Access
Research
A comparative study on approximate entropy measure and
poincaré plot indexes of minimum foot clearance variability in the
elderly during walking
Ahsan H Khandoker*
1
, Marimuthu Palaniswami
1
and Rezaul K Begg
2
Address:
1
Department of Electrical & Electronic Engineering, The Universityof Melbourne, VIC 3010, Australia and
2
Biomechanics Unit, Centre for
Ageing, Rehabilitation, Exercise and Sport, Victoria University, VIC 8001, Australia
Email: Ahsan H Khandoker* - ; Marimuthu Palaniswami - ;
Rezaul K Begg -
* Corresponding author
Abstract
Background: Trip-related falls which is a major problem in the elderly population, might be linked
to declines in the balance control function due to ageing. Minimum foot clearance (MFC) which
provides a more sensitive measure of the motor function of the locomotor system, has been
identified as a potential gait parameter associated with trip-related falls in older population. This
paper proposes nonlinear indexes (approximate entropy (ApEn) and Poincaré plot indexes) of MFC
variability and investigates the relationship of MFC with derived indexes of elderly gait patterns.
The main aim is to find MFC variability indexes that well correlate with balance impairments.
Methods: MFC data during treadmill walking for 14 healthy elderly and 10 elderly participants with
balance problems and a history of falls (falls risk) were analysed using a PEAK-2D motion analysis
system. ApEn and Poincaré plot indexes of all MFC data sets were calculated and compared.
Results: Significant relationships of mean MFC with Poincaré plot indexes (SD1, SD2) and ApEn
(r = 0.70, p < 0.05; r = 0.86, p < 0.01; r = 0.74, p < 0.05) were found in the falls-risk elderly group.
On the other hand, such relationships were absent in the healthy elderly group. In contrast, the
ApEn values of MFC data series were significantly (p < 0.05) correlated with Poincaré plot indexes
of MFC in the healthy elderly group, whereas correlations were absent in the falls-risk group. The
ApEn values in the falls-risk group (mean ApEn = 0.18 ± 0.03) was significantly (p < 0.05) higher
than that in the healthy group (mean ApEn = 0.13 ± 0.13). The higher ApEn values in the falls-risk
group might indicate increased irregularities and randomness in their gait patterns and an indication
of loss of gait control mechanism. ApEn values of randomly shuffled MFC data of falls risk subjects
did not show any significant relationship with mean MFC.
Conclusion: Results have implication for quantifying gait dynamics in normal and pathological
conditions, thus could be useful for the early diagnosis of at-risk gait. Further research should
provide important information on whether falls prevention intervention can improve the gait
performance of falls risk elderly by monitoring the change in MFC variability indexes.
Published: 2 February 2008
Journal of NeuroEngineering and Rehabilitation 2008, 5:4 doi:10.1186/1743-0003-5-4
Received: 29 January 2007
Accepted: 2 February 2008
This article is available from: />© 2008 Khandoker et al; licensee BioMed Central Ltd.
This is an Open Access article distributed under the terms of the Creative Commons Attribution License ( />),
which permits unrestricted use, distribution, and reproduction in any medium, provided the original work is properly cited.
Journal of NeuroEngineering and Rehabilitation 2008, 5:4 />Page 2 of 10
(page number not for citation purposes)
Background
Older population make up a large and increasing percent-
age of the population. As people grow older they are
increasingly at risk of falling and consequent injuries.
Approximately 30% of people over 65 fall each year, and
for those over 75 the rates are higher. Between 20% and
30% of those who fall suffer injuries that reduce mobility
and independence and increase the risk of premature
death [1].
Human walking is a highly automated, rhythmic motor
behaviour that is mostly controlled by subcortical loco-
motor brain regions. Gait analysis refers to the measure-
ment and analysis of human walking patterns. One major
aim of studying gait characteristics is to identify gait vari-
ables that reflect gait degeneration due to ageing with
linkages to the causes of falls. This would help to under-
take appropriate measures to prevent falls.
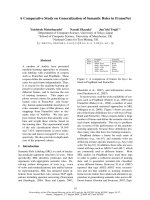
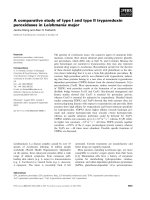
Minimum foot clearance (MFC) during walking (see Fig-
ure 1), which occurs during the mid-swing phase of the
gait cycle, is defined as the minimum vertical distance
between the lowest point under the front part of the shoe/
foot and the ground, has been identified as an important
gait parameter in the successful negotiation of the envi-
ronment in which we walk. This is mainly because of the
fact that during this MFC event, the foot travels very close
to the walking surface (mean MFC = 1.29 cm) with a max-
imum forward velocity (4.6 m/s) [2]. The literature also
suggests a decrease in MFC height (1.12 ± 0.50 cm) with
ageing [3]. This small mean MFC value combined with its
variability provides a strong rationale for MFC being asso-
ciated with tripping during walking.
In our previous study [4], we studied the MFC variability
and statistics for young and elderly females and described
the changes of MFC central tendency and variability as
one of the possible strategies by elderly individuals to
minimize tripping. Analysis of linear statistics does not
directly address their complexity and thus may potentially
miss useful inherent information. Since the underlying
mechanism involved in the human locomotor control has
been reported to be mainly complex and nonlinear [5-7],
the application of nonlinear technique seems appropri-
ate. In this study, we, therefore, investigate the two types
of nonlinear variability indexes (Approximate entropy
and Poincaré plot indexes) of MFC to be able to perform
a diagnostic function to distinguish walking patterns of
elderly subjects with a history of balance impairments and
falls from that of healthy peers.
Approximate entropy (ApEn), a mathematical approach
to quantify the complexity and regularity of a system, has
been introduced by Pincus [8], based on a novel system-
atic biological theory [8,9]. Such theory has suggested that
healthy dynamic stability arises from the combination of
specific feedback mechanisms and spontaneous proper-
ties of interconnected networks, and the weak connection
between systems or within system is the mechanism of
disease, which is characterized by an increased irregularity
of the time series [9,10]. Therefore, ApEn was considered
to provide a direct measurement of feedback and connec-
tion, and a low ApEn value often indicates predictability
and high regularity of time series data, whereas a high
ApEn value indicates unpredictability and random varia-
tion [9]. Previous studies [5] on the entropy of human gait
in multiple scales discussed the scaling effect of entropy
on various walking patterns, indicating the changes of
multiscale entropy values with slow, normal and fast
walking.
Poincaré plot is a geometrical representation of a time
series into a Cartesian plane, where the values of each pair
of successive elements of the time series define a point in
the plot. Indexes derived from Poincaré plot of minimum
foot clearance (MFC) were used to classify young-old gait
types in our previous study [11].
With an aim to find a better marker of gait dynamics due
to balance impairments, we apply ApEn analysis method
to the MFC gait data obtained from elderly subjects with
and without balance problem, and compare the results
with those obtained using Poincaré plot indexes analysis.
Minimum foot clearance (MFC) during walkingFigure 1
Minimum foot clearance (MFC) during walking. Verti-
cal displacement of toe marker for one gait cycle (foot con-
tact to foot contact) showing the occurrence of MFC event
during mid swing (toe-off to foot contact) phase. (Repro-
duced with permission from Begg et al [11]). (copyright 2005
IEEE)
Journal of NeuroEngineering and Rehabilitation 2008, 5:4 />Page 3 of 10
(page number not for citation purposes)
Methods
MFC Gait Data
MFC data from 14 healthy elderly and 10 elderly with a
history of falls (a history of falls was defined as an occur-
rence more than one fall) were taken from Victoria Uni-
versity's Biomechanics Unit database. Table 1 provides
descriptive information for the two subject samples. All
subjects (from local community and senior citizen clubs)
undertook informed-consent procedures as approved by
the Victoria University Human Research Ethics Commit-
tee. The detailed procedure for gait data collection has
been described elsewhere [4]. In brief, foot clearance data
were collected during steady state self-selected walking on
a treadmill using the PEAK MOTUS 2D (Peak Technolo-
gies Inc, Centennial, USA) motion analysis system at 50
Hz. Two reflective markers were attached to each subject's
left shoe at the fifth metatarsal head and the great toe.
Each subject completed about 10 to 20 minutes of normal
walking at a self-selected comfortable walking speed. The
foot markers were automatically digitized for the entire
walking task and raw data was digitally filtered using opti-
mal cutoff frequency, which used a Butterworth filter with
cutoff frequencies ranging from 4 to 8 Hz. The marker
positions and shoe dimensions were used to predict the
position of the shoe/foot end-point i.e., the position on
the shoe travelling closest to the ground at the time when
minimum foot clearance (MFC) occurs using a 2-D geo-
metric model of the foot [4]. MFC for each gait cycle was
calculated by subtracting ground reference from the min-
imum vertical coordinate during the mid-swing phase [4].
Estimation of ApEn of MFC
The algorithm for estimating ApEn of heart rate was first
reported by Pincus [8]. We explain that approach as
applied to MFC data. ApEn is defined as the logarithmic
likelihood that the patterns of the data that are close to
each other will remain close for the next comparison
within a longer pattern. Given a sequence of total N num-
bers of MFC like MFC(1), MFC(2), , MFC(N). To
compute ApEn of each MFC data set, m-dimensional vec-
tor sequences p
m
(i) were constructed from the MFC series
like [p
m
(1), p
m
(2), , p
m
(N-m+1)], where the
index i can take values ranging from 1 to N-m+1. If the
distance between two vectors p
m
(i) and p
m
(j) is defined
as |p
m
(j) - p
m
(i)|,
Where m specifies the pattern length which is 2 in this
study, d defines the criterion of similarity which has been
set at 15% of the standard deviation of 400 MFC data
which can produce reasonable statistical validity of ApEn
[8,9]. Referring to theoretical analysis of ApEn statistics,
Pincus and Goldberger [8] concluded that m = 2 and d =
10–25% of the standard deviation of N values (100–900
data points) will yield statistically reliable and reproduci-
ble results. C
i
m
(d) is considered as the mean of the frac-
tion of patterns of length m that resemble the pattern of
the same length that begins at index i. ApEn is computed
by using the following equation:
In our study, we use data set of 400 adjacent MFC data
points. We divide the data set into smaller sets of length,
i.e., m = 2. This amounts to 200 smaller sub sets. The next
step is to determine the number of subsets that are within
the criterion of similarity d = 15% of the standard devia-
tion of 400 MFC points. Then we repeat the same process
for the second subset till each subset is compared with the
rest of the data set. This process computes
part of equation (1) and N-
m+1 = 400-2+1 = 399. We repeat the same process for m
= 3. Approximate entropy is then calculated using equa-
tion (1).
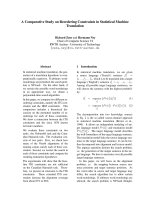
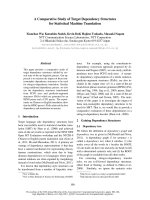
MFC Poincaré plots
MFC data plots between successive gait cycles, i.e.,
between MFCn and MFCn+1 (see Figure 2B,D), known as
MFC Poincaré plots [11], shows variability of MFC data
and describes performance of the locomotor system in
controlling the foot clearance at this critical event. Bren-
nan et al. [12] provided mathematical expressions that
relate each measure derived from Poincaré plot geometry
to well-understood existing heart rate variability indexes.
Using the method described by Brennan [12], these plots
were used to extract indexes, such as length (SD2) and
width (SD1) of the long and short axes of Poincaré plot
images. Statistically, the plot displays the correlation
between consecutive MFC data in a graphical manner.
Points above the line of identity (y = x) indicate MFC data
that are longer than the preceding MFC data point, and
points below the line of identity indicate a shorter MFC
distance than the previous. The MFC Poincaré plot typi-
cally appears as an elongated cloud of points oriented
along the line-of-identity. The dispersion of points per-
Cd
Nm
number of vectors such that p (j) p (i) d]
i
m
mm
() [=
−+
<
1
1
−
ApEn N m d N m C d N m C d
i
m
i
Nm
i
m
( , , ) ln ( ) ( ) ln ( )
()
=−+
()
−−
−
=
−−
−+
∑
1
1
1
1
11
ii
Nm
=
−
∑
1
()ln()Nm Cd
i
m
i
Nm
−+
−
=
−+
∑
1
1
1
1
Table 1: Subject Characteristics, mean (± SD)
Healthy(n = 14) Falls risk(n = 10)
Age (years) 71.0 (± 2.1) 72.2 (± 3.1)
Height (cm) 170 (± 11) 166 (± 12)
Weight (kg) 63.2 (± 14.3) 66.9 (± 8.6)
Journal of NeuroEngineering and Rehabilitation 2008, 5:4 />Page 4 of 10
(page number not for citation purposes)
pendicular to the line-of-identity reflects the level of
short-term variability [12]. The dispersion of points along
the line-of-identity is thought to indicate the level of long-
term variability.
Data analysis
All data were presented as mean ± SD. Associations
between parameters and indexes were determined using
Pearson's r. Student's (independent samples) t-test was
used in order to compare the differences between the
groups. In order to provide the relative importance of sin-
gle index in discriminating two types of gait patterns,
receiver-operating characteristics (ROC) curve analysis
was used [13,14], with the areas under the curves for each
measure represented by ROCarea. An ROCarea value of
0.5 means that the distributions of the variables are simi-
lar in both populations. Conversely, an ROCarea value of
1.0 means that the distributions of the variables of two
MFC Poincaré plotsFigure 2
MFC Poincaré plots. Top panels show MFC time series from a healthy elderly subject (A) and its corresponding Poincaré
plot (B). Bottom panels show MFC time series from an elderly subject with balance problem (C) and its corresponding Poin-
caré plot (D).
Table 2: Mean ± standard deviation of parameters for healthy and falls-risk elderly subjects.
Parameters Heatlhy (n = 14) Falls-risk (n = 10) p value
Mean MFC 1.65 ± 0.75 2.01 ± 0.51 0.20004
SD MFC 0.35 ± 0.13 0.48 ± 0.16 0.0348
SD1 0.51 ± 0.19 0.72 ± 0.25 0.0309
SD2 0.89 ± 0.32 1.15 ± 0.40 0.0453
SD1/SD2 0.64 ± 0.13 0.64 ± 0.12 0.8912
ApEn 0.13 ± 0.13 0.18 ± 0.03 0.0001
SD1 = Poincaré width, SD2 = Poincaré length, SD = standard deviation, ApEn = Approximate entropy.
Journal of NeuroEngineering and Rehabilitation 2008, 5:4 />Page 5 of 10
(page number not for citation purposes)
populations do not overlap at all. A threshold value was
applied such that any value below the threshold was
assigned into a healthy category whereas a value equal to
or above the threshold was assigned into falls risk cate-
gory. True positive or sensitivity is defined as a measure of
the ability of a single parameter to identify a falls risk gait,
whereas false positive or specificity is a measure to detect
healthy gait characteristics. ROC curve plots true positive
against false positive as the threshold decision level is var-
ied. The area under ROC curve was approximated numer-
ically using the trapezoidal rules as described in [13,14].
The best accuracy, sensitivity and specificity obtained at a
particular threshold for all features were also calculated
with ROC areas. All data analyses were performed off-line,
using custom software programs written for MATLAB (The
Mathworks, Natick, MA).
Surrogate data analysis
To prove any intrinsic relationship of locomotor control
system with ApEn, we followed a method of surrogate
data analysis introduced by Theiler et al. [15]. For each
MFC series of falls risk subjects, 10 surrogate MFC series
was obtained by randomly shuffling the original series.
Each surrogate data sets had the identical MFC distribu-
tion (i.e., same mean, SD, and higher moments) as the
original data sets and differed only in the sequential
ordering of MFC series. Then the mean of the surrogate
ApEn values were then calculated for the 10 surrogate data
sets and compared to the ApEn of the original data set.
Results
In order to compare the gait patterns of healthy elderly
and falls-risk elderly, two representative examples of MFC
time series and its corresponding Poincaré plots taken
from each group have been presented in Figures
2A,B,C&D. Gait characteristics of a healthy elderly subject
with mean MFC (= 1.56 ± 0.21 cm), and its corresponding
Poincaré plot (Figure 2B) with indexes (SD1 = 0.31, SD2
= 0.5, SD1/SD2 = 0.63) and estimated ApEn (= 0.15) are
visually different from the gait characteristics of falls-risk
elderly subject with mean MFC (= 1.71 ± 0.41 cm), and its
corresponding Poincaré plot (Figure 2D) with indexes
SD1 = 0.72, SD2 = 0.92, SD1/SD2 = 0.79) and estimated
ApEn (= 0.21). Table 2 shows the results from Student's t-
test that average values of SD MFC, SD1 and SD2 in
healthy elderly group were significantly different from
those in the falls-risk elderly group (p < 0.05). It is inter-
esting to note that difference between ApEn values in the
two groups was highly significant (p = 0.0001).
Table 3 &4 show the Pearson correlation matrices among
all tested indexes in the healthy elderly group and falls-
risk elderly group.
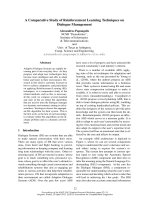
Relationship between Poincaré plot indexes and mean
MFC
The correlation analysis shown in Figure 3 that there were
significant relationship of mean MFC with SD1 and SD2
(r = 0.70, p < 0.05; r = 0.86, p < 0.01) in the falls-risk eld-
erly group. On the other hand, no significant (p > 0.05)
relationships were found in the healthy elderly group. An
insignificant but inverse relationship was found between
mean MFC and SD1/SD2 (r = -0.28, p > 0.05) in the falls-
risk group (Table 3 &4).
Relationship between ApEn and mean MFC
The correlation coefficient of mean MFC with ApEn in the
falls-risk group (r = 0.74) was significantly (p < 0.05)
higher than that in the healthy group (r = 0.14). Panel F in
Figure 3 illustrates significantly positive correlation (r =
0.74, p < 0.05) between ApEn and mean MFC measures in
the falls risk group, however, such correlation was absent
in the healthy elderly group (panel C in Figure 3).
Relationship between ApEn and Poincaré plot indexes
Correlation analysis also showed that ApEn was signifi-
cantly inversely correlated with SD1 and SD2 (r = -0.68, P
< 0.05; r = -0.74, p < 0.05) except SD1/SD2 (r = 0.38, p >
0.05) in the healthy elderly group. On the other hand, no
significant (p > 0.05) but positive correlations were found
between ApEn and SD1 & SD2 (r = 0.49, r = 0.59) in the
falls-risk group. The relationship of ApEn with SD1/SD2
in falls-risk group was also insignificant but inverse (r = -
0.28, p > 0.05).
Table 3: Correlation coefficients among measures of MFC in healthy elderly subjects
Mean MFC SD MFC SD1 SD2 SD1/SD2 ApEn
Mean MFC 1 0.31 0.51 0.21 0.38 0.14
SD MFC 1 0.90*** 0.99*** -0.36 -0.73**
SD1 1 0.81** 0.082 -0.68*
SD2 1 -0.50 -0.74**
SD1/SD2 1 0.38
ApEn 1
Correlation coefficients among mean MFC, Poincaré plot indexes (SD1, SD2, SD1/SD2) and ApEn of MFC in the healthy elderly subjects (n = 14). *
p < 0.05 ** p < 0.01 *** p < 0.001 SD1 = Poincaré width, SD2 = Poincaré length, SD = standard deviation.
Journal of NeuroEngineering and Rehabilitation 2008, 5:4 />Page 6 of 10
(page number not for citation purposes)
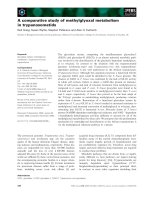
ApEn of surrogate MFC data
In order to test if the relationship of ApEn with mean MFC
in falls-risk elderly subjects is truly due to any intrinsic
characteristic of neural control of locomotor system, we
considered the ApEn values of surrogate MFC data sets
obtained by random shuffling described earlier in the
methods. We compared the mean ApEn of surrogate MFC
data with the ApEn values of the original MFC data. Figure
4 shows that significant positive relationship (r = 0.74, p
< 0.05) abolished after shuffling (r = 0.14, p = 0.69). Mean
ApEn values of surrogate MFC data in the falls-risk elderly
group is 0.28 ± 0.04 (mean ± SD) which is significantly (p
< 0.0001) higher than their original ApEn values.
ROC curve analysis
Receiver Operating Characteristics (ROC) curves were
used to characterize the quality of the single MFC indexes
with respect to the identification task. Table 5 summarizes
the classification accuracy, sensitivity, specificity and ROC
areas calculated for each index. The larger area under ROC
curve indicates better performance of that classifier. The
largest ROC area (0.90) and highest classification per-
formance (accuracy = 91.6%, sensitivity = 80% and specif-
icity = 100%) were found for ApEn, whereas the lowest
ROCarea (0.55) and lowest classification performance
(accuracy = 62.5%, sensitivity = 70% and specificity =
57.14%) were for SD1/SD2 ratio. Figure 5 shows ROC
curves for ApEn and SD2 in order to illustrate the compar-
ative performance of ApEn and SD2 as a gait pattern iden-
tifier
Discussion
The results of this study highlight the implications of non-
linear variability indexes that have been utilized to charac-
terize MFC signals of the elderly subjects during walking.
Poincaré plot geometry and ApEn analysis of MFC gait
data of elderly subjects provide useful information regard-
ing identification of gait characteristics due to balance
impairments in the elderly.
MFC data and statistics
In this study, MFC data from steady-state gait have been
used to characterize gait patterns. There are two major rea-
sons for this. Firstly, MFC provides a more sensitive meas-
ure of motor function of the locomotor system compared
to some gross overall kinematic descriptions of gait such
as joint angular changes or stride phase times, secondly its
close linkage with tripping falls [2,16]. Furthermore, long-
term MFC data, as used in this study, are required so that
variability indexes of MFC having long range correlation
could be captured representative of the real gait perform-
ance. In our previous study [4] on MFC variability statis-
tics for young/old gait patterns, we showed that MFC
variability in the elderly is higher than that in the young
subjects. Results from this study suggest that MFC varia-
bility in the healthy elderly is lower than that in the falls
risk elderly. Higher mean MFC in the falls risk elderly
group supports our previous findings [4] which showed
that increasing the MFC height is one of the possible strat-
egies used by elderly individuals to minimize tripping.
Surrogate analysisFigure 4
Surrogate analysis. Relationship of mean MFC with ApEn
for the falls-risk elderly subjects (asterisk) and for the ran-
domly shuffled MFC data sets of the same elderly subjects
(solid square). Insignificant correlation (p > 0.05) was found
in the reshuffled data sets. r = Correlation coefficient.
Table 4: Correlation coefficients among measures of MFC in falls risk elderly subjects
Mean MFC SD MFC SD1 SD2 SD1/SD2 ApEn
Mean MFC 1 0.85*** 0.70* 0.86** -0.44 0.74*
SD MFC 1 0.90*** 0.99*** -0.37 0.58
SD1 1 0.81** 0.06 0.49
SD2 1 -0.51 0.59
SD1/SD2 1-0.28
ApEn 1
Correlation coefficients among mean MFC, Poincaré plot indexes (SD1, SD2, SD1/SD2) and ApEn of MFC in the falls-risk elderly subjects (n = 10).*
p < 0.05 ** p < 0.01 *** p < 0.001 SD1 = Poincaré width, SD2 = Poincaré length, SD = standard deviation.
Journal of NeuroEngineering and Rehabilitation 2008, 5:4 />Page 7 of 10
(page number not for citation purposes)
Correlations among measures of MFCFigure 3
Correlations among measures of MFC. Panel A, B & C show the insignificant (P > 0.05) relationship of mean MFC with
SD1 (A), SD2 (B) and ApEn (C) for the healthy elderly subjects (triangle) and panel D, E, & F show significant (P < 0.01) rela-
tionship of mean MFC with SD1 (D), SD2 (E) and ApEn (F) for the falls-risk elderly subjects (asterisk). r = Correlation coeffi-
cient. See tables 3 and 4 for details.
Table 5: Classification performance
Mean MFC SD MFC SD1 SD2 SD1/SD2 ApEn
Accuracy 75% 70.8% 70.8% 70.8% 62.5% 91.7%
Sensitivity 60%70%70%30%70%80%
Specificity 85.7% 71.4% 71.4% 100% 57.14% 100%
ROC area 0.71 0.74 0.76 0.73 0.55 0.9
Classification performance (accuracy, sensitivity, specificity) and ROC areas for mean MFC, SD MFC, ApEn and Poincaré plot indexes (SD1, SD2,
SD1/SD2) of MFC.
Journal of NeuroEngineering and Rehabilitation 2008, 5:4 />Page 8 of 10
(page number not for citation purposes)
MFC Poincaré plot indexes
Our results demonstrated that gait pathology due to bal-
ance impairments was reflected in altered MFC Poincaré
plots (Figure 2D) and indexes extracted from these plots
are effective in differentiating healthy and falls-prone
gaits. Poincaré plot geometry was used in our earlier study
for young-old gait pattern classification [11]. In this study,
it has been extended to identifying elderly with a history
of falls and balance problems. The pattern of MFC Poin-
caré plots and the increased range of SD1 and SD2 values
are unique for particular type of gait abnormality like bal-
ance impairments. As both SD1 and SD2 are increased
due to balance impairments (Table 3 &4) SD1/SD2 are
not different between the two groups. Thus the indexes
derived from this geometry may be considered as a char-
acteristic parameter of diagnostic importance in clinical
gait analysis. Nonlinear dynamics [17] considers the Poin-
caré plot as the two-dimensional (2-D) reconstructed
MFC phase-space, which is a projection of the recon-
structed attractor describing the dynamics of the locomo-
tor system.
ApEn analysis for MFC data
The importance of ApEn lies in the fact that it is a measure
of disorder or randomness in the MFC signals. Higher
ApEn values displayed in the falls-risk group might be an
indication of randomness in the walking pattern of falls-
risk elderly. On the other hand for healthy elderly subjects
where MFC signals are more regular, ApEn has lower val-
ues. The value of ApEn reflecting the degree of irregularity,
randomness and complexity of the MFC time series data,
could therefore, indicate the degree of stability in the con-
trol of foot motion over the ground. In contrast, however,
Goldberger [18] proposed that increased regularity of sig-
nals represents a 'decomplexification' of illness, citing
numerous examples of illness states with increased regu-
larity of rhythms. For example, Cheyne-Stokes respira-
tion, Parkinsonian gait, loss of EEG variability,
preterminal cardiac oscillations, neutrophil count in
chronic myelogenous leukaemia and fever in Hodgkin's
disease all exhibit periodic, more regular variation in the
dynamics of disease states. In contrast to the 'decomplexi-
fication' hypothesis, Vaillancourt and Newell [19,20]
noted increased complexity and increased approximate
entropy in several disease states, including acromegaly
and Cushing's disease, and hypothesized that disease may
manifest with increased or decreased complexity, depend-
ing on the underlying dimension of the intrinsic dynamic
(e.g. oscillating versus fixed point).
It is the first time that ApEn analysis has been used to char-
acterize MFC signals. Therefore, values obtained in this
study cannot be compared with other studies. However, a
previous study involving stride interval gait time series,
Costa et al [5] applied multi-scale entropy (MSE) for ana-
lysing gait with different speeds and studied the scaling
effect on sample entropy for different walking rates. In
that study, sample entropy (SampEn) in which self
matches are excluded in the analysis, on multiple scales in
normal spontaneous walking time series was found to be
the highest value (i.e., highest complexity)when com-
pared to slow and fast walking and also to walking paced
by a metronome [5]. Although both SampEn and ApEn
quantify the regularity of a time series, methods of calcu-
lation are different [21]. In our study, ApEn values of MFC
in normal walking have been found to be higher in falls
risk subjects than in healthy subjects. A principal advan-
tage in the application of ApEn to biological signals is that
ApEn statistics may be calculated for relatively short series
of data which makes it a desirable application for routine
diagnosis of possible gait impairment.
Correlation analysis
Correlation analysis was designed to quantify the rela-
tionship of mean MFC with Poincaré plot indexes and
ApEn values, and the relationships among these meas-
ures. Significantly positive correlations of mean MFC with
SD1, SD2 and ApEn values in the falls risk subjects might
indicate that MFC variability and its randomness signifi-
cantly increase with an increase of mean MFC in falls risk
gait. On the other hand, insignificant correlations (Table
3) in the healthy subjects indicate that MFC variability
and its randomness insignificantly increase with an
ROC (receiver operating characteristics) curvesFigure 5
ROC (receiver operating characteristics) curves.
ROC (receiver operating characteristics) curves showing
true positive (sensitivity) and false positive rate (1-specificity)
for various thresholds using Approximate entropy (ApEn)
and length of the Poincaré plots (SD2) across 14 healthy eld-
erly subjects and 10 falls-risk elderly subjects. Areas of ROC
curves for ApEn and SD2 were 0.9 and 0.73 respectively.
(Table 5)
Journal of NeuroEngineering and Rehabilitation 2008, 5:4 />Page 9 of 10
(page number not for citation purposes)
increase of mean MFC. Besides, it is also interesting to
note that inverse correlations between SD1, SD2 and
ApEn values were present in healthy subjects indicating
that the more the variability the less the randomness (i.e.
lower ApEn) in their gait (Table 3 &4). In contrast, an
insignificant but positive correlations were found in falls
risk subjects. One possible interpretation may be that
higher SD1 and SD2 values, which correspond to higher
short term and long term variability respectively, of falls
risk subjects imply more random gait (i.e. higher ApEn)
due to impaired balance control system. On the other
hand, the increase of SD1 and SD2 values render more
regular gait (i.e. lower ApEn) in the gait pattern of healthy
elderly subjects. These results are interesting but it needs
to be further investigated in a larger and more diverse
sample of healthy and falls risk elderly adults.
Surrogate data analysis
The use of surrogate data was aimed at destroying the
underlying control mechanism and to increase the degree
of randomness. Absence of correlation of mean MFC with
ApEn and increased values of ApEn in the surrogate MFC
data (shown in Figure 4) proved the presence of a partic-
ular locomotor control mechanism in the falls-risk eld-
erly. Therefore, it could be inferred that MFC in the elderly
walkers is not randomly executed from stride-to-stride
rather it follows the fact that MTC output in such ageing
gait is modulated by some other unknown mechanism
which remains to be explored. These findings seem to sup-
port previous studies that have investigated complexity
break down within both temporal and spatial [7] time
series data amongst older adults and pathological groups.
ROC curves and decision
Although both Poincaré plot indexes and ApEn were effec-
tive in discriminating the gait characteristics patterns,
larger area under ROC curves for ApEn (Figure 5) sug-
gested that ApEn could perform better than Poincaré plot
indexes in classifying gait pattern. One possible reason
why a nonlinear index like ApEn could be a more effective
gait identifier might be that neural control mechanism of
healthy human gait is nonlinear and hence, correlated
with indexes derived from nonlinear analysis. This result
could be useful in designing an automated gait pattern
recognition model using nonlinear MFC variability
indexes as input features.
Future extensions
More research is needed to compare the prognostic value
and clinical utility of the various statistical and new MFC
variability measures before an ideal index can be intro-
duced for clinical intervention purposes. Before the meas-
urement of MFC variability can be considered to be of any
clinical value, however, therapeutic interventions (e.g.,
exercise program to improve balance) are needed in the
subjects who present with abnormal values (e.g., high
ApEn values, higher MFC variability). Further validation
should provide important information on whether falls
prevention intervention can improve the gait perform-
ance of falls risk elderly by monitoring the change in lin-
ear and nonlinear MFC variability indexes. Different
walking speeds may alter the MFC fluctuation magnitude
which provides an alternative approach for future investi-
gation of the relationship between ApEn and mean of
MFC time series data.
Conclusion
Early detection of gait pattern changes due to ageing and
balance impairments using indexes derived from Poincaré
plot geometry and ApEn analysis of MFC might provide
the opportunity to initiate pre-emptive measures to be
undertaken to avoid injurious falls. Also, such nonlinear
index could potentially be used as gait diagnostic marker
in clinical situation. Further investigation should be car-
ried out to validate the associations of derived nonlinear
MFC variability indexes with balance impairments in the
falls risk subjects undergoing falls prevention interven-
tion.
Competing interests
The author(s) declare that they have no competing inter-
ests.
Authors' contributions
RKB recruited subjects, managed data acquisition and par-
ticipated to drafting of the manuscript. AHK and MP con-
ceived the study, evaluated the data, performed data
analyses and wrote the manuscript. All authors read and
approved the final manuscript.
Acknowledgements
MFC gait data for this study were taken from Victoria University (VU) Bio-
mechanics database. Several people have contributed to the creation of the
gait database. The authors wish to acknowledge contributions of various
people to build this database, especially Simon Taylor of the VU Biome-
chanics Unit. This work was partially supported by an Australian Research
Council (ARC) Linkage grant (LP0454378).
References
1. Todd C, Skelton D: What are the main risk factors for falls
among older people and what are the most effective inter-
ventions to prevent these falls? [Health EvidenceNetwork
report]. [ />].
2. Winter D: The Biomechanics and Motor Control of Human Gait: Wormal,
Elderly and Pathological Waterloo: University of Waterloo Press; 1991.
3. Karst MG, Hageman AP, Jones FT, Bunner SH: Reliability of foot
trajectory measures within and between testing sessions. J
Gerontol: Med Sci 1999, 54(7):343-347.
4. Begg RK, Best RJ, Taylor S, Dell'Oro L: Minimum foot clearance
during walking: Strategies for the minimization of trip-
related falls. Gait and Posture 2007, 25:191-198.
5. Costa M, Peng C-K, Goldberger AL, Hausdorff JM: Multiscale
entropy analysis of human gait dynamics. Physica A 2003,
330:53-60.
Publish with BioMed Central and every
scientist can read your work free of charge
"BioMed Central will be the most significant development for
disseminating the results of biomedical research in our lifetime."
Sir Paul Nurse, Cancer Research UK
Your research papers will be:
available free of charge to the entire biomedical community
peer reviewed and published immediately upon acceptance
cited in PubMed and archived on PubMed Central
yours — you keep the copyright
Submit your manuscript here:
/>BioMedcentral
Journal of NeuroEngineering and Rehabilitation 2008, 5:4 />Page 10 of 10
(page number not for citation purposes)
6. Hausdorff JM, Peng CK, Ladin Z, Wei JY, Goldberger AL: Is walking
a random walk? Evidence for long-range correlations in the
stride interval of human gait. J Appl Physiol 1995, 78:349-358.
7. Hausdorff JM, Purdon PL, Peng CK, Ladin Z, Wei JY, Goldberger AL:
Fractal dynamics of human gait: Stability of long-range cor-
relations in stride interval fluctuations. J Appl Physiol 1996,
80:1448-1457.
8. Pincus SM, Goldberger AL: Physiological time-series analysis:
what does regularity quantify? Am J Physiol 1994,
266:H1643-H1656.
9. Pincus S: Approximate entropy (ApEn) as a complexity meas-
ure. Chaos 1995, 5:110-117.
10. Pincus SM: Approximate entropy as a measure of irregularity
for psychiatric serial metrics. Bipolar Disord 2006, 8:430-40.
11. Begg RK, Palaniswami M, Owen B: Support vector machine for
automated gait classification. IEEE Trans Biomed Eng 2005,
52:828-837.
12. Brennan M, Palaniswami M, Kamen PW: Do existing measures of
Poincaré plot geometry reflect nonlinear features of heart
rate variability? IEEE Trans Biomed Eng 2001, 48:1342-1347.
13. Hanley JA, McNeil BJ: The meaning and use of the area under
receiver operating characteristic (ROC) curve. Radiology
1982, 143:29-36.
14. Hanley JA, McNeil BJ: A method of comparing the areas under
receiver operating characteristic curves derived from the
same cases. Radiology 1983, 148:839-843.
15. Theiler J, Eubank S, Longtin A, Galdrikian B, Doyne F: Testing for
nonlinearity in time series: the method of surrogate data.
Physica D: Nonlinear Phenomena 1992, 58:77-94.
16. Best RJ, Begg RK, Dell'Oro L: The probability of tripping during
gait. Proceedings of Int Soc Biomech XVIIth Congress, 8–13 August,
1999; Calgary, AB, Canada 1999:234-235.
17. Takens F: Detecting strange attractors in turbulence. In
Dynamical Systems and Turbulance serial Lecture notes in Mathematics
Volume 898. Edited by: Rand DA, Young LS. Berlin, Germany:
Springer-Verlag; 1981:366-381.
18. Goldberger AL: Fractal variability versus pathologic periodic-
ity: complexity loss and stereotypy in disease. Perspect Biol Med
1997, 40:543-561.
19. Vaillancourt DE, Newell KM: Changing complexity in human
behavior and physiology through aging and disease. Neurobiol
Aging 2002, 23:1-11.
20. Vaillancourt DE, Newell KM: Complexity in aging and disease:
response to commentaries. Neurobiol Aging 2002, 23:27-29.
21. Richman JS, Moorman JR: Physiological time series analysis
using approximate entropy and sample entropy. Am J Physiol
Heart Circ Physiol 2000, 278:H2039-H2049.