Nuclear Power Control, Reliability and Human Factors Part 7 pdf
Bạn đang xem bản rút gọn của tài liệu. Xem và tải ngay bản đầy đủ của tài liệu tại đây (762.81 KB, 30 trang )
Origin and Detection of Actinides: Where do we Stand with the Accelerator Mass Spectrometry Technique? 3
Actinides T
1/2
(y) Emitted radiation
234
U 2.5 · 10
5
α
235
U 7.0 · 10
8
α
236
U 23.0· 10
6
α
238
U 4.5 · 10
9
α
238
Pu 88.0 α
239
Pu 2.4 · 10
4
α
240
Pu 6.6 · 10
3
α
241
Pu 14 β
−
242
Pu 3.8 · 10
5
α
243
Pu 5.7 · 10
−4
β
−
244
Pu 82.0 · 10
6
α
Table 1. Half-lives, T
1/2
and decay mode of Uranium and Plutonium isotopes in year, y, units.
out. Another large scale source of contamination is due to one of the worst accidents in the
history of nuclear energy that occurred on 26 April, 1986, at the Chernobyl Nuclear Power
Station near Kiev in Ukraine, affecting mainly Central and Northern Europe, although
137
Cs was detectable even in Southern Italy (Roca et al., 1989).
2. small scale includes the operation and decommissioning activities of a NPP which could
lead to airborne and liquid releases of radionuclides. At the same level, several steps in the
fuel cycle, up to the reprocessing of spent fuel, can release activation and fission products,
as well as the fissile material itself.
Obviously, given that the relative concentrations of plutonium and uranium isotopes depend
on the nature of the source material and on its subsequent irradiation history, all these sources
of contamination do not give the same contributions of contamination. As it will be shown
in the following, useful tools to solve among different contributions are the isotopic ratios:
236
U/
238
U,
240
Pu/
239
Pu,
242
Pu/
239
Pu,
244
Pu/
239
Pu and
238
Pu/
239+240
Pu,. Table 1 shows the
half lives of the relevant isotopes of U and Pu.
2.2 Different contamination sources
The relative concentrations of plutonium and uranium isotopes depend on the nature of the
source material and on its subsequent irradiation history; all these sources of contamination
do not give the same contributions of contamination.
Here are shown some example of different contamination sources:
• Being fissile material,
239
Pu is the most abundant isotope in weapon-grade plutonium.
The average ratio of
240
Pu/
239
Pu, before detonation is
240
Pu/
239
Pu≤ 0.07 while after
detonation is
240
Pu/
239
Pu 0.35 (Diamond et al., 1960), for the US tests. After detonation
239
Pu isotope is still the most abundant because the ratio is always less than one.
239
Pu is produced from
238
U via neutron capture where
238
U is the most abundant isotope
of uranium in nature,
238
U 99.275%,
235
U 0.720% and
234
U 0.005%. During detonation
of nuclear weapons and running of nuclear reactors,
239
Pu undergoes neutron capture
to generate
240
Pu, and also the heavier
241
Pu,
242
Pu and
244
Pu are produced through
successive neutron captures.
The resulting short-lived
239
U(T
1/2
= 23.45 min) decays by β
−
into
239
Np, which in turn
decays by β
−
(T
1/2
= 2.356 days) into
239
Pu:
169
Origin and Detection of Actinides:
Where Do We Stand with the Accelerator Mass Spectrometry Technique?
4 Will-be-set-by-IN-TECH
238
U
n
−→
239
U
β
−
−→
239
Np
β
−
−→
239
Pu
n
−→
240
Pu
n
−→
241
Pu
n
−→
242
Pu
In weapon test fallout, the ratio
240
Pu/
239
Pu varies depending on the test parameters in
the range of 0.10-0.35. The average for the Northern hemisphere is about 0.18, (Koide et
al., 1985).
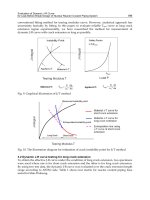
Significantly different values, in the range 0.035-0.05, are found in Mururoa and Fangataufa
atoll sediment, because of the particular nature of French testing, (Chiappini et al., 1999)
and (Hrneceka et al., 2005).
• In nuclear reactors, as mentioned before, due to the different composition of fuels, uranium
enrichment and burn-up degree, characteristic relative abundances of plutonium isotopes
will be obtained:
240
Pu/
239
Pu increases with irradiation time, which, in turn affects
238
Pu/
239+240
Pu.
238
Pu is produced by neutron capture from
237
Np, which is itself produced by two
successive neutron captures from
235
U:
235
U
n
−→
236
U
n
−→
237
U
β
−
−→
237
Np
n
−→
238
Np
β
−
−→
238
Pu
or via the fast-neutron induced
238
U(n,2n)
237
U reaction:
238
U(n,2n)
237
U
β
−
−→
237
Np
n
−→
238
Np
β
−
−→
238
Pu
The ratio
238
Pu/
239+240
Pu is useful to resolve between different sources in case they show
similar
240
Pu/
239
Pu, e.g., irradiated nuclear fuel in a PWR (Pressurized Water Reactor)
with 7-20% of
235
U and burn-up 1.4-3.9 GW·d (GWatt·day) reaches
240
Pu/
239
Pu isotopic
ratios of 0.13, a value, that could be ascribed also to global fall out. On the other side, these
two sources show quite different
238
Pu/
239+240
Pu activity ratio, 0.025-0.04 for the global
fallout and 0.45 for that nuclear fuel, (Quinto, 2007).
• Another valuable tool to identify a nuclear reactor origin of a radionuclide contamination is
236
U/
238
U isotopic ratio. The dominant
236
U mode of formation is the capture of a thermal
neutron by
235
U, a secondary contribution being the alpha decay of
240
Pu. Its concentration
in nature has been heavily increased as a consequence of irradiation of enriched uranium in
nuclear reactors. Several orders of magnitude of difference between the
236
U/
238
U isotopic
ratios in naturally-occurring uranium (10
−9
to 10
−13
) and in spent nuclear fuel (10
−2
to
10
−4
) imply that also a small contamination from irradiated nuclear fuel in natural samples
is able to increase significantly the
236
U/
238
U ratio measured in the whole sample.
2.3 Needs for actinides monitoring
The nuclear safeguard system used to monitor compliance with the Nuclear Non-proliferation
Treaty relies to a significant degree on the analysis of environmental samples. Undeclared
nuclear activities and/or illegal use and transport of nuclear fuel can be detected through
determination of the isotopic ratios of U and Pu in such samples. Accurate assessment and
monitoring of every source of radioactive contamination are required from the point of view
of the prevention from radiological exposure.
Both the operations of decommissioning of the existing NPPs and the possible future
operation of new plants demand accurate investigations about the possible contamination
by radioactive releases of nuclear sites and neighboring territory and of structural
170
Nuclear Power – Control, Reliability and Human Factors
Origin and Detection of Actinides: Where do we Stand with the Accelerator Mass Spectrometry Technique? 5
materials of the reactors. The monitoring activity of surveillance institutions uses assessed
radiometric techniques, but more and more ultrasensitive methodologies for the detection
and quantification of ultralow activity radionuclides is requested at international level.
Most of U and Pu isotopes are long lived alpha emitters with very low specific activity:
their detection and the measurement of their concentration and isotopic abundance demands
very high sensitivity, so that they are included among the so called "hardly detectable"
radionuclides. As it will be shown in the following, the required sensitivity is often not
achieved using conventional analytical techniques, such as counting of the radiation emitted
in the decay or conventional mass spectrometry. The main task of the present work is to
illustrate an ultrasensitive methodology for the detection of ultralow level radionuclides
belonging to the actinides subgroup of the periodic table.
The method is based on a combination of AS and AMS: the reason for such a combination lies
in the fact that it may be necessary to be able to measure the Pu isotopes at the fg level and
the U isotopes where the total uranium content may be at the ng level or with a sensitivity as
low as 10
−13
in the measurement of the
236
U/
238
U isotopic ratio in samples incorporating a
total of about 1 mg of U. AMS will be shown to be the only technique able to achieve such a
sensitivity together with unparalleled suppression of molecular isobaric interferences for the
detection of rare isotopes of elements with (quasi)stable isotopes many orders of magnitude
more abundant, such as U.
Nevertheless, the measurement of
238
Pu abundance is heavily suffering interference from
the atomic isobar
238
U, about seven orders of magnitude more abundant, and cannot be
achieved by any mass spectrometric technique; on the other hand ultra-low activity AS
can isolate this isotope, while alpha particles from the decay of
239
Pu and
240
Pu cannot be
energetically resolved. Combination of the two techniques provides the determination of the
abundances of the full suite of Pu isotopes. Moreover, AS plays an important role also for the
calibration of the spikes used as carriers for the AMS measurements and as overall cross check
of the employed methodologies. An important role in pursuing the goal of ultrasensitive
detection of actinide isotopes is played by the sample preparation procedures, which has to
be performed in a very clean environment with ultralow contamination. The procedure to
be setup will be able to isolate the elements of interest and produce samples in the form
suitable for both AS and AMS. In the first case very thin and uniform layers have to be
achieved, while purification respect to elements which can produce molecular interferences
is of paramount importance for AMS. Preliminary sampling and conditioning of a properly
representative sample; uranium and plutonium are separated from the sample following a
systematic chemical protocol of pre-enrichment/separation; fractions of U and Pu are purified
from every possible element that could cause radiochemical interference to AS; fractions of U
and Pu must be converted into useful chemical and physical-chemical forms (De Cesare, 2009;
Quinto et al., 2009; Wilcken et al., 2007).
Finally, besides the application of the developed technique to the assessment of actinide
contamination of the NPP site and plant, a more general objective is to provide an
ultrasensitive diagnostic tool for a variety of applications to the national and international
community. Applications range across a broad spectrum. Isotopes of plutonium are finding
application in tracing the dispersal of releases from nuclear accidents and reprocessing
operations, in studies of the biokinetics of the element in humans, and as a tracer of soil loss
and sediment transport.
236
U has also been used to track nuclear releases, but additionally
has a role to play in nuclear safeguards and in determining the extent of environmental
contamination in modern theaters of war due to the use of depleted uranium weaponry.
171
Origin and Detection of Actinides:
Where Do We Stand with the Accelerator Mass Spectrometry Technique?
6 Will-be-set-by-IN-TECH
2.4 Alpha-spectroscopy and mass spectroscopy
236
U and
239
Pu are present in environmental samples at ultra trace levels (
236
U concentration
is quoted to be in the order of pg/kg or fg/kg and
239
Pu around 100 pg/kg) and are long-lived
radionuclides (Perelygin & Chuburkov, 1997).
If one considers alpha-spectroscopy for the detection of
239
Pu, assuming an efficiency of 50 %
and a counting time of one month, one gets 64 counts (with a statistical uncertainty of 12%)
with a total activity of 50 μBq, which correspond to about 40 million atoms, or about 15 fg.
In addition, alpha-particle counting is unable to resolve the two most important plutonium
isotopes,
239
Pu and
240
Pu, because their alpha-particle energies differ by only 11 keV in 5.25
MeV. Hence, the information on their isotopic ratio readily difficult to extract.
The 23
·10
6
y half-life of
236
U limits the utility of alpha-particle spectroscopy for this isotope.
For the detection of such small amounts one can exploit the sensitivity of mass spectrometric
techniques. Conventional Mass Spectrometry, CMS, methods give information on the
240
Pu/
239
Pu ratio, and potentially have higher sensitivity than alpha-particle counting with
values as low as 1 fg, but are sensitive to molecular interferences. Both
236
Uand
x
Pu isotopes
have been measured using either Thermal Ionization (TI-MS) or Inductively Coupled Plasma
(ICP-MS) positive ion sources. For plutonium isotopes, abundance sensitivity is not a problem
due to the absence of a relatively intense beam of similar mass. Molecular interferences such as
238
UH
−
,
208
Pb
31
P, etc. may be a problem (Fifield, 2008). For uranium, isotope variability both
in the molecular (
238
UH
−
) and in tail contributions of main beam of
238
U limits the sensitivity
of ICPMS to
236
U/
238
U ratios of ∼10
−7
. TIMS ion sources, on the other hand, produce both
much lower molecular beams and much less beam tail and so a sensitivity of
∼10
−10
in the
236
U/
238
U ratio is reached.
So that, the measurements of these isotopic ratios requires the resolution of mass spectrometric
techniques, but only AMS allows the sensitivity needed e.g.
236
U/
238
U ratios of ∼10
−13
, 0.1
fg of
236
U with about 1 mg of U, as well as for the
239
Pu.
Although AMS has advantages over the other techniques for
239,240,242,244
Pu, there are
two other isotopes,
238
Pu and
241
Pu, which are of interest in some applications. Since
the concentration of
238
U is seven orders of magnitude higher than that of
238
Pu, no
chemical procedure is efficient to separate uranium and plutonium fractions to allow the
mass spectrometric measurement of
238
Pu. So alpha-spectroscopy remains the only suitable
technique for the measurement of
238
Pu concentration. The β
−
emitter
241
Pu can be measured
with either AMS or with liquid scintillation counting. Its short half-life of 14 years results,
however, in higher sensitivity for the latter (Fifield, 2008).
2.5 AMS of actinides isotopes
Actinides AMS measurements were pioneered at the IsoTrace laboratory in Toronto (CA)
(Zhao et al., 1994; 1997), where the
236
U content in an U ore was determined using the 1.6 MV
AMS system. Moreover, the relative abundances of Pu isotopes were measured at 1.25 MV.
Then, at the Australian National University (AUS) (Fifield et al., 1996; 1997) the utilization
of a higher terminal voltage (4 MV) allowed to improve the sensitivity of the method, both
for the detection limit as the minimum detectable number of U atoms in the sample, and
for the lower limit of isotopic ratio measurable in samples at high concentration. Similar
detection system have been developed at the Vienna Environmental Reasearch Accelerator
(VERA - AU) (Steier et al., 2002), at the Lawrence Livermore National Laboratory (LLNL -
USA) (Brown et al., 2004), at the Australian Nuclear Science and Technology Organisation
(ANSTO - AUS) (Hotchkis, 2000), at much lower energies at the Eidgenössische Technische
172
Nuclear Power – Control, Reliability and Human Factors
Origin and Detection of Actinides: Where do we Stand with the Accelerator Mass Spectrometry Technique? 7
Hochschule - ETH in Zurich (CH) (Wacker et al., 2005), at Munich facility (GE) (Wallner et al.,
2000) and at the accelerator of Weizmann Institute, Israel (Berkovits et al., 2000). New AMS
actinides line based on 1MV and 3 MV tandems have recently been and will be installed,
respectively, in Seville (Spain) and in the Salento (Italy). In both cases, they will be upgraded
to perform actnides AMS measurements, being the injection and the analyzing magnets
overdimensioned.
Two recent review papers (Fifield, 2008; Steier et al., 2010) summarize the results obtained in
the laboratories active in the fields of actinides AMS. Summarizing, the two systems aiming
to the best isotopic ratio sensitivity (ANU and VERA) have shown that it is possible to reach
a sensitivity of 10
−13
for
236
U in samples including about 1 mg of U. The ANSTO and LLNL
laboratories quote a sensitivity respectively of about 10
−8
and 10
−9
with U amounts of the
order of 1 ng. In the case of plutonium, there is no stable abundance isotopes available; the
plutonium isotopic ratio is not a problem and a
239
Pu concentration background of about 0.1
fg (2.5
×10
5
atoms) is achieved, limited by the process blank count rate. In both cases these
limits surmount by several orders of magnitude alpha spectrometry and conventional mass
spectrometry. In nature, U stable abundant isotopes exist. For that reason, the sensitivity limit
for the isotopic ratio depends on the U concentration in the sample. Thus, the AMS task is,
for environmental samples, to push the sensitivity in the isotopic ratio measurement down
to natural abundances (
236
U/
238
U10
−9
-10
−13
) in samples with sizeable amounts of U (∼ 1
mg). On the other hand, for anthropogenically influenced samples, the required sensitivity for
the measurement of the isotopic composition is alleviated, but significantly smaller amounts
of U have to be used (down to 1 ng). For Pu, where no stable isotope interferences are present,
the goal is the maximum possible detection efficiency, allowing few hundred counts from less
than 1 million atoms in the sample.
The CIRCE laboratory is one of the few systems in the world able to perform such a
measurement (De Cesare et al., 2010a) and the only one in Italy. Moreover it is 1 order of
magnitude higher (De Cesare et al., 2010b) with respect to the 2 systems (ANU and VERA)
providing the best
236
U/
238
U isotopic ratio sensitivity of 10
−13
, in samples including about 1
mg of U; it has low uranium contamination background, less then 0.4 μgof
236
U (De Cesare et
al., 2011). The CIRCE actinides group aims to reach and to exceed the isotopic ratio sensitivity
goal with the upgrade: the utilization of a TOF system and, in case, the installation of a
magnetic quadrupole doublet. Regarding the Plutonium background results, the CIRCE is
one of the best systems in the world (De Cesare, 2009).
3. AMS facilities
In this paragraph the facilities where the author was mainly involved will be illustrated:
CIRCE and ANU AMS systems.
3.1 CIRCE system
CIRCE is a dedicated AMS facility based on a 3MV-tandem accelerator (Terrasi et al., 2007).
In contrast to many nuclear physics applications, the pre-treated sample material (a few mg
is pressed intoa1mmdiameter Al cathodes and put in the ion source) itself is analyzed by
two mass spectrometers which are coupled to the tandem accelerator. A schematic layout of
the CIRCE facility is shown in Fig. 1.
The caesium sputter ion source is a 40-sample MC-SNICS (Multi Cathode Source for Negative
Ions by Cesium Sputtering). A total injection energy of 50 keV is used; 50-300 nA
238
U
16
O
−
molecules are energy selected by a spherical electrostatic analyzer (nominal bending radius
173
Origin and Detection of Actinides:
Where Do We Stand with the Accelerator Mass Spectrometry Technique?
8 Will-be-set-by-IN-TECH
CIRCE Accelerator
Sample
material
FCS1
Injection Magnet
ME/q
2
= 15 MeV amu/e
2
r= 0.457 m
Electrostatic
Analyser
E/q= 5.1 MeV/e
r= 2.540 m
Electrosatic
Analyser
E/q= 90 keV/e
r= 0.300 m
FC02
FC03
FC04
Offset FC and
Stable Isotope
Measurement
Beam
profile
monitor
Slit
system
y steerer
FC05
14
C
Line
Analysing Magnet
ME/q
2
= 176 MeV amu/e
2
r= 1.270 m
Focus
x/y steerer
Multi
beam
switcher
Electrostatic
quadrupole triplet
Gas
stripper
Actinides
Line
ERNA
Separator
SI
16-Strip
TOF-E
Astro
Line
Switching Magnet (20°)
B
max
= 1.3 T
ME/q
2
= 252.5 MeV amu/e
2
r=1.760 m
FC0
FC1
FC2FC3
FC4
CSSM
Windowless
Gas
Target
e
-
and J ray
detection
MD
ST0
SS1
MQT1
MQT2
SS2WF1
MQS
ST3
ST1
SS3
SS4
MQD
WF2
SS5
Recoil
Detection
IC
FC5
LFC
C
SI
Fig. 1. Schematic layout of the CIRCE accelerator and of CIRCE accelerator upgrade with the
actinides line and also the ERNA separator line, Astro line, besides the
14
C original line: the
switching magnet already inserted and the start and the stop TOF-E detector not yet inserted.
FC denotes Faraday Cup (LFC in the actinides line is Last Faraday Cup), C denotes the
Collimator in the heavy isotope line and the arrows indicate a slit system. ERNA is the
acronym of European Recoil separator for Nuclear Astrophysics.
r= 30 cm, plate gap= 5 cm) which cuts the sputter low energy tail of the beam, with a bending
angle of
±45
◦
and it is operated up to ±15 kV. The maximum electric field strength is 6
kV/cm, resulting in an energy/charge state ratio of 90 keV/q. The 90
◦
double focusing Low
Energy (LE) injection magnet (r = 0.457 m, vacuum gap= 48 mm, ME/q
2
= 15 MeV·amu/e
2
)
allows high resolution mass analysis for all stable isotopes in the periodic table, mass
resolution is M/ΔM
∼ 500 with the object and image slits set to ± 1 mm, (De Cesare et al.,
2010a). The insulated stainless steel chamber (MBS) can be biased from 0 kV to +15 kV for
beam sequencing (e.g. between
238
U
16
O
−
,
236
U
16
O
−
and between
239
Pu
16
O
−
,
240
Pu
16
O
−
,
242
Pu
16
O
−
).
The accelerator is contained inside a vessel filled with sulphur hexafluoride (SF
6
) at a pressure
of about 6 bar. Two charging chains supply a total charging current to the terminal; about
100 μA are delivered to the terminal for operation at 3.000 MV. Stabilization is achieved by
GVM feedback on the charging system high voltage supply; the long term stability is about
1 kV peak-to peak. At the terminal the ions lose electrons in the gas stripper, where Ar is
recirculated by two turbo-pumps. The working pressure is about 1.3 mTorr for
238
U
5+
at
2.875 MV.
174
Nuclear Power – Control, Reliability and Human Factors
Origin and Detection of Actinides: Where do we Stand with the Accelerator Mass Spectrometry Technique? 9
The ions with positive charge states are accelerated a second time by the same potential.
The High Energy (HE) magnet, efficiently removes molecular break-up products (De Cesare
et al., 2010a;b). The double focusing 90
◦
HE bending magnet has r= 1.27 m, ME/q
2
= 176
MeV
·amu/e
2
and M/Δ M = 725, with slit opening of ±1 mm both at object and image points.
The two 45
◦
electrostatic spherical analyzers (r = 2.54 m and gap = 3 cm) are operated up to
±60 kV; energy resolution is E/ΔE = 700 for typical beam size. A switching magnet (B
max
=
1.3 T, r=1.760 m and ME/q
2
= 252.5 MeV·amu/e
2
at the 20
◦
exit) is positioned after the ESA.
Finally the selected ions are counted in an appropriate particle detector, either a surface barrier
detector or a telescopy ionization chamber. The control of the entire system, is handled by
the AccelNet computer based system via CAMAC interfaces or Ethernet, and the acquisition
system is ether AccelNet itself or FAIR (Fast Intercrate Readout) system, (Ordine et al., 1998).
3.1.1 CIRCE actinides measurement procedures
In this paragraph a description of the various steps of the
236
U and
x
Pu isotopes measurement
are given. The relative abundance of
238
U in environmental samples is several order of
magnitude (up to 13) larger than the
236
U. For this reason, while the number of events of
236
U are measured in the final detector,
238
U is measured as current in the high energy side.
For the
x
Pu isotopes, since no natural and so abundant isotopes exist, they are all measure
in the final detector. Before performing measurements of samples, a tuning of the transport
elements up to the final detector is made by setting the accelerator parameters to the detection
of
238
U. Then the MBS, the TV and the high energy ESA are scaled to select the rare isotopes.
The sample preparation provides material that is sputtered as
x
U
y
O
−
and
z
Pu
w
O
−
. The
negative molecular ions, ex.
238
U
16
O
−
, are accelerated to an injection energy of E
inj
= 50 keV.
To select different masses without changing the magnetic field, the energy of the ions inside
the injection magnet is varied by applying an additional accelerating voltage to the bouncing
system. The injected
238
U
16
O
−
ions are accelerated by the positive high voltage towards the
stripper, where they loose electrons and gain high positive charge states. The positive ions are,
then, accelerated a second time by the same potential in the high energy tube of the tandem.
This for
238
U
5+
results in an energy of E= 17.3 MeV with a terminal voltage of V= 2.900 MV.
Ar is recirculated in the terminal stripper by two turbo-pumps; the working pressure is about
1.3 mTorr for
238
U
5+
at 2.875 MV (De Cesare et al., 2010b) and the stripping yield achieved for
238
U
5+
achieved is around 3.1%.
Molecular break-up products with mass over charge ratio (M/q) different from that of
the wanted ion, are removed by the combination of the high energy (HE) magnet and an
electrostatic analyzer (ESA) whose object point is the image point of the analyzing magnet.
For heavy ion measurements, the object and image slits of the injection magnet are closed
to
±1 mm, the slits of the analyzing magnet are closed to ±2 mm and a collimator of 4 mm
diameter is positioned in the beam waist at the 20
◦
beam line.
The tuning procedure at CIRCE is made by the optimization of HE magnet and ESA in the
high-energy side: they are optimized by maximizing the
238
U
5+
current in the Last Faraday
Cup (LFC). The transmission efficiency between the HE magnet and LFC at 20
◦
is 80 %, with
the 4 mm collimator in.
Once the setup for the pilot beam
238
U
5+
is found, the voltage at the chamber of the injection
magnet, the terminal voltage and the voltage of the ESA are scaled to transmit
236
U
5+
. In order
to measure the
236
U/
238
U ratio, the measurement procedure is composed of three automatic
steps:
175
Origin and Detection of Actinides:
Where Do We Stand with the Accelerator Mass Spectrometry Technique?
10 Will-be-set-by-IN-TECH
1. measurement of
238
U
5+
current at the high energy side in FC04.
2. the voltage on the magnet vacuum chamber, the terminal voltage and the ESA are then
scaled to transmit
236
UO
−
and a measurement of the count rate of
236
U
5+
in the detector is
performed.
3. repetition of step 1
Steps 1 and 3 are necessary to estimate, by linear interpolation, the value of
238
U
5+
current at
high energy side which would be measured simultaneously with
236
U
5+
counting.
In order to measure the
x
Pu isotope ratios, the measurement procedure is composed of
automatic steps:
1. tune the beam with the
238
U
5+
current up to LFC.
2. the voltage on the magnet vacuum chamber, the terminal voltage and the ESA are then
scaled to transmit
x
PuO
−
and a measurement of the count rate of
x
Pu
5+
in the detector is
performed.
3. repetition of step 2 for all the plutonium isotopes are needed (ex.
242
Pu
5+
spike for 18 s,
240
Pu
5+
for 60 s and
239
Pu
5+
for 30 s).
4. repetition of step 3 for 3 times.
3.1.2 CIRCE actinide results
Before the installation of a dedicated actinides beam line at CIRCE, preliminary results for
the
236
U/
238
U background ratio level at 0
◦
line, rutinelly used for
14
C measurements, was of
the order of 1
·10
−9
(De Cesare et al., 2010a). The measurement was obtained with the "K. k.
Uranfabric Joachimisthal" sample, the VERA in-house U standard, (6.98
±0.32)×10
−11
(Steier
et al., 2008).
The main upgrade so far has been the addition of a switching magnet placed 50 cm after
the exit of the high-energy ESA. The position of the magnet was decided by means of COSY
infinity (Makino & Berz, 1999) magnetic optics simulation (De Cesare et al., 2010a), Fig. 2.
This magnet provides a supplementary dispersive analyzing tool.
The abundance sensitivity results, using a 16-strip silicon detector, have shown that, in the
upgraded CIRCE heavy ions beamline after the switching magnet installation, a background
level
< 5.6×10
−11
has been reached, Fig. 3, compared to 3.0×10
−9
obtained previously (De
Cesare et al., 2010b; Guan, 2010).
Although most of the
238
U are suppressed at the injector side, by the analyzing magnet and
electrostatic analyzer, a small fraction of this intense beam can still interfere with the
236
U
measurement. The main reasons for this "leakage" of interfering ions are charge exchange
processes due to residual gas in the system. Scattering on the residual gas, electrodes, slits or
vacuum chamber walls can also allow the background to pass a filter. However, the scattering
cross-section is in the order of 10
−20
cm
2
whereas the cross section of charge changing is
10
−16
-10
−15
cm
2
(Betz, 1972; Vockenhuber et al., 2002).
Moreover, in the upgraded CIRCE heavy ions beamline, after the TOF-E installation, a
background level of about 2.9
×10
−11
, summing over the central six strips, has been reached,
compared to
∼ 5.6×10
−11
obtained with a 16 strip silicon detector alone. This small
background reduction is attributed to the 1.6 ns time resolution mainly due to the thickness
of the 4 μg/cm
2
LPA (Maier-Komor et al., 1997; 1999) carbon foil, (De Cesare, 2009).
The CIRCE laboratory is not so far from the two systems (ANU and VERA) that provide the
best
236
U/
238
U isotopic ratio sensitivity of 10
−13
, in samples including about 1 mg of U.
176
Nuclear Power – Control, Reliability and Human Factors
Origin and Detection of Actinides: Where do we Stand with the Accelerator Mass Spectrometry Technique? 11
ESA
SM
DB
SD1
SD2
FP
Fig. 2. The COSY infinity magnetic optics simulation is shown, where the development of
two beams has been analyzed, starting from the waist of the high-energy magnet with a
relative energy difference of ΔE/E = 0.001 (corresponds to the resolution of the ESA). The
adopted beam profiles are approximately Gaussian, with a halfwidth of 0.15 cm. A
maximum divergence of 3 mrad was assumed. Simulations were performed for different
geometric configurations. The distance ESA-SM (energy electrostatic analyzer-switching
magnet), SM-DB (switching magnet-magnetic quadrupole doublet) and DB-FP (Focal Plane
= the doublet focusing position) are shown in the upper part. The density relative frequency
in function of beam distance in the x-plane is shown in the lower part. The central (solid line)
peak is
236
U
5+
and the dashed and dotted are the
238
U beams in the two opposite x positions,
where the dashed one is not shown in the simulation
An overview of the planned upgrade of the CIRCE system using a TOF-E system, with a flight
path of 3 m and a thinner DLC carbon foil, 0.6 μg/cm
2
is described in (De Cesare, 2009).
Regarding the concentration sensitivity results, a 4μg uranium concentration sensitivity has
been reached using only with the 16 strip silicon detector. That correspond to about 40 fg of
236
U and 10
8 236
U atoms for a sample with isotopic ratio of 10
−8
(De Cesare et al., 2011).
For the
239
Pu concentration sensitivity results, the uranium background corresponding to the
239
Pu settings is at the level of 1 ppb. This is to be compared with the 10 ppm of ANSTO and
100 ppb of ANU. The CIRCE Lab. has at present a
239
Pu sensitivity level less than 0.1 fg, since
500 ng of uranium is required to produce an apparent
239
Pu concentration of 0.1 fg (De Cesare
et al., 2011); for the Pu background level, CIRCE is one of the best system in the word.
177
Origin and Detection of Actinides:
Where Do We Stand with the Accelerator Mass Spectrometry Technique?
12 Will-be-set-by-IN-TECH
Fig. 3. Normalized counts (counts in the detector in 300 s over FC04 current corrected for the
transmission
∼ 80% between FC04 and LFC) versus horizontal position of the 16-strip silicon
detector. Ch= 3.625 mm is the distance between the center of two adjacent strips. A photo of
the 16-strip detector is also shown. The bigger peak represents the position on the detector of
the
236
U obtained with a spike sample; the nominal ratio is
236
U/
238
U∼ 10
−8
. The lower
236
U
peak is obtained with the KkU VERA in house U standard, see text. The arrow indicates that
the normalized counts at that position are lower than 1
×10
−2
counts/nA.
3.2 ANU system
The ANU AMS system is based on a 15MV-tandem accelerator (Fifield et al., 1996). The high
terminal voltage is required to apply certain techniques of isobar separation effectively, this
makes the ANU tandem the best suited accelerator for the heavier isotopes e.g.,
36
Cl and
53
Mn (Winkler, 2008). When the lower energy is necessary, for
236
U and
x
Pu isotopes, sections
of the accelerator tube are shorted out, in order to optimize the ion optics for maximum
transmission.
The pre-treated sample material (a few mg is pressed into a 1 mm diameter Al cathode and
put in the ion source) itself is analyzed by two mass spectrometers which are coupled to the
tandem accelerator. A schematic layout of the ANU 15 MV tandem facility is shown in Fig. 4.
The caesium sputter ion source is a 32-sample MC-SNICS. This multi-cathode arrangement
allows for measuring many samples without opening the source or employing a more
complicated single cathode exchange mechanism. A total injection energy of 100 keV
was used and
∼ 20 nA of
238
U
16
O
−
molecular ions are mass rigidity selected by the 90
◦
double focusing Low Energy (LE) injection magnet (r = 0.83 m, B
max
= 1.3 T, ME/q
2
56
MeV
·amu/e
2
). This allows high resolution mass analysis for all stable isotopes in the periodic
table. In contrast to the CIRCE system, there is no electrostatic analyzer, and hence the
178
Nuclear Power – Control, Reliability and Human Factors
Origin and Detection of Actinides: Where do we Stand with the Accelerator Mass Spectrometry Technique? 13
ANU 14 UD
Accelerator
- 15 MV Tandem
Accelerator
Sample
material
Injection Magnet
B
max
= 1.3 T; r= 0.83 m
ME/q
2
~ 56 MeV amu/e
2
LE-C
Slit
system
Analyzing Magnet
B
max
= 1.7 T; r= 1.27 m
ME/q
2
~225 MeV amu/e
2
Focus
and
Preacceleration
Gas
stripper
Si-D
TOF-E
system
Magnetic
quadrupole
doublet
So-C
T-C
HE-C
St-C
L-C
IC
Solid
stripper
A
Switching Magnet (15°)
B
max
= 1.5 T; r=2.92 m
ME/q
2
~ 926 MeV amu/e
2
Wien Filter
B
max
= 0.25 T
V
max
= ±60 kV
Plate Gap= 3 cm
Gas
Magnet
Beam
profile
monitor
Chopper
Electrostatic
Quadrupole
triplet. Acts
also as a x/y
Steerers
Electrostatic
Quadrupole
triplet
Magnetic
quadrupole
Doublet.
x/y Steerers
are incorporated
y steerer
High
Terminal
Voltage
Fig. 4. Schematic lay out of the 15 MV ANU 14-UD (Units Doubled) Accelerator and the
236
U
and
x
Pu isotopes detection line. The Switching Magnet, the Wien Filter, the start and the stop
TOF-E detector, the Ionization Chamber, the magnetic quadrupole doublet and the Gas
Magnet are shown in the line. C denotes the position-Faraday Cup, A denotes the Aperture
of 1.5
×4.0 mm
2
and the arrows indicate a slits system. The Accelerator is vertical up to the
switching magnet that is indicate with a cross.
179
Origin and Detection of Actinides:
Where Do We Stand with the Accelerator Mass Spectrometry Technique?
14 Will-be-set-by-IN-TECH
low-energy sputter tail is not removed prior to injection into the accelerator. For this reason,
it is preferred to tune the system with
232
Th
16
O
−
rather than
238
U
16
O
−
(see next section).
A beam profile monitor (BPM) before the magnet and Faraday cups after the magnet (LE-Cup
and Tank-Cup) are used to monitor the beam during the tuning. The injection beam line also
features an electrostatic chopper that allows to reduce the beam intensity in cases where the
beam currents are too high for injection into the tandem accelerator or counting rates that
would be too high for the detector (e.g.
234
U). An electrostatic quadrupole and steerers are
available to have the ions pass on an optimum trajectory for injection into the accelerator.
The terminal is charged by chains made of metal pellets which are isolated from each other by
nylon links. The pellets supply a total charging current to the terminal of about 230 μA. The
accelerator is contained inside a vessel filled with sulphur hexafluoride (SF
6
) at a pressure of
about 6 bar. The voltage is measured by a generating voltmeter. Regulation is achieved by
employing a controlled corona discharge from ground to terminal. Both a gas stripper and a
foil stripper are available at the terminal. At the terminal the ions lose electrons in the stripper,
where O
2
is recirculated by two turbo-pumps; the working pressure is about 1 mTorr for
238
U
5+
at 3.995 MV. Molecular ions are dissociated and the now atomic ions stripped to higher
positive charge states (Litherland, 1980). The choice of charge state for heavy ions depends
critically on a compromise between its stripping yield and the capability of the subsequent
analyzing magnet to bend such ions. At
∼ 4 MV, ME/q
2
is ∼ 226 MeV·amu/e
2
for
238
U
5+
and ME/q
2
is ∼ 293 MeV·amu/e
2
for
238
U
4+
; since the double focusing HE magnet reaches
a maximal ME/q
2
∼ 225 MeV·amu/e
2
, the 5+ represents the lowest charge state which can be
bent by the HE magnet. Although the stripping yield to 4+ charge state is higher than 5+, it
would be necessary to operate at lower terminal voltage in order to bend the ions. Since the
transmission (due to the larger scattering angle) and the energy of the ions at this voltage is
lower there is no gain to use the lower charge state.
The ions with positive charge states are accelerated a second time by the same potential. The
High Energy (HE) magnet, efficiently removes molecular break-up products. The double
focusing 90
◦
HE bending magnet has r = 1.27 m, B
max
= 1.7 T, ME/q
2
225 MeV·amu/e
2
.
A switching magnet (B
max
= 1.5 T, r=2.92 m and ME/q
2
926 MeV·amu/e
2
at the 15
◦
exit) is
positioned after the HE magnet. A Wien filter (B
max
= 0.25 T, V
max
= ± 60 kV with a Plate Gap=
3 cm) is employed to remove backgrounds.
Finally the selected ions are counted in a final detector. The control of the acquisition system
is handled via Ethernet interfaces.
3.2.1 ANU actinides measurement procedures
In this paragraph a description of the various steps of the
236
U and
x
Pu isotope measurements
will be given. The relative abundance of
238
U in environmental samples is many orders of
magnitude (up to 13 ) larger than the
236
U. For this reason, while the number of events of
236
U are measured in the final detector,
238
U is measured as a current at the high energy side.
Before performing measurements of samples, a tuning of the transport elements up to the final
detector is required in order to maximize the ion optical transmission. The tuning is made by
setting the parameters of the beam line to the detection of
232
Th. In order to have a good
negative ion yield, molecular negative ions
232
Th
16
O
−
are extracted from the ion source. The
negative molecular ions,
232
Th
16
O
−
, are accelerated to injection energy of E
inj
= 100 keV.
The injected ions are accelerated by the positive high voltage towards the gas stripper, where
they lose electrons and gain high positive charge states. The positive ions are then accelerated
a second time by the same potential in the high energy tube of the tandem. For
232
Th
5+
,
180
Nuclear Power – Control, Reliability and Human Factors
Origin and Detection of Actinides: Where do we Stand with the Accelerator Mass Spectrometry Technique? 15
this results in an energy of E= 24.424 MeV with a terminal voltage of V= 4.098 MV. The
stripping yield is the ratio between the
232
Th
5+
beam current at the Faraday cup after the
analyzing magnet (St-C) divided by 5 and the
232
Th
16
O
−
current measured at the entrance to
the accelerator (T-C), and is about 3%. Molecular break-up products with mass over charge
ratio M/q different from that of the wanted ion are removed by the analyzing magnet and
switching magnet. The Wien filter is employed to remove backgrounds which have the same
ME/q
2
as the ions of interest but different velocities in the actinides line. For heavy ion tuning,
the object and image slits of the injection magnet are closed to
±1 mm, the slits of the analyzing
magnet are closed to
±1.25 mm and an aperture of 1.5 × 4.0 mm
2
is used if high selectivity is
required just after the Wien filter. For actual measurements, the object and image slits of the
injection magnet are opened to
±2 mm, the slits of the analyzing magnet are opened to ±3
mm and the aperture is out.
For Uranium measurements, once the setup for the pilot beam
232
Th
5+
is found, the fields
of the injection magnet, the terminal voltage of the accelerator and the electric field of the
Wien filter are scaled to
238
U
5+
for a fine tuning and then to the other wanted masses. For
236
U/
238
U, the measurement procedure is composed of two loops of three steps. Each loop
consists of integration of the
238
U
5+
beam current for 10 s in the L-C, counting of
236
U
5+
ions
for 5 min in the TOF-E system and a final
238
U
5+
integration. For
233
U (tracer),
234
U and
236
U,
the measurement procedure is composed of two loops of four steps. The isotope sequence
would usually start with the reference isotope
233
U followed by
234
U and
236
U, and finishing
with
233
U. All of them are counted with the TOF-E system. The typical counting intervals
were 1 minute for
233
U, 1 minute for
234
U and 5 minutes for
236
U.
For Plutonium measurements, once the setup for the pilot beam
232
Th
5+
is found, since
238
U
5+
may cause interference for
239
Pu
5+
, the fields of the injection magnet, the terminal voltage of
the accelerator and the electric field of the Wien filter are scaled to the Pu wanted masses,
239
Pu,
240
Pu and
242
Pu (tracer). The measurement procedure is composed of two loops of four
steps; the isotope sequence would usually start with the reference isotope
242
Pu followed by
240
Pu and
239
Pu, and finishing with
242
Pu. All of them are counted with a multiple electrode
ionization chamber that is routinely used for measurements of
x
Pu isotopes. The typical
counting intervals were 1 minute for
242
Pu, 5 minutes for
240
Pu and 3 minutes for
239
Pu.
3.2.2 Detection systems and ANU actinide results
Although most of the
238
U are suppressed at the injector side and by the analyzing magnet and
Wien filter, a small fraction of this intense beam can interfere with the
236
U measurement even
if the expected separation in the ion-optical filters is large, paragraph 3.1.2. For this reason
the detection of the
236
U at ANU is made with a TOF-E detection. The configuration of the
TOF detection system is as follows (Wilcken, 2006; Winkler, 2008); the start detector assembly
is based on a MCP and a foil is placed at an angle of 45
◦
to the beam. The MCP detects the
backscattered electrons from a 0.6 μg/cm
2
thick diamond-like carbon (DLC) (Liechtenstein et
al., 1999; 2002; 2004; 2006) foil that is used in the start detector to minimize scattering. The
stop detector is a 200 mm
2
silicon surface barrier detector which also provides a total energy
signal. The foils are mounted on a Cu mesh with a transparency of
∼ 75%. The MCP detector
was operated with the anode at ground, the accelerating grid and the front face of the MCP
at -1.8 kV, and the carbon foil at -2.8 kV. The presence of the foil, which is oriented at 45
◦
to
the beam, has two important consequences for the system. First, it causes scattering, which if
through a large-enough angle can cause ions to miss the stop detector. This can be minimized
by using the thinnest possible foil. Secondly, the 45
◦
tilt introduces differences in path length
181
Origin and Detection of Actinides:
Where Do We Stand with the Accelerator Mass Spectrometry Technique?
16 Will-be-set-by-IN-TECH
and therefore also in flight time due to the finite size of the beam at the start detector. The
effect of the flight path variations on the resolution of the system is minimized by using an
aperture that is 3.5 mm wide in the horizontal plane. This is attached on top of the grid-foil
assembly.
For plutonium measurements no interfering ions exist; an ionization chamber is suitable for
such a detection. The ANU configuration of the ionization chamber (Fifield et al., 1996;
Wilcken, 2006; Wilcken et al., 2008) are the following;
∼ 50 torr of propane is used as the
detector gas and the window is a 0.7 μm thick Mylar foil. Applied voltages are: cathode
-600 V, detector window -300 V, first grid at ground, second grid at +200 V and anode
+600 V. The energy of the
239
Pu
5+
ions is ∼ 24.5 MeV. At this energy, the range of the
plutonium ions in the ANU detector is
∼ 35 mm, which is roughly 18% of the length of the
detector. The energy loss and straggling in the detector window are approximately 4.5 MeV
and 450 keV, respectively. In addition, according to the manufacturer, a typical value for the
surface roughness of the Mylar window is 38 nm, which is 5% of the thickness of the window
and contributes an additional 140 keV of straggling. All of these result in an energy resolution
of
∼ 4%.
Regarding the abundance sensitivity results, the ANU is the best system in the word
together with VERA laboratory (Steier et al., 2010). The ANU is able to obtain values of
236
U/
238
U10
−13
(Wilcken et al., 2008), in samples including about 1 mg of U. This results
is obtained with a time of flight of 2.3 m.
Preliminary results have been obtained with a 6 m flight path; the longer flight path confers
a substantial improvement in the ability to separate
235
U and
236
U with little reduction in
efficiency (Fifield, 2011).
The concentration sensitivity limit is of the order of
∼ 1 μg of uranium.
As regard the
239
Pu concentration sensitivity results, the uranium background at the
239
Pu
settings is at the level of 100 ppb of the uranium concentration, i.e. 1 ng of uranium in the
sample results in a background equivalent to 0.1 fg of
239
Pu (Fifield, 2008).
4. Summary and conclusion
The actinides detection technique described in this chapter can be applied in the assessment
of contaminations from nuclear facility and used as sensitive fingerprints of programmed
and accidental releases; a more general goal of this technique is to provide an ultrasensitive
diagnostic tool for a variety of applications to the international community. Moreover the
origin of actinides are discussed as well as the potential of actinides to serve as a tracer for
geomorphologic processes.
The sensitivity of the different actinides measurements method and the peculiarity of the AMS
technique with respect to AS and CMS techniques have been illustrated. Furthermore the
principles and methodology of heavy-element AMS as applied to U and Pu isotopes, and
the ways in which these have been implemented in various laboratories around the world,
have been discussed. In particular the measurement procedures and the concentration and
abundance sensitivity results of two systems, CIRCE and ANU, have been described in more
details.
Those are two of the few systems in the world able to perform such measurements; the CIRCE
is the only one in Italy.
The CIRCE system is at level of
∼10
−12 236
U/
238
U isotopic ratio sensitivity which is still one
order of magnitude higher then the ANU and VERA systems.
182
Nuclear Power – Control, Reliability and Human Factors
Origin and Detection of Actinides: Where do we Stand with the Accelerator Mass Spectrometry Technique? 17
As future plan the CIRCE actinides group foresees to reach and exceed this sensitivity ratio
goal with the new upgrade: the utilization of a TOF-E system with a thinner carbon foil and,
if necessary, with a longer time of flight.
Regarding the Plutonium background results, the CIRCE is one of the best systems in the
world; it is at the level of 1 ppb. This is to be compared with ANSTO where the uranium
background is at the level of 10 ppm, and the ANU system where it is at the level of 100 ppb.
The CIRCE laboratory has at present a
239
Pu sensitivity level less then 0.1 fg.
5. Acknowledgment
I kindly thank Prof. F. Terrasi, A. D’Onofrio, N. De Cesare, L. Gialanella, Dr. C. Sabbarese
from SUN and Prof. L. K. Fifield, Dr. S. G. Tims from ANU and Dr. Y-J Guan from Guangxi
University of Nanning and all the CIRCE actinides group who helped me to make this work
possible.
Dr. P. Steier from VERA and Dr. D. Rogalla from Ruhr-Universität of Bochum and Dr. A. Di
Leva from University of Naples and Dr. A. M. Esposito from SoGIN, for useful discussions
and suggestions. This work was supported by SoGIN, Società Gestione Impianti Nucleari.
6. References
Beasley, T.M.; Kelley, J.M.; Maiti, T.C.; Bond, L.A. (1998).
237
Np/
239
Pu Atom Ratios in
Integrated Global Fallout: a Reassessment of the Production of
237
Np. Journal of
Environmental Radioactivity, Vol. 38, pp 133-146
Berkovits, D.; Feldstein, H.; Ghelberg, S.; Hershkowitz, A.; Navon, E.; Paul, M. (2000).
236
Uin
uranium minerals and standards. Nuclear Instruments and Methods in Physics Research
B, Vol. 172, pp 372-376
Betz, HD. (1972). Charge states and charge-changing cross sections of fast heavy ions
penetrating through gaseous and solid media. Reviews of Modern Physics, Vol. 44, pp
465-539
Brown, T.A.; Marchetti, A.A.; Martinelli, R.E.; Cox, C.C.; Knezovich, J.P.; Hamilton, T.F. (2004).
Actinide measurements by accelerator mass spectrometry at Lawrence Livermore
National Laboratory. Nuclear Instruments and Methods in Physics Research B, Vol.
223
˝
U224, pp 788-795
Chiappini, R.; Pointurier, F.; Millies-Lacroix, J.C.; Lepitit, G.; Hemet, P. (1999).
240
Pu/
239
Pu
isotopic ratios and
239+240
Pu total measurements in surface and deep waters around
Mururoa and Fangataufa atolls compared with Rangiroa atoll (French Polynesia). The
Science of the Total Environment, Vol. 237/238, pp 269-276
De Cesare, M. (2009). Accelerator Mass Spectrometry of actinides at CIRCE. Phd Thesis, Second
University of Naples, Department of Environmental Sciense, Caserta (Italy)
De Cesare, M.; Gialanella, L.; Rogalla, D.; Petraglia, A.; Guan, Y.; De Cesare, N.; D’Onofrio,
A.; Quinto, F.; Roca, V.; Sabbarese, C.; Terrasi, F. (2010). Actinides AMS at CIRCE
in Caserta (Italy). Nuclear Instruments and Methods in Physics Research B, Vol. 268, pp
779-783
De Cesare, M.; Guan, Y.; Quinto, F.; Sabbarese, C.; De Cesare, N.; D’Onofrio, A.; Gialanella,
L.; Petraglia, A.; Roca, V.; Terrasi, F. (2010). Optimization of
236
U AMS at CIRCE.
Radiocarbon, Vol. 52, pp 286-294
De Cesare, M.; Fifield, L.K.; Sabbarese, C.; Tims, S. G.; De Cesare, N.; D’Onofrio, A.; D’Arco,
A.; Esposito, A. M.; Petraglia, A.; Roca, V.; Terrasi, F. (2011), AMS12 conference
183
Origin and Detection of Actinides:
Where Do We Stand with the Accelerator Mass Spectrometry Technique?
18 Will-be-set-by-IN-TECH
proceeding: Actinides AMS at CIRCE and
236
U and Pu measurements of structural
and environmental samples from in and around a mothballed nuclear power plant.
Diamond, H.; Fields, P.R.; Stevens, C.S.; Studier, M.H.; Fried, S.M.; Inghram, M.G.; Hess,
D.C.; Pyle, G.L.; Mech, J.F.; Manning W.M.; Ghiorso, A.; Thompson, S.G.; Higgins,
G.H.; Seaborg G.T.; Browne, C.I.; Smith, H.L.; Spence, R. W. (1960). Heavy Isotope
Abundances in Mike Thermonuclear Device. Physical Review, Vol. 119, 2000-2004
Fifield, L.K.; Cresswell, R.G.; Tada, M.L.D.; Ophel, T.R.; Day, J.P.; Clacher, A.P.; King, S.J.;
Priest, N.D. (1996). Accelerator mass spectrometry of plutonium isotopes. Nuclear
Instruments and Methods in Physics Research B, Vol. 117, pp 295-303
Fifield, L.K.; Clacher, A.P.; Morris, K.; King, S.J.; Cresswell, R.G.; Day, J.P.; Livens, F.R. (1997).
Accelerator mass spectrometry of the planetary elements. Nuclear Instruments and
Methods in Physics Research B, Vol. 123, pp 400-404
Fifield L.K. (2008). Accelerator mass spectrometry of the actinides. Quaternary Geochronology,
Vol. 3, pp 276-290
Fifield, L.K.; Tims, S.G.; Stone, J.O.; Argento, D.C.; De Cesare, M. (2011), AMS12 conference
proceeding: Ultra-sensitive measurements of
36
Cl and
236
U at the Australian
National University
Guan, Y.G.; De Cesare, M.; Terrasi, F.; Quinto, F.; Sabbarese, C.; De Cesare, N.; D’Onofrio, A.;
Wang, H. J. (2010).
236
U AMS measurement at CIRCE. Chinese Physics C, Vol. 34, pp
1729-1732
Hotchkis, M.A.C.; Child, D.; Fink, D.; Jacobsen, G.E.; Lee, P.J.; Mino, N.; Smith, A.M.; Tuniz,
C. (2000). Measurement of
236
U in environmental media. Nuclear Instruments and
Methods in Physics Research B, Vol. 172, pp 659-665
Hrneceka, E.; Steier, P.; Wallnerbet, A. (2005). Determination of plutonium in environmental
samples by AMS and alpha spectrometry. Applied Radiation and Isotopes, Vol. 63, pp
633-638
Ketterer, M.E.; Hafer, K.M.; Link, C.L.; Royden, C.S.; Hartsock, W.J. (2003). Anthropogenic
236
U at rocky flats, Ashtabula river harbor, and Mersey estuary: three case studies
by sector inductively coupled plasma mass spectrometry. Journal of Environmental
Radioactivity, Vol. 67, pp 191-206
Ketterer, M. E. & Szechenyi, S.C. (2008). Determination of plutonium and other transuranic
elements by inductively coupled plasma mass spectrometry: A historical perspective
and new frontiers in the environmental sciences. Spectrochimica Acta Part B, Vol. 63,
pp 719-737
Koide, M.; Bertine, K.K.; Chow, T.J.; Goldberget, E.D. (1985). The
240
Pu/
239
Pu ratio, a potential
geochronometer. Earth and Planetary Science Letters, Vol. 72, pp 1-8
Liechtenstein, V.Kh.; Ivkova, T.M.; Olshanski, E.D.; Baranov, A.M.; Repnow, R.; Hellborg, R.;
Weller, R.A.; Wirth, H.L. (1999). Preparation and comparative testing of advanced
diamond-like carbon foils for tandem accelerators and time-of-Fight spectrometers.
Nuclear Instruments and Methods in Physics Research A, Vol. 438, pp 79-85
Liechtenstein, V.Kh.; Ivkova, T.M.; Olshanski, E.D.; Repnow, R.; Levin, J.; Hellborg, R.;
Persson, P.; Schenkel, T. (2002). Advances in targetry with thin diamond-like carbon
foils. Nuclear Instruments and Methods in Physics Research A, Vol. 480, pp 185-190
Liechtenstein, V.Kh.; Ivkova, T.M.; Olshanski, E.D.; Golser, R.; Kutschera, W.; Steier, P.;
Vockenhuber, C.; Repnow, R.; von Hahn, R.; Friedrich, M.; Kreissig, U. (2004). Recent
investigations and applications of thin diamond-like carbon (DLC) foils, Nuclear
Instruments and Methods in Physics Research A, Vol. 521, pp 197-202
184
Nuclear Power – Control, Reliability and Human Factors
Origin and Detection of Actinides: Where do we Stand with the Accelerator Mass Spectrometry Technique? 19
Liechtenstein, V.Kh.; Ivkova, T.M.; Olshanski, E.D.; Repnow, R.; Steier, P.; Kutschera,
W.; Wallner, A.; von Hahn, R. (2006). Preparation and investigation of ultra-thin
diamond-like carbon (DLC) foils reinforced with collodion. Nuclear Instruments and
Methods in Physics Research A, Vol. 561, pp 120-123
Litherland A.E. (1980). Ultrasensitive Mass Spectrometry with Accelerators. Annual Review of
Nuclear and Particle Science, Vol. 30, 437-473
Maier-Komor, P.; Bergmaier, A.; Dollinger, G.; Frey, C.M.; Krner, H.J. (1997). Improvement of
the preparation procedure of carbon stripper foils from the laser ablation-deposition
process. Nuclear Instruments and Methods in Physics Research A, Vol. 397, pp 131-136
Maier-Komor, P.; Dollinger, G.; Krner, H.J. (1999). Reproducibility and simplifcation of the
preparation procedure for carbon stripper foils by laser plasma ablation deposition.
Nuclear Instruments and Methods in Physics Research A, Vol. 438, pp 73-78
Makino, Kyoko & Berz, Martin (1999). COSY INFINITY version 8. Nuclear Instruments and
Methods in Physics Research A, Vol. 427, pp 338-343
O’Donnell, R.G.; Mitchell, P.I.; Priest, N.D.; Strange, L.; Fox, A.; Henshaw, D.L.; Long,
S.C.; (1997). Variations in the concentration of plutonium, strontium-90 and total
alpha-emitters in human teeth collected within the British Isles. Science of the Total
Environment, Vol. 201, pp 235-243
Ordine, A.; Boiano, A.; Vardaci, E.; Zaghi, A.; Brondi, A. (1998). A new fast trigger and readout
bus system. Nuclear Science, Vol. 45, pp 873-879
Perelygin, V.P. & Chuburkov, Yu.T. (1997). Man-made plutonium
˚
U possible serious hazard for
livingspecies. Radiation Measurements, Vol 28, pp 385-392
Quinto, F. (2007). Assessing radioactive contamination in the environment around the
Garigliano Nuclear Power Plant. Phd Thesis, Second University of Naples,
Department of Environmental Sciense, Caserta (Italy)
Quinto, F.; Steier, P.; Wallner, G.; Wallner, A.; Srncik, M.; Bichler, M.; Kutschera, W.; Terrasi, F.;
Petraglia, A.; Sabbarese, C. (2009). The first use of
236
U in the general environment
and near a shutdown nuclear power plant. Applied Radiation and Isotopes, Vol. 67, pp
1775-1780
Richter, S.; Alonso, A.; Bolle, W.D.; Wellum, R.; Taylor, P.D.P. (1999). Isotopic
´
S
´
SfingerprintsŠŠ
for natural uranium ore samples. International Journal of Mass Spectrometry, Vol. 193,
pp 9-14
Roca, V.; Napolitano, M.; Speranza, P.R.; Gialanella, G. (1989). Analysis of radioactivity
levels in soils and crops from the Campania region (South Italy) after the Chernobyl
accident. Journal of Environmental Radioactivity, Vol. 9, pp 117-129
Sakaguchi, A.; Kawai, K.; Steier, P.; Quinto, F.; Mino, K.; Tomita, J.; Hoshi, M.; Whitehead, N.;
Yamamoto, M. (2009). First results on
236
U levels in global fallout. Science of the Total
Environment, Vol. 407, pp 4238-4242
Sanchez, A.M.; Tome, F.V.; Bejarano, J.D.; Vargas, M.J. (1992).A rapid method
for determination of the isotopic composition of uranium samples by alpha
spectrometry. Nuclear Instruments and Methids in Physics Research A, Vol. 313, pp
219-226
Steier, P.; Golser, R.; Kutschera, W.; Liechtenstien, V.; Priller, A.; Valenta, A.; Vockenhuber, C.
(2002). Heavy ion AMS with a "small" accelerator. Nuclear Instruments and Methods in
Physics Research B, Vol. 188, pp 283-287
Steier, P.; Bichler, M.; Fifield, L.K.; Golser, R.; Kutschera, W.; Priller, A.; Quinto, F.; Richter,
S.; Srncik, M.; Terrasi, F.; Wacker, L.; Wallner, A.; Wallner, G.; Wilcken, K.M.; Wild,
185
Origin and Detection of Actinides:
Where Do We Stand with the Accelerator Mass Spectrometry Technique?
20 Will-be-set-by-IN-TECH
E.M. (2008). Natural and anthropogenic
236
U in environmental samples. Nuclear
Instruments and Methods in Physics Research B, Vol. 266, pp 2246-2250
Steier, P.; Dellinger, F.; Forstner, O.; Golser, R.; Knie, K.; Kutschera, W.; Priller, A.; Quinto, F.;
Srncik, M.; Terrasi, F.; Vockenhuber, C.; Wallner, A.; Wallner, G.; Wild, E.M. (2010).
Analysis and application of heavy isotopes in the environment. Nuclear Instruments
and Methods in Physics Research B, Vol. 268, pp 1045-1049
Terrasi, F.; Rogalla, D.; De Cesare, N.; DŠOnofrio, A.; Lubritto, C.; Marzaioli, F.; Passariello,
I.; Rubino, M.; Sabbarese, C.; Casa, G.; Palmieri, A.; Gialanella L.; Imbriani, G.; Roca,
V.; Romano, M.; Sundquist, M.; Loger, R. (2007). A new AMS facility in Caserta/Italy.
Nuclear Instruments and Methods in Physics Research B, Vol. 259, pp 14-17
Vockenhuber, C.; Golser, R.; Kutschera, W.; Priller, A.; Steier, P.; Winkler, S.; Liechtenstein,
V. (2002) Accelerator mass spectrometry of heaviest long-lived radionuclides with a
3-MV tandem accelerator, Pramana-Journal of Physiscs, Vol. 59, pp 1041-1051
Wacker, L.; Chamizo, E.; Fifield, L.K.; Stocker, M.; Suter, M.; Synal, H.A. (2005). Measurement
of actinides on a compact AMS system working at 300 kV. Nuclear Instruments and
Methods in Physics Research B, Vol. 240, pp 452-457
Wallner, C.; Faestermann, T.; Gerstmann, U.; Hillebrandt, W.; Knie, K.; Korschinek, G.; Lierse,
C.; Pomar, C.; Rugel, G. (2000). Development of a very sensitive AMS method for
the detection of supernovaproduced longliving actinide nuclei in terrestrial archives.
Nuclear Instruments and Methods in Physics Research B, Vol. 172, pp 333-337
Wilcken, K.M. (2006). Accelerator Mass Spectrometry of natural
236
U and
239
Pu with enphasis
on nucleogenic isotope production. Phd Thesis, Australian National University,
Department of Nuclear Physics, Canberra (Australia)
Wilcken, K.M.; Barrows, T.T.; Fifield, L.K.; Tims, S.G.; Steier, P. (2007). AMS of natural
236
U and
239
Pu produced in uranium ores. Nuclear Instruments and Methods in Physics Research
B, Vol. 259, pp 727-732
Wilcken, K.M.; Fifield, L.K.; Barrows, T.T.; Tims, S.G.; Gladkis L.G. (2008). Nucleogenic
36
Cl,
236
U and
239
Pu in uranium ores. Nuclear Instruments and Methods in Physics Research
B, Vol. 266, pp 3614-3624
Winkler, S.R. (2008). Acclerator Mass Spectrometry of heavy radionuclides with special focus
on
182
HF. Phd Thesis, Australian National University, Department of Nuclear Physics,
Canberra (Australia)
Wyse, E.J.; Lee, S.H.; Rosa, J.L.; Povinec, P.; Mora, S.J.D. (2001). ICPsector field mass
spectrometry analysis of plutonium isotopes: recognizing and resolving potential
interferences. Journal of Analytical Atomic spectrometry, Vol. 16, pp 1107-1111
Zhao, X.L.; Nadeau, M.J.; Kilius, L.R.; Litherland, A.E. (1994). The first detection of
naturally-occurring
236
U with accelerator mass spectrometry. Nuclear Instruments and
Methods in Physics Research B, Vol. 92, pp 249-253
Zhao, X L., Kilius, L.R.; Litherland, A.E.; Beasley, T. (1997). AMS measurement of
environmental U-236. Preliminary results and perspectives. Nuclear Instruments and
Methods in Physics Research B, Vol. 126, pp 297-300
186
Nuclear Power – Control, Reliability and Human Factors
Part 2
Reliability and Failure Mechanisms
10
Evaluation of Dynamic J-R Curve
for Leak Before Break Design of
Nuclear Reactor Coolant Piping System
Kuk-cheol Kim, Hee-kyung Kwon, Jae-seok Park and Un-hak Seong
Doosan Heavy Industries & Construction Co. Ltd.
Korea
1. Introduction
Because safety is of paramount importance in the nuclear industry, numerous efforts have
been made to guarantee structural integrity against sudden accidents. In the past, design
against a Double Ended Guillotine Break (DEGB) was accomplished through the
construction of massive pipe whip restraints and jet impingement shields to minimize the
secondary damage to other structures in close proximity to ruptured piping. However,
through long-term operating experience, the commercial nuclear industry has recognized
that, for most damaged piping, fluid leakage from through-wall cracks occurs prior to a
DEGB accident. Hence, if the leakage can be detected reliably at an early stage of fracture, a
DEGB accident can be prevented by shutting down the reactor prior to the DEGB. Leak-
Before-Break (LBB) design is based on this concept. For a piping system where LBB design is
applied, a leak detection monitoring system must be installed to detect crack initiation while
construction of massive pipe whip restraints and jet impingement shields become
unnecessary. Thus, LBB design focuses on the ability to detect cracks for structural integrity
while DEGB design focuses on preventing secondary damage. Since the mid-1980s, the LBB
design concept has been widely applied on nuclear high energy piping systems. In Korea,
the LBB design concept based on U.S. nuclear regulatory commission (USNRC) standard
review plan 3.6.3 and NUREG-1061 has been applied to reactor coolant piping systems ever
since the Yong-Gwang units 3 & 4 nuclear power plants were approved in 1994 (J.B.Lee &
Choi, 1999).
The LBB design applied to nuclear piping systems is based on the premise that a piping
break accident can be prevented by detecting leakage from a through-wall crack by leak
detection instrumentation prior to a DEGB accident. To meet LBB design criteria, the nuclear
piping material must have excellent fracture toughness characteristics so that a sudden
break will not occur even if the piping has a large through-wall crack that corresponds to a
detectable leakage rate. For LBB design, material properties for stress – strain curves and J-R
curves as a function of resistance to stable crack extension at service temperatures are
needed. The stress – strain curve is for use in the determination of detectable leakage crack
length and the elastic-plastic finite element analysis of the piping with a through-wall crack.
The J-R curve is for use in the crack stability evaluation of piping under normal operating
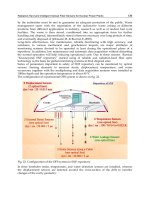
loads and safe shutdown earthquake loads. In the Korean standard nuclear power plant,
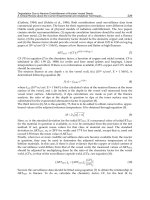
shown in Fig. 1, carbon steel with stainless steel cladding is used for the hot leg pipe and the
Nuclear Power – Control, Reliability and Human Factors
190
cold leg pipe of the reactor coolant piping system. For carbon steel, it is reported that
fracture toughness is dependent on loading speed due to dynamic strain aging (J.W.Kim &
I.S.Kim, 1997). In addition to static J-R curve testing, the dynamic J-R curve, which is a part
of facture toughness data, is also required to verify satisfaction of LBB when applying
seismic loading for carbon steel nuclear piping. However, until now it has been difficult to
obtain a reliable dynamic J-R curve for ferritic steel due to the fast loading condition. In this
paper, the measurement method for obtaining a reliable dynamic J-R curve for integrity
analysis of nuclear piping systems is proposed and discussed.
Fig. 1. Reactor coolant piping system
2. Dynamic J-R curve using DCPD and normalization methods
A dynamic J-R curve can be obtained by two different test methods; direct current potential
drop (DCPD) (Joyce, 1996) and the Normalization method (Landes et al., 1991; ASTM, 2001).
With DCPD on ferritic steel, a pulse drop phenomenon of output voltage occurs due to its
ferromagnetic characteristics, making it difficult to determine a reliable J-R curve. On the
other hand, the Normalization method, which was recently designated by the American
Society for Testing and Materials (ASTM) code, has its strong point in that the J-R curve can
be obtained by load - displacement curve without additional crack length measurement
instrumentation such as needed by DCPD. In Korea, dynamic J-R curves have been obtained
for piping materials in several nuclear power plants, and a database has been developed for
dynamic J-R curves on each material based on these test results. According to the ASTM
code at the time, the dynamic J-R curves were obtained by DCPD, but more recently, they
are obtained by the Normalization method for newly constructed power plant projects. To
utilize previous dynamic J-R curve data obtained by DCPD for piping material, the effect of
test methods was investigated.
2.1 Experimental procedure
To compare the dynamic J-R curves between the DCPD and normalization methods,
dynamic J-R curve testing was performed for base and weld metals of reactor coolant piping
systems. Test specimens were 1 inch compact tension specimens. A test speed of 1,000
Steam Generator
Pressurizer
Cold Leg Pipe
Hot Leg Pipe
Reactor Vessel
Reactor Coolant Pump
Surge Line Pipe
Evaluation of Dynamic J-R Curve
for Leak Before Break Design of Nuclear Reactor Coolant Piping System
191
mm/min for dynamic J-R testing was determined on the basis of the natural frequency
method proposed at Battelle (Scott et al., 2002) according to Eq. (1)
V
LL
= 4 × natural frequency (mode 1) × D
i
(1)
where D
i
is the load line displacement at crack initiation of the static J-R curve testing. This
test speed also satisfies the criterion of ASTM E1820 A14 (Nakamura et al., 1986; ASTM,
2009) in which test time t
Q
should be longer than minimum test time t
w
w
seff
2
t
kM
(2)
where k
s
is specimen load line stiffness in N/m, M
eff
is effective mass of the specimen, taken
here to be half of the specimen mass in kg.
Table 1 represents tested materials for each pipe and number of tests. Each hot leg is a 42
inch inner diameter pipe of SA508 Cl.1a material with a 3-½ inch nominal wall thickness.
The cold leg is a 30 inch inner diameter pipe of SA508 Cl.1a material with a 3 inch nominal
wall thickness. The elbow is SA516 Gr.70. The straight pipe and elbow are welded by
submerged arc welding (SAW) and shielded metal arc welding (SMAW). Table 2 shows the
chemical composition of the tested material and weld deposit. The comparison between
DCPD and the Normalization method is summarized in Table 3. For DCPD, potential drop
instrumentation was used for crack length measurement during the experiment but for the
Normalization method, J-R curve was estimated only by the load – displacement curve
without any crack length measurement device during the test. Therefore, in this study,
dynamic J-R curve testing was performed using DCPD and analyzed by both DCPD and
Normalization methods for each specimen with the test results compared between the two
methods. Comparison tests were performed on two power plants, Shin-Kori units 3 & 4 and
Shin-Wolsung units 1 & 2. For Shin-Kori, physical crack extension length did not exceed the
lesser of 4mm or 15% of the initial uncracked ligament in accordance with normalization
method. For Shin-Wolsung, tests were performed until full coverage of crack opening
displacement (COD) gage, 10mm in accordance with previous DCPD method as performed
at our test laboratory. Test temperature was 316
C; same as the operating temperature of the
piping system. Additionally, in the case of Shin-Wolsung, tests were performed at hot
standby temperature, 177
C. Table 1 shows the number of test specimens and test
temperatures for dynamic J-R curve testing.
Item Material
Dynamic J-R curve testing
Shin-Kori
units 3 & 4
Shin-Wolsung units
1 & 2
316
o
C 177
o
C 316
o
C
Base
metal
Main loop
piping
Hot leg SA508 Cl. 1a 1 1 1
Cold leg SA508 Cl. 1a 1 1 1
Elbow SA516 Gr. 70 1 1 1
Weld
metal
Main loop piping
segments
SMAW 1 1 1
SAW 1 1 1
Total 15
Table 1. Fracture toughness test conditions of the coolant piping
Nuclear Power – Control, Reliability and Human Factors
192
Pipe C Si Mn Cu Mo V Ni
Hot leg & cold leg <0.30 0.15~0.40 0.70~1.35 <0.2 <0.1 <0.03 <0.4
Elbow <0.30 0.15~0.40 0.85~1.20 <0.4 <0.12 <0.03 <0.4
SMAW <0.17 <0.75 <1.60 - <0.30 <0.08 <0.30
SAW <0.15 <0.80 1.25~2.10 <0.06 0.40~0.65 <0.03 <0.20
Table 2. Chemical composition of base materials and weld joints for reactor coolant piping
(%, wt)
Item DCPD method Normalization method
Crack length
measurement device
DCPD N/A
Crack length
estimation method
during the test
By variation of output voltage
when constant current is applied
to specimen
By only load-displacement
record
Effective crack
extension length
Not more than 4mm or 15% of the
initial uncracked ligament,
whichever is less as physical crack
extension length
Not more than 25% of the initial
uncracked ligament
as effective
data region at data analysis
Table 3. Comparison of dynamic J-R curve testing method
2.1.1 DCPD method
The schematic diagram of the dynamic J-R curve testing apparatus is shown in Fig. 2. The
specimen was isolated from the load frame by inserting Bakelite plates between the connecting
rods, and constant current was applied to the specimen using a power supply in order to
measure crack growth length during the test. A sufficiently high current of 100 amperes was
used to minimize error due to ferromagnetic phenomenon. (Landow & Marschall, 1991;
B.S.Lee et al., 1999) Current input wires were mechanically fastened to both sides of the
specimen with screws at points A and B in Fig. 3, and voltage measurement wires, 0.7mm in
diameter were spot welded at the points C and D. Using high-speed data acquisition, the
variation of load, crack opening displacement (COD) value and output voltage were acquired
digitally during the test. Prior to the dynamic J-R curve testing at high temperature, to
compensate for the thermal effect, the reference voltage was measured from the specimen with
current off at the test temperature. Voltage measurement was normalized by subtracting the
reference voltage from measured voltage during the dynamic J-R tests. The variation of crack
length was calculated based on Johnson’s equation, Eq. (3) (Johnson, 1965).
1
1
00
cosh y 2W
a2
cos
W
cosh U U cosh cosh y 2W cos a 2W
(3)
where U
0
and a
0
are initial output voltage and initial crack length, respectively. According to
the ASTM code (ASTM, 2009), as shown in Fig. 4(a), crack initiation point is determined as the
intersection point of the measured DCPD curve and the 5% offset line based on a linear best-fit
line of the data over the range from 0.1~0.5 P
max
. However, as shown in Fig. 4(b), in the case of
the tested ferritic steel, pulse drop phenomenon in the early loading stage of testing occurs due
to the sudden reorientation of ferromagnetic domain nearby the crack tip (Hackett et al., 1986).
Evaluation of Dynamic J-R Curve
for Leak Before Break Design of Nuclear Reactor Coolant Piping System
193
This pulse drop phenomenon makes it difficult to determine the crack initiation point. To
resolve this problem, a backtracking technique proposed by Oh (Oh et al., 2002) was selected.
Fig. 2. Data acquisition system for dynamic J-R curve testing
In the backtracking technique, the crack initiation point is estimated by using final crack
length measured in the fractured specimen. The backtracking technique is as follow; First,
prior to crack initiation, it is assumed that crack extension length is in accordance with the
standard blunting relation of Δa=J/(2σ
Y
), namely, a
0
in Eq. (3) is substituted for a
0
+J
B
/(2σ
Y
)
where J
B
=J at crack initiation. Next, with changing U
0
, the variation of crack length for each
loading point can be obtained.
Through this iterative process, U
0
is obtained such that the
calculated final crack length is in agreement with the measured final crack length. Finally,
the J-R curve is calculated using U
0
.
Fig. 3. Specimen geometry for dynamic J-R curve testing
High Speed
/Resolution
Voltmeter
Data
Acquisition
Control Unit
Load Cell
Memory
Buffer
Computer
Power Supply
Trigger Signal
Control Signal
W/2
2
y
Constant
Direct-
Current
Source,
100A
Amplifier
Data Acquisition
System
C
D
D
C
A
B
a
W
A
B