Nuclear Power Control, Reliability and Human Factors Part 8 docx
Bạn đang xem bản rút gọn của tài liệu. Xem và tải ngay bản đầy đủ của tài liệu tại đây (1.23 MB, 30 trang )
Evaluation of Dynamic J-R Curve
for Leak Before Break Design of Nuclear Reactor Coolant Piping System
199
conventional fitting method for tearing modulus curve. However, analytical approach has
uncertainty basically by fitting. In this paper, to evaluate reliable T
mat
curve at long crack
extension region experimentally, we have researched the method for measurement of
dynamic J-R curve with crack extension as long as possible.
Fig. 9. Graphical illustration of J/T method
Fig. 10. The illustration diagram for estimation of crack instability point for J/T method
3.2 Dynamic J-R curve testing for long crack extension
To obtain the effective J-R curve under the condition of long crack extension, two specimens
were used where one is for short crack extension and the other is for long crack extension.
By using two test data, the dynamic J-R curve was evaluated over the crack extension length
range according to ASTM code. Table 1 shows test matrix for reactor coolant piping base
metal for Shin-Wolsung.
Nuclear Power – Control, Reliability and Human Factors
200
Item Material
Pipe size
(Inner Dia.)
Number of test
Short crack
extension
Long crack
extension
Main Loop
Piping
Hot Leg SA508 Gr. 1a 42 in. 1 1
Cold Leg SA508 Gr. 1a 30 in. 1 1
Elbow SA516 Gr. 70 1 1
Table 4. Dynamic J-R test conditions for short and long crack extension conditions
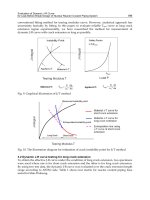
The load - displacement curve for each piping material is shown in Fig 11. In the dynamic J-
R curves obtained by normalization method, for hot leg pipe and elbow materials, dynamic
J-R curves were similar regardless of crack extension length; whereas for cold leg piping
material, J-R curve for short crack extension length was lower than that for long crack
extension length as shown in Fig.12. To analyze the reason for the difference between short
and long crack extension for cold leg pipe, normalized load-displacement curve is described
in Fig. 13. Normalized load-displacement curve, P
N
- ν’
pl
curve shows different shape
between two tests with different crack extension length. In general, normalized load –
displacement curve should maintain a constant shape regardless of crack extension size.
Therefore, optimal normalized P
N
- ν’
pl
curve should be calculated by considering both P
Ni
-
ν’
pli
data pair for short and long crack extension.
0246810
0
10
20
30
40
50
60
Load (kN)
Load Line Displacement (mm)
Short Crack Extension
Long Crack Extension
Hot Leg Pipe
0246810
0
10
20
30
40
50
60
Load (kN)
Load Line Displacement (mm)
Cold Leg Pipe
Short Crack Extension
Long Crack Extension
(a) Hot leg pipe b) Cold leg pipe
0246810
0
10
20
30
40
50
60
Load (kN)
Load Line Displacement (mm)
Elbow
Short Crack Extension
Long Crack Extension
(c) Elbow
Fig. 11. The load versus load line displacement curves for each material
Evaluation of Dynamic J-R Curve
for Leak Before Break Design of Nuclear Reactor Coolant Piping System
201
0246810
0
500
1000
1500
2000
Hot Leg Pipe
Short Crack Extension
Long Crack Extension
J-Integral (kJ/m
2
)
Crack Extension Length (mm)
024681012
0
500
1000
1500
J-Integral (kJ/m
2
)
Crack Extension Length (mm)
Cold Leg Pipe
Short Crack Extension
Long Crack Extension
(a) Hot leg pipe (b) Cold leg pipe
0246810
0
500
1000
1500
J-Integral (kJ/m
2
)
Crack Extension Length (mm)
Elbow
Short Crack Extension
Long Crack Extension
(c) Elbow
Fig. 12. The comparison of dynamic J-R curve by normalization method between the tests
for short and long crack extension
0.00 0.05 0.10 0.15 0.20
100
150
200
250
300
350
Long Crack Extension
Normalized Load, P
N
(MPa)
Normalized Displacement, V
pl
/W
Short Crack Extension
Fig. 13. Normalized load, displacement data pair and its each fitting curve for short and
long crack extension of cold leg piping material
Nuclear Power – Control, Reliability and Human Factors
202
3.3 Combined analysis
Based on this concept, combined analysis is proposed as the evaluation method of J-R curve
to long crack extension using the test results with two different crack extensions. The
procedure is as follows; At first, the P
Ni
- ν’
pli
data pair is obtained by using load – load line
displacement curve for long crack extension length in accordance with Eqs.(9) and (10), and
final P
Ni
- ν’
pli
data pair is obtained for two specimens respectively, where final P
Ni
- ν’
pli
values are
pl
f
Ni
f
P
Final P
Wa
WB
W
(9)
fff
pli
vPC
Final v'
W
(10)
A line is drawn from the final P
Ni
- ν’
pli
data pair of short crack extension tangent to the P
N
-
ν’
pl
curve of long crack extension. The right side data to the tangent point and data with ν’
pli
<0.001 are excluded from effective P
Ni
- ν’
pli
data pair. The coefficients of the fitting function
of Eq.(11) instead of Eq.(6) are calculated for two final P
Ni
- ν’
pli
values and the effective P
Ni
-
ν’
pli
data pair.
23
pl pl pl
N
pl
abv' cv' d'
P
ev'
(11)
The following least square method is used for curve fitting of the function of Eq.(11).
2
23
Npl plplpl
zPev'abv'cv'd' min.
(12)
The coefficient values, a, b, c, d, e can be calculated directly by Eq.(13).
23
pl pl pl N
pl
23 4
pl pl pl pl pl N
23 4 5
2
pl pl pl pl pl N
34 5 6
3
pl pl pl pl pl N
23 2
NplNplNplN N
nv'v' v' P
v'
a
v' v' v' v' v' P
b
c
v' v' v' v' v' P
d
v' v' v' v' v' P
e
Pv'Pv'Pv'P P
N
2
pl N
3
pl N
4
pl N
2
pl N
P
v' P
v' P
v' P
v' P
(13)
Figure 14 shows normalized load - displacement curve best-fit by Eq.(11) for two final
points of short and long crack extension cases and the effective P
Ni
- ν’
pli
data pair. Next, the
crack length a
i
coinciding with P
Ni
in Eq.(4) and with P
N
in Eq.(11) is calculated for each ν’
pli
by checking with slightly increasing crack lengths from initial crack length a
0
, where load -
displacement curve for long crack extension length is used. However, J-R curve obtained
using combined analysis was deviated from individual J-R curve for short and long crack
extension respectively in the case of hot leg pipe material as shown in Fig. 14. This reason is
Evaluation of Dynamic J-R Curve
for Leak Before Break Design of Nuclear Reactor Coolant Piping System
203
that load - displacement curve between short and long crack extension have slightly
different shape as shown in Fig. 11. Therefore, it is needed to adjust the position of middle
point by reflecting the characteristics of J-R curves for short and long crack extension. To do
so, the coincidence level is evaluated by comparing the J-R curves between normalization
analysis by only short crack extension and combined analysis. As a method of evaluation for
coincidence, best fit curve of Eq.(14) for the J-R curve of short crack extension is used.
m
JCa
(14)
0.00 0.05 0.10 0.15 0.20
100
150
200
250
300
Normalized Load, P
N
(MPa)
Normalized Displacement, V
pl
'
Final Point for Long
Crack Extension
Final Point for Short
Crack Extension
Fig. 14. The best fit curve by Equation (11) on effective data pair for combined analysis
0246810
0
500
1000
1500
2000
Hot Leg Pipe
Short Crack Extension
Long Crack Extension
Initial Combined Analysis
J-Integral (kJ/m
2
)
Crack Extension Length (mm)
Fig. 15. Dynamic J-R curve for hot leg pipe material prior to adjustment of middle point on
normalized load versus displacement curve in combined analysis
Next, the standard deviation σ of Eq.(15) is calculated from J value by combined analysis
and J value obtained by J-R curve of Eq.(14). Such that, the data of combined analysis to
short crack extension are used in calculating σ
2
fit combined
JJ
n1
(15)
Nuclear Power – Control, Reliability and Human Factors
204
where J
fit
is J value obtained by fitting function of Eq.(14) J
combined
is J value obtained by
combined analysis and n is the number of effective J-R data to short crack extension.
Optimal middle point on the normalized load-displacement relationship is determined as
a point when standard deviation σ value of Eq.(15) is reached to minimize by adjusting P
N
value at ν’
pl
value at final point of short crack extension. Using the optimal middle point,
final P
Ni
- ν’
pli
data pair of long crack extension and effective P
Ni
- ν’
pli
data pairs, J-R
curve can be estimated. Figure 9 shows the comparison of dynamic J-R curve among the
combined method and normalization method of short and long crack extension. For all
three kinds of piping, dynamic J-R curve by combined analysis is well described with the
behavior of that for two different crack extensions. From this combined analysis, we could
obtain reasonable dynamic J-R curve until long crack extension for nuclear piping
materials. In combined analysis, one J-R curve is obtained using two specimens.
Therefore, the scatter of material properties with the position of taking specimen is
required not to be large. In LBB analysis, the lowest material property is used among
three test results for material property scatter. In this approach, the J-R curve tends to be
estimated as an average J-R data for two test results. Further investigation is therefore
needed for low bound curve of J-R curve with long crack extension effectively based on
the statistical concept.
0246810
0
500
1000
1500
2000
Crack Extension Length (mm)
Hot Leg Pipe
Short Crack Extension
Long Crack Extension
Combined Analysis
J-Integral (kJ/m
2
)
024681012
0
500
1000
1500
Crack Extension Length (mm)
J-Integral (kJ/m
2
)
Cold Leg Pipe
Short Crack Extension
Long Crack Extension
Combined Analysis
(a) Hot leg pipe (b) Cold leg pipe
0246810
0
500
1000
1500
J-Integral (kJ/m
2
)
Crack Extension Length (mm)
Elbow
Short Crack Extension
Long Crack Extension
Combined Analysis
(c) Elbow
Fig. 16. The dynamic J-R curve by combined analysis for each material
Evaluation of Dynamic J-R Curve
for Leak Before Break Design of Nuclear Reactor Coolant Piping System
205
4. Conclusion
From the comparison test results between DCPD and normalization method as a dynamic J-
R curve testing method, short crack extension, dynamic J-R curves were similar but, for long
crack extension, J-R curve estimated by normalization was higher by 10~30% at the initial
loading stage than that by DCPD. For reliable J/T analysis for LBB design of nuclear piping,
material J-R curve for long crack extension is needed. However, normalization method is
applicable for only short crack extension. To overcome this problem, combined analysis
based on normalized method was proposed. In combined analysis, dynamic J-R curve with
long crack extension is estimated by two dynamic J-R curve tests with different crack
extension length. The dynamic J-R curve beyond the crack extension length range
designated by ASTM code could be estimated using the combined analysis.
5. References
ASTM (2009). ASTM E1820-09e1 Standard Test Method for Measurement of Fracture
Toughness, In:
Annual Book of ASTM Standard, Vol. 03.01, ASTM International, West
Conshohocken, Pennsylvania, USA
Ernst, H.A., Paris, P.C., Rowssow, M. & Hutchinson, J.W. (1979). Analysis of Load
Displacement Relationship to Determine J-R Curve and Tearing Instability Material
Properties. In:
ASTM STP 677 Fracture Mechanics, Smith, C.W. (Ed.), pp. 581-599,
ASTM International, ISBN EB 978-0-8031-4746-1, West Conshohocken,
Pennsylvania, USA
Ernst, H.A., Paris, P.C. & Landes, J.D. (1981). Estimations on J-integral and Tearing Modulus
T from a Single Specimen Test Record. In:
ASTM STP 743 Fracture Mechanics,
Roberts, R. (Ed.), pp. 476-502, ASTM International, ISBN EB 978-0-8031-4809-3,
West Conshohocken, Pennsylvania, USA
Hackett, E.M., Kirk, M.T. & Hays, R.A. (1986).
NUREG/CR-4550 : An Evaluation of J-R Curve
Testing of Nuclear Piping Materials Using the Direct Current Potential Drop Technique
,
U.S. Nuclear Regulatory Commission
Johnson, H.H. (1965). Calibrating the Electric Potential Method for Studying Slow Crack
Growth.
Materials Research and Standards, (September 1965), Vol.5, No.9, pp. 442-
445, ISSN 0025-5394
Joyce, J.A. (1996).
Manual on Elastic-Plastic Fracture Laboratory Test Procedures, ASTM
International, ISBN 0-8031-2069-9, West Conshohocken, Pennsylvania, USA
Kim, J.W. & Kim, I.S. (1997). Investigation of Dynamic Strain Aging on SA106-Gr.C Piping
Steel.
Nuclear Engineering and Design, Vol. 172, No. 1-2, (July 1997), pp. 49-59, ISSN
0029-5493
Scott, P.M., Olson, R.J. & Wilkowski, G.M. (2002).
NUREG/CR-6765: Development of Technical
Basis for Leak-Before-Break Evaluation Procedures, U.S. Nuclear Regulatory
Commission
Landow, M.P. & Marschall, C.W. (1991). Experience in Using Direct Current Electric
Potential to Monitor Crack Growth in Ductile Metals, In:
ASTM STP 1114 Elastic-
Plastic Fracture Test Methods
, Joyce, J.A. (Ed.), pp. 163-177, ASTM International,
ISBN-EB 978-0-8031-5172-7, West Conshohocken, Pennsylvania, USA
Nuclear Power – Control, Reliability and Human Factors
206
Landes, J.D., Zhou, Z., Lee, K. & Herrera.,R. (1991). Normalization Method for Developing J-
R Curve with the LMN Function.
Journal of Testing and Evaluation, Vol. 19, No. 4,
(July 1991), pp. 305-311, ISSN 0090-3973
Lee, B.S., Yoon, J.H., Oh, Y.J., Kuk, I.H. & Hong, J.H. (1999). Static and Dynamic J-R Fracture
Characteristics of Ferritic Steels for RCS Piping,
15th International Conference on
Structural Mechanics in Reactor Technology
, Vol. V, pp. 297-302, ISBN 89-88819-05-5
94500, Seoul, Korea, August 1999
Lee, J.B. & Choi, Y.H. (1999). Application of LBB to High Energy Pipings of a Pressurized
Water Reactor in Korea,
Nuclear Engineering and Design, Vol.190, No.1-2, (June
1999), pp.191~195, ISSN 0029-5493
Nakamura, T., Shih, C.F. & Freund, L.B. (1986). Analysis of a Dynamically Loaded Three-
Point-Bend Ductile Fracture Specimen,
Engineering Fracture Mechanics, Vol. 25, No.
3, pp. 323-339, ISSN 0013-7944
Oh, Y.J, Kim, J.H. & Hwang, I.S. (2002). Dynamic Loading Fracture Tests of Ferritic Steel
Using Direct Current Potential Drop Method.
Journal of Testing and Evaluation, Vol.
30, No. 3, (May 2002), pp. 221-227, ISSN 0090-3973
Sharobeam, M.H. & Landes, J.D. (1991). The Separation Criterion and Methodology in
Ductile Fracture Mechanics.
International Journal of Fracture, Vol. 47, No.2, (January
1991), pp. 81-104, ISSN 0376-9429
Wallen, K. (2009). Extrapolation of Tearing Resistance Curves.
2009 Proceeding of the ASME
Pressure Vessel and Piping Conference
, Vol.3, pp. 281-286, ISBN 978-0-7918-4366-6,
Prague, Czech Republic, July 2009
11
Feed Water Line Cracking in
Pressurized Water Reactor Plants
Somnath Chattopadhyay
Georgia Southern University, Statesboro, Georgia,
USA
1. Introduction
As early as 1979, a through wall crack was detected in a pressurized water reactor (PWR)
plant. This crack initiated at the counter bore region of the pipe, adjacent to the weld joint
attaching the pipe to the steam generator feed water nozzle. Subsequent inspection of the
remaining feed water piping revealed cracking in the same vicinity but these were limited to
partial wall penetration. As a result of this incident, the US Nuclear Regulatory Commission
issued a directive to all operating plants requiring them to perform inspection of their feed
water lines. The cracks were subsequently detected in the immediate vicinity of the steam
generator nozzles in a number of plants. An exhaustive investigation was undertaken
subsequently and this revealed that the primary cause of cracking was due to a fatigue
loading mechanism induced by thermal stratification and high cycle thermal oscillations
(striping) during low flow conditions.
Thermal stratification phenomenon results from a temperature differential across the pipe
cross section with the top fluid stream hot and bottom stream relatively cold. During normal
plant operations at low flow conditions, when the feed water nozzle is not completely full,
hot water from the steam generator remains in the nozzle to fill up the rest of the volume.
The difference in buoyancy between the hot and cold fluids inhibits their mixing so that the
feed water becomes and remains thermally stratified. Separation of these two flow regions is
due to the density difference in the hot and cold streams. The stratified temperature
conditions can produce very high stresses, and can occur may times during normal low
power operations; therefore this has the potential to initiate cracks in a relatively short
period of time. Thermal striping is a local phenomenon that occurs at the interface between
hot and cold flowing fluids. The interface level oscillates with periods ranging from 0.1 to 10
seconds. The oscillating fluid temperature gives rise to fluctuating stresses. The magnitudes
of the striping stresses are not as high as those due to stratification itself, but the number of
cycles is so large that they contribute significantly to fatigue crack initiation.
During normal plant operation, a series of temperature measurements has been taken
around the pipe circumference at the vicinity of the of the feed water nozzle/pipe weld.
Analysis of the data indicates that the stratified temperature distributions may be grouped
into a handful of basic profiles corresponding to different levels of the interface between the
hot and cold fluids. For analysis purposes these profiles could be assumed to be at steady
state conditions because of their long duration observed during the tests. Nuclear piping
systems (Class 1) are designed according to the rules of NB 3600 of the ASME Boiler and
Nuclear Power – Control, Reliability and Human Factors
208
Pressure Vessel Code, Section III. The loads producing the stresses originate from the
internal pressure, mechanical loads due to deadweight, seismic and thermal expansion and
the operating thermal transients. Normally piping systems are not designed for
circumferential temperature variation. The effect of the thermal stratification on the state of
stress in the pipe is manifested in two ways: (a) the difference in temperature between the
top and bottom of the pipe causes greater thermal expansion at the top tending to bow the
pipe. When such bowing is restrained global bending stresses result; (b) the interface
between the two fluid layers causes a local stress in the pipe due to thermal discontinuity
across the pipe section. The fatigue damage produced by thermal stratification and the
associated thermal striping are a good indication of the contribution of these phenomena to
the observed feed water line cracking.
A detailed finite element stress analysis has been carried out using a three dimensional
model that includes the steam generator shell, the feed water nozzle, and the elbow/pipe.
The shell nozzle/elbow model contains three distinct regions with different heat transfer
characteristics between the metal and the adjacent fluid. Each of the stratification profiles
produces a complex state of stress throughout the nozzle and the elbow (pipe). Different
levels of interface produce peak stresses at different locations around the circumference.
Since the interface level varies during low flow operating conditions, each point in the
counter bore area is subjected to a state of varying stresses of large magnitudes. A maximum
range of stress intensity analysis was carried out prior to fatigue evaluation to determine
whether the simplified elastic plastic analysis procedure would be required, and if so, to
calculate the plastic intensification factor K
e
by which the peak alternating stresses would be
multiplied. The analysis predicted crack locations that that correlated well with the
observed cracking.
The major cause of growth of the cracks is due to the thermal stratification cycles, which
occur during low flows, primarily at hot standby. The thermal striping phenomenon or the
oscillations occurring at the interface between hot and cold fluids has some influence on the
crack growth, but it certainly impacts the crack initiation predictions. Thermal stratification
causes a stress distribution in a pipe that is similar to what happens in a bimetallic strip. In
the hot upper region compressive stresses develop as a result of constrained expansion, with
the tensile stresses occurring in the lower region. This has been demonstrated using a
simplified 2-dimensional finite element model. These are essentially the membrane stresses
in the axial direction. Since the piping is flexible, the thermal moment gives rise to a bending
stress that is added to the membrane stresses to obtain the total stresses.
It is suggested that the equations for obtaining stresses in piping systems as outlined in the
ASME Code contain a term addressing circumferential temperature gradients in the pipe. A
number of remedial measures have been implemented or suggested in operating power
plants to minimize the stress amplitudes and frequency of load cycling during the
stratification events.
In recent years, thermal stratification phenomenon has been observed to exist on several
piping systems in pressurized water reactors. Damages have been observed in the main feed
water lines, pressurizer spray lines, unisolable branch piping connected to reactor coolant
piping, and pressurizer surge lines, with evidence linked to thermal stratification. The
stratification phenomenon results from a temperature differential across the pipe cross-
section with the top fluid stream hot and the bottom stream relatively cold. This condition
occurs under relatively low flow conditions by cold feed injection into a stagnant hot pipe
region or vice versa. Separation of two fluid flow areas is due to density differences in the
Feed Water Line Cracking in Pressurized Water Reactor Plants
209
hot and cold streams. This gives rise to gross thermal bending moments across the pipe
section resulting in bowing deformation of the pipe.
In May 1979, a pressurized water reactor plant in operation approximately a year developed
a through-wall crack in one of its feed water lines at the entrance to the steam generator.
Subsequent investigation of the remaining lines revealed cracking in the same vicinity but
limited to partial wall penetration. As a result of this incident, the United States Nuclear
Regulatory Commission submitted a directive to all PWR operating plants to perform
inspection of their feed water lines. A number of plants produced same degree of cracking
in the same general area with wide variety of size, orientation and length of plant operation.
Because of the involvement of many variables, it was impossible to immediately identify the
specific mechanisms of crack initiation and growth. A number of activities were initiated to
investigate the structural, thermal, hydraulic, operational and environmental conditions
which individually or collectively contributed to the observed cracking.
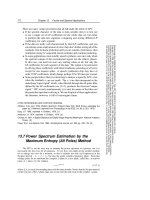
2. Observed crack locations
Figure 1 illustrates the feed water pipe to steam generator nozzle junction where majority of
cracking occurred. Cracks were found to be oriented circumferentially and located in the
base metal outside the heat affected zone. There were intermittent pitting throughout the
inside surface. The deepest cracks were found at the base of the counter-bore transition
Fig. 1. Location of Cracks in PWR Feed water Pipe to Nozzle Attachment Region
[1]
Typically a majority of PWR plants produced the circumferential cracking, the pattern of
depth orientation varied considerably for different plants. Generally the deepest cracking
was observed at the top, although in a number of plants this was found to occur at the sides,
as well as the bottom. With the exception of one through-wall condition, most plants
produced relatively small shallow cracks.
3. Metallurgical studies
The metallurgical investigations revealed that although corrosion may have been a major
factor in initiating the cracks, the primary driving force for crack growth was mainly
mechanical in nature. The corrosion fatigue may have resulted the cracking; both high and
low cycle fatigue were involved, with high cycle initiating the fatigue and the low cycle
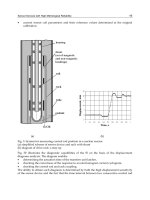
propagating it. The fracture appearances were studied at high magnification by electron
microscopy. Striations were found (Figure 2) substantiating the evidence that crack growth
Nuclear Power – Control, Reliability and Human Factors
210
was taking place by fatigue, although the striation spacing was unreliable as a measure of
the growth rate, since a large range of temperatures were involved (200 - 450°F).
Fig. 2. Fractographs of the tip of a Deep Crack
[1]
Instrumentations were installed at various plants to measure vibration and displacements of
the feed water piping as well as temperatures in the vicinity of pipe to nozzle junction. The
plants (both with and without observed cracking) were surveyed to determine their
transient operation history and chemistry control. Particular attention was paid to the feed
water oxygen content because of the presence of pitting. Thermocouple data of the on-site
testing demonstrated the existence of persistent pipe thermal stratification during low feed
water flow operations such as feed water makeup cycling during hot standby.
4. Flow model studies
Based on flow model tests it was shown that the temperature profile in a stratified cross
section is mainly correlated with two thermal hydraulic parameters: (a) the flow rate in the
line, and (b) the temperature difference between the top and the bottom of the pipe cross-
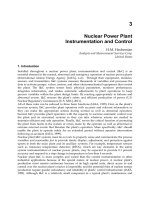
section under consideration. The flow model test was a full scale feed line and nozzle
assembly made of Plexiglas for visual observation and fluid temperature measurement
Feed Water Line Cracking in Pressurized Water Reactor Plants
211
(Figure 3). The test was designed to establish the temperature profile of the stratified water
more accurately than the field measurements and to determine that thermal striping exists
at the stratified interface, and if so determine the magnitudes and frequencies.
Fig. 3. Flow Model Test showing Stratification: upper clear layer hot water, lower gray layer
cold saline solution
[2]
The fluid temperature oscillations were recorded and it was subsequently confirmed that
thermal striping mechanism led to feed line thermal fatigue.
5. Structural analysis
`During normal plant operation at low power conditions water is supplied to the steam
generators at very low flow rates. When the flow rate is not high enough to completely fill
the nozzle, hot water from the steam generator remains in the nozzle to fill up the rest of the
volume. The difference in buoyancy between the hot and cold fluids inhibits their mixing so
that the feed water becomes and remains thermally stratified as long as the flow rate is less
that that required to completely fill the nozzle. During normal plant operation a series of
temperature measurements was taken around the pipe circumference at the vicinity of the
pipe weld. Analysis of the test data indicated that the stratified temperature distributions
may be grouped into six basic profiles corresponding to different levels of the interface
between the hot and cold fluids and are shown in Figure 4.
Nuclear Power – Control, Reliability and Human Factors
212
Fig. 4. Stratified Temperature Profiles
[3]
Feed Water Line Cracking in Pressurized Water Reactor Plants
213
A finite element model has been prepared that includes a part of the steam generator shell,
the feed water nozzle and the connecting elbow. The model uses 20-node isoparametric
solid elements, two elements through the thickness and twelve around the circumference of
the model.
The shell/nozzle/elbow model contains three distinct regions with different heat transfer
characteristics between the metal and the adjacent fluid. The first region is that of the
inside of the steam generator shell exposed to slowly moving hot water. The other regions
are the section of the nozzle under the thermal sleeve, and the rest of the nozzle and the
elbow.
Each of the stratification profiles produces a complex stress state throughout the nozzle and
the elbow. The highest stresses occur in the weld counter bore region at the root of the
elbow transition. For each profile there is a zone of compressive stress above the hot/cold
interface and a region of tensile stress below it. Different interface levels produce peak
stresses at different locations around the circumference. Since the interface level varies
during low flow operating conditions, each point in the counter bore area is subjected to
varying stress state.
Fatigue evaluations have been performed around the circumference for the counter bore
transition root and along the top and side of the counter bore region. The load conditions
and the number of cycles were combined with a pressure of 7.6 MPa. A maximum range of
stress intensity analysis was performed prior to each fatigue evaluation to determine
whether the simplified elastic plastic analysis procedure would be required and if so, to
calculate the plasticity intensification factors, K
e
factors by which the peak alternating
stresses are to be multiplied.
The results for a typical plant fatigue evaluation [3] indicate that the peak usage factors are
well above 1.0 and occur at the top and sides. These correlate with the observed locations of
the deepest cracks for that plant. The high usage factors conclusively implicate thermal
stratification and thermal striping during low flow conditions as prime contributors to the
observed feed line cracking.
6. Analytical studies
An analytical technique has been developed to evaluate the stresses due to circumferential
temperature gradient during thermal stratification. The associated numerical solution is
an approximate one that uses the standardized profiles of Figure 4. The mean
temperatures at various circumferential pipe segments are calculated and shown in
Figure 5.
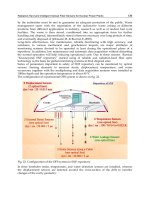
The stress distributions for the Profiles 1 through 6 has been computed using the
approximate numerical model and are shown in Figure 6.
The maximum range of stresses occurs at the top of the pipe and equals 72-(-124) = 196 MPa
(based on profiles 2 and 1). Although the peak stress due to through the thickness
temperature has not been explicitly considered, a conservative value of 2.0 is used. This
makes the alternating stress amplitude as 196 MPa, which gives the allowable number of
cycles about 30,000 using the design curve of [5]. The plant data in [4] indicates a
comparable number of stratification temperature excursions. This leads to a significant
fatigue usage factor at the top of the pipe that correlates with the fatigue cracks observed at
this location.
Nuclear Power – Control, Reliability and Human Factors
214
Fig. 5. Calculated Temperature input to the Approximate Numerical Model
[4]
Fig. 6. Stress Distribution across Pipe Diameter for Profiles 1 through 6
[4]
7. References
[1] Enrietto, J.F., Bamford, W. H., and White, D. H. (1981), “Preliminary Investigation of
PWR Feed water Line Cracking, International Journal of Pressure Vessels and Piping, 9,
pp. 421-443.
[2] Hu, M. H., Houtman, J. L., and White, D. H. (1981) “Flow Model test for the Investigation
of Feed water Line Cracking for PWR Steam Generators, ASME Paper 81-PVP-4.
[3] Thurman, A. L., Mahlab, M. S., and Boylstein, R. E. (1981), “3-D Finite Element Analysis
for the investigation of Feed water Line Cracking in PWR Steam Generators, ASME
Paper 81-PVP-3.
[4] Chattopadhyay, S. (2009), “Structural Evaluation of a Piping System Subjected to
Thermal Stratification,” Nuclear Engineering and Design, 239, pp. 2236-2241.
[5] ASME Boiler and Pressure Vessel Code, 2010, Section III, Nuclear Power Components,
American Society of Mechanical Engineers, New York.
12
Degradation Due to Neutron
Embrittlement of Nuclear Vessel Steels:
A Critical Review about the Current
Experimental and Analytical Techniques to
Characterise the Material, with Particular
Emphasis on Alternative Methodologies
Diego Ferreño, Iñaki Gorrochategui and Federico Gutiérrez-Solana
University of Cantabria (UC) - Technological Centre of Components of Cantabria (CTC)
Spain
1. Introduction
The pressure vessel constitutes the most important structural component in a nuclear
reactor from the point of view of its safety. The core of the reactor, that is, the nuclear fuel, is
accommodated inside the vessel. This material is composed of fissile nuclides that undergo
chain nuclear reactions of an exothermic nature, thus generating usable energy. Uranium
235 (U-235) is the only isotope in Nature which is fissile with thermal neutrons; hence, it is
used as nuclear fuel in Light Water Reactors (LWRs). Two technologies of LWRs can be
distinguished, Pressurized Water Reactors (PWRs) and Boiling Water Reactors (BWRs).
Currently, more than 400 nuclear reactors operate in the world of which, approximately,
57% are PWR and 22% BWR. The original design lifetime for LWRs is 40 calendar years;
nevertheless, the current target for most plants in many countries in Europe, Japan and the
USA is to extend their operative lifetime up to 60 years.
The nuclear vessel is a virtually irreplaceable element which is subjected to operating
conditions that lead to a progressive degradation in time of its constituent steel. The chain
fission reactions of U-235 entail the emission of high energy neutrons that inevitably
impact the internal surface of the vessel. These collisions give rise to a complex series of
events in the nano and microstructural scale that, in the end, modify the mechanical
properties of the steel leading to its embrittlement, that is, the decrease in its fracture
toughness. This phenomenon is most intense in the so called beltline region (which is the
general area of the reactor vessel near the core midplane where radiation dose rates are
relatively high). The total number of neutrons per unit area that impact the internal
surface of the vessel represents the neutron fluence; in practice, only that fraction of the
energy spectrum corresponding to a neutron kinetic energy higher than 1 MeV is
considered to be capable of triggering damage mechanisms in the vessel steel; these
neutrons are referred to as fast neutrons. Typical design end of life (EOL) neutron
Nuclear Power – Control, Reliability and Human Factors
216
fluences (E>1 MeV) for BWRs are in the order of 10
18
n/cm
2
, whereas for PWRs this
number is about 10
19
n/cm
2
.
In Section 2 of this chapter, the embrittlement of nuclear vessel steels is described from a
purely phenomenological perspective as well as from the point of view of the legislation
currently in force. The phenomenon of the ductile to brittle transition and the influence of
embrittlement on it are particularly stressed. In Section 3, a brief description of the main
characteristics of the nuclear power plants surveillance programmes is presented; the
requirements that they envisage as well as the information that they allow to be obtained are
pointed out. The physical mechanisms that take place in the nano and micro levels leading
to the material embrittlement are detailed in Section 4 where a brief exposition concerning
the most relevant predictive models for embrittlement is also presented. Finally, in Section
5, the promising method of the Master Curve is described; this represents an improved
methodology for the description of the fracture toughness of vessel steels in the ductile to
brittle transition region, susceptible to be incorporated in the current structure of the
surveillance programmes.
2. The embrittlement of nuclear vessel steels and its influence on the ductile
to brittle transition region: Phenomenology and regulations
2.1 The phenomenology of the embrittlement and the ductile to brittle transition
region
As mentioned above, neutron irradiation reduces vessel steel toughness. To understand the
concept of material fracture toughness, Fracture Mechanics theory must be referred to. In
this section, the basic principles of Fracture Mechanics are briefly presented. Material
toughness can be understood as its resistance to be broken when subjected to mechanical
loading (forces, stresses) in the presence of cracks / flaws (that is, a sharpened
discontinuity). Traditionally, RPV toughness variation has been indirectly quantified by
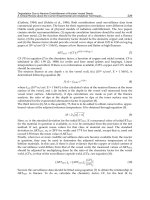
means of Charpy impact tests. These tests were introduced by the French researcher George
Charpy in 1905. The preparation, execution and interpretation of Charpy tests are currently
regulated by the ASTM E 23 standard (ASTM E 23, 2001). The test consists of breaking a
small dimension (10 x 10 x 55 mm
3
) specimen by the impact of a pendulum released from a
controlled height and measuring the height it achieves after the breaking (see Figure 1).
First, a notch has to be machined in the specimen that acts as stress concentrator, forcing the
fracture process. The expression “notch” refers to a blunted defect and, therefore, must not
be misunderstood as a crack or flaw (described above). The main numerical result provided
by the Charpy test (though not the only one) is the energy absorbed during the specimen
breaking, also called resilience, which is used as a semi-quantitative estimation of the
material fracture toughness.
Because of its simplicity of execution and for historical reasons, this experimental technique
is still employed in several industries such as the naval, building and pressure vessel design
and, in particular, in nuclear vessels. However, several limitations associated to the Charpy
impact test can be mentioned. First, the fracture process occurs under highly dynamic
conditions and, therefore, can hardly be extrapolated to quasi-static fracture processes (as
the ones occurring in many components and, predictably, in nuclear vessels). Moreover, it
has been demonstrated that the results provided by the Charpy test, such as the resilience,
do not represent genuine material properties, which can be applied to components of
different dimensions and loading conditions; as mentioned above, the resilience may be
Degradation Due to Neutron Embrittlement of Nuclear Vessel Steels:
A Critical Review about the Current Experimental and Analytical Techniques…
217
considered only as a semi-quantitative estimator. Finally, the standard specimen notched
geometry, which facilitates its breaking, is far from simulating an ideal crack, that is, a
sharpened discontinuity embedded in the material.
Fig. 1. Sketch of the Charpy pendulum and the standard Charpy specimen
Experience shows that the vessel steel fracture properties drastically depend on
temperature. This phenomenon is clearly appreciated in the resilience curves, which are
obtained from Charpy tests carried out at different temperatures. Thus, in Figure 2, it can be
appreciated how the absorbed energy in the specimen breaking process varies from low
values at low temperatures, in the region called brittle or Lower Shelf, to high absorbed
energies at high temperatures, in the ductile region or Upper Shelf. The intermediate
temperatures constitute what is called the Ductile to Brittle Transition Region, DBTR. One
additional property of the DBTR is that the resilience values present an important scatter, as
can also be inferred in Figure 2. In order to simplify the analysis, it is common practice to fit
the data according to mathematical expressions such as the hyperbolic tangent, see Figure 2
(the free parameters A, B, C and D must be obtained through the fitting procedure, typically
a least squares method). The existence of three regions and the scatter of the results in the
DBTR are also observable in the fracture toughness curves. According to this, the
description of the vessel steels toughness in the DBTR represents a remarkable engineering
problem because, on the one hand, this property changes ostensibly with temperature and,
on the other hand, it shows an important scatter.
Figure 3 shows an example of a vessel steel neutron irradiation embrittlement. In this figure,
Charpy impact test results (absorbed energy vs. temperature) from unirradiated and irradiated
material, respectively, are represented. As can be seen, the most remarkable effects are a shift
Nuclear Power – Control, Reliability and Human Factors
218
of the curve in the DBTR towards higher temperatures accompanied by a reduction in the
absorbed energy in the Upper Shelf, that is, a generalised embrittlement process.
0
20
40
60
80
100
120
140
160
180
200
-150 -100 -50 0 50 100 150 200
Temperature (ºC)
Energy (J)
LOWER SHELF
UPPER SHELF
TRANSITION
REGION
TC
EABTh
D
Fig. 2. Influence of temperature on the results (absorbed energy) of the Charpy test; the data
were fitted to a hyperbolic tangent curve
In regard to nuclear vessel structural integrity assessment, it is of great interest to determine
the neutron irradiation effect on the fracture properties in the DBTR. In the nuclear industry,
it is common to simplify this phenomenon by means of the definition of standard
temperatures that are considered as representative. Among these, the most used ones are
T
28J
and T
41J
, that is, the temperatures where the Charpy impact test absorbed energies are 28
J and 41 J, respectively (obtained after fitting the results to a hyperbolic tangent curve).
0
20
40
60
80
100
120
140
160
180
200
-150 -100 -50 0 50 100 150 200
Temperature (ºC)
Energy (J)
UNIRRADIATED
MATERIAL
IRRADIATED
MATERIAL
Fig. 3. Description of the influence of neutron irradiation on the Charpy curves (absorbed
energy vs. temperature)
Degradation Due to Neutron Embrittlement of Nuclear Vessel Steels:
A Critical Review about the Current Experimental and Analytical Techniques…
219
2.2 The ASME curves and the reference temperature RT
NDT
Since 1905, the year when George Charpy proposed his famous test, until the present, the
knowledge of the mechanics that control the fracture process has experienced an important
qualitative progress (a historic review can be found in the reference (Anderson, 1995)).
Briefly summarising, at the end of the 50’s the formulation of the so-called Linear Elastic
Fracture Mechanics
1
(LEFM) discipline was available. LEFM accurately describes the
fracture processes of brittle materials, that is, the materials that show a linear elastic
response until failure (without the occurrence of previous relevant yielding). LEFM
demonstrates that, the presence of an ideal crack in this type of materials when subjected to
loading implies a stress state tending to infinite in the proximity of the crack front. On the
other hand, it can also be demonstrated that the stress and strain fields, see Figure 4, in the
proximity of the crack front depend exclusively on one parameter known as stress intensity
factor (SIF or K
I
), which is a function of the applied load () and the defect size (a). It is
worth mentioning that the subscript ‘I’ refers to the fracture mode I (tensile mode) as
represented in Figure 4, which is the prevailing one in most cases of interest.
Y
X
r
z
xy
a
x
y
Y
X
r
z
xy
a
x
y
Fig. 4. Sketch of a cracked component / specimen and the stress state in the proximity of the
crack front
Then, as K
I
controls the stress-strain field in the fracture process zone (mode I), breaking will
occur when K
I
reaches a determined critical value, which will be dependent on the material.
This reasoning provides a valid definition of the fracture toughness as the SIF critical value,
K
Ic
, and also the following fracture criterion (1):
,
IIc
KaKmaterial
(1)
The SIF (and consequently the toughness K
Ic
) are usually expressed in MPa·m
1/2
. Toughness
K
Ic
is determined following the rules of the ASTM E 399 standard (ASTM E 399, 2009) or
some other equivalent procedure.
1
Thanks to the works of A.A. Griffith (Griffith, 1920), C.E. Inglis (Inglis, 1913), G.R. Irwin (Irwin, 1956,
1957) or H.M. Westergaard (Westergaard, 1939).
Nuclear Power – Control, Reliability and Human Factors
220
Unfortunately, LEFM is not valid for tough materials (such as reactor vessel steels), because
these develop important yielding regions in the crack front before the occurrence of the
breaking. In the 60’s, several theoretical solutions describing the fracture processes in tough
materials were proposed. The works of A.A. Wells (Wells, 1961) and J.R. Rice (Rice, 1968)
allows the validity of LEFM to be extended, thus establishing the foundations of the so-
called Elastic-Plastic Fracture Mechanics, EPFM. A new parameter, the J integral (which, like
the SIF, depends on the loading state and the defect size) characterises the stress and strain
fields in the crack front and, therefore, enables the fracture toughness to be defined
generally, as the J integral limit value, J
c
(sometimes also named J
Ic
when it refers to the
tensile fracture mode I). Also the following fracture criterion
2
can be presented (2):
,
c
JaJmaterial
(2)
The J integral (and therefore the toughness J
c
) are usually expressed either in kJ· m
-2
or in
kPa· m.
Then, since the 70’s, once the Wells and Rice postulations were recognised, a more founded
theoretical basis was made available to address material fracture, either brittle (LEFM) or
ductile (EPFM). However, in the 60’s, the period when Generation III reactors (LWR those
covered in this text among them) started operating, EPFM was not available to the power
plant design engineers. Among the different possible choices to address this problem, the
one adopted by the USA authorities (represented by the Nuclear Regulatory Commission,
NRC) is especially noteworthy. This regulation is contained in the ASME (American Society
of Mechanical Engineers) Code.
The ASME International Boiler and Pressure Vessel Code (ASME Code) establishes rules of
safety governing the design, fabrication and inspection of boilers and pressure vessels, and
nuclear power plant components during construction. This standard is currently in force for
USA designed pressure vessels. The ASME Code is made up of 11 sections and contains
over 15 divisions and subsections. The Sections II (Materials), III (Rules for Construction of
Nuclear Facility Components) and XI (Rules for In-service Inspection of Nuclear Power
Plant Components) are of relevance for the contents of this chapter.
The researchers who elaborated the ASME code were aware of the intrinsic limitations of the
LEFM; in particular, they knew that, a tough material breaks in a brittle manner (that is, in
the LEFM range), only when large specimens are used. Thus, for example, the ASTM E 399
standard (ASTM E 399, 2009) includes requirement (3) on the thickness B of a toughness
specimen in order to obtain a valid result according to the LEFM requirements.
2
2.5
Ic
Y
K
B
(3)
where σ
Y
represents the material yield stress.
This possibility, however, is not applicable as the best solution to carry out the follow-up of
the RPV steel because the space available inside the vessel is limited. Hence, it was decided
to develop a different methodology, making use of Charpy impact specimens in the
surveillance programmes (see Section 3) to subsequently correlate the results with the
2
Rigorously, this criterion describes the ductile fracture, that is, a fracture process with no stable
propagation and non negligible yielding.
Degradation Due to Neutron Embrittlement of Nuclear Vessel Steels:
A Critical Review about the Current Experimental and Analytical Techniques…
221
toughness values as defined by the LEFM principles. No doubt, this is an indirect and
tortuous path but also the only one available to the ASME society researchers at that time.
This decision, motivated by the theoretical limitations at the time it was made, is the cause
of the conservatism of the current regulation.
Therefore, from the end of the 60’s and the beginning of the 70’s, an important experimental
campaign was carried out, testing different vessel steels in the DBTR according to the LEFM
stipulations. As explained above, in order to obtain representative results for tough steels (as
those of nuclear vessels), the LEFM requires the employment of large specimens, which are
difficult to be fabricated, handled and tested. The weight of some of these specimens reached a
value of several tons. Due to the high cost of manufacturing, handling and testing these
specimens, the reference curves were named as the “one million dollars curves”. After
compiling all the available data, it was appreciated that the curves obtained for the different
steels showed, on the whole, a similar appearance; independently of the steel heat or
composition, the most remarkable difference was its location on the temperature axis, see
Figure 5. In consequence, the universal validity of the curves was established and a new
parameter was defined for any sort of vessel steel, called reference temperature RT
NDT
, which
allows its toughness-temperature curve to be located in the abscissa axis. Thus, representing in
the abscissa axis the corrected scale (T – RT
NDT
), see Figure 5, all the different curves overlap in
one single curve which is assumed to be the universal curve for the material behaviour.
In this sense, the toughness behaviour of the vessel material in the DBTR before irradiation
(unirradiated material) is described by the reference temperature RT
NDT(U)
which is obtained
from a combination of the results of Charpy (ASTM E 23, 2001) impact and Pellini drop
weight tests (ASTM E 208, 1995). Thus, this procedure implies correlating the fracture
material behaviour from dynamic tests with uncracked specimens (only notched). This is
not rigorously justified, either theoretically, or experimentally. RT
NDT
is used to index two
generic curves, developed in 1973, provided by the ASME Code relating toughness vs.
temperature: the K
Ic
curve describes the lower envelope to a large set of K
Ic
data while the
K
IR
is a lower envelope to a combined set of K
Ic
, K
Id
(dynamic test) and K
Ia
(crack arrest test)
data, being therefore more conservative than the former. Three important features can be
appreciated: first, it is assumed that the ASME curves are representative of any vessel steel;
second, in both curves, LEFM is considered; finally, the large scatter in the DBT region is
removed by taking into account lower envelopes. Consequently, the method provides high
conservatism in most cases.
Fig. 5. Description of the process to obtain the ASME curves; definition of the reference
temperature RT
NDT
.
Nuclear Power – Control, Reliability and Human Factors
222
Figure 6 represents the ASME curves along with the experimental population which
allowed their definition. The following equations (4, 5) are the mathematical expressions of
the two curves:
0.036· º º
1/2
· 36.45 22.766·
NDT
TC RT C
Ic
KMPam e
(4)
0.0261· º º
1/2
· 29.40 13.776·
NDT
TC RT C
IR
KMPam e
(5)
This procedure must be considered as a compromise solution, that is, an engineering tool
with relevant limitations and inconsistencies. As will be mentioned in Section 5 of this
Chapter, currently an alternative methodology, the Master Curve method, is available. This
approach, besides offering a higher simplicity from the methodological and experimental
point of view, also provides a complete robustness from the theoretical perspective. The
Master Curve procedure enables a realistic follow-up of the surveillance programme vessel
steel toughness evolution (see Section 3), avoiding the use of questionable correlations
which unnecessarily penalise the representativeness of the subsequent structural
calculations.
0
50
100
150
200
250
300
-250 -200 -150 -100 -50 0 50 100
T - RT
NDT
(ºC)
K
Ic
, K
ID
, K
IA
(MPa·m
1/2
)
KIc data
KID data
KIA data
K
Ic
curve
K
IR
curve
Fig. 6. ASME curves with the experimental data set used for their definition
2.3 Influence of the neutron irradiation on the reference temperature RT
NDT
Although the physical mechanisms which lead to the vessel steel embrittlement will be
extensively described in Section 4, it is considered convenient to include here some points in
order to facilitate the comprehension of Section 3. The reduction of the material toughness
due to neutron irradiation in the DBTR is currently estimated through semi-empirical
methods based on the shift experienced by the Charpy impact curves obtained from the
Degradation Due to Neutron Embrittlement of Nuclear Vessel Steels:
A Critical Review about the Current Experimental and Analytical Techniques…
223
surveillance capsule specimens (see Section 3). As stated in 10CFR50 (10CFR50, 1986), the
effect of neutron fluence on the behaviour of the material is predicted by the Regulatory
Guide 1.99 Rev. 2 (RG 1.99 (2), 1988) which provides equation (6) for the calculation of the
evolution of RT
NDT
:
NDT NDT
NDT U
RT RT RT M
(6)
where ΔRT
NDT
represents the shift in the reference temperature due to irradiation which is
assumed to be equal to the shift of the Charpy transition curve indexed at 41J; thus,
ΔRT
NDT
= ΔT
41J
. The third term, M, is the margin that is to be added to obtain a
conservative estimation. The procedure in (RG1.99 (2), 1988) allows ΔRT
NDT
to be obtained
even when no credible surveillance data are available by means of an equation based on
the chemistry of the steel and the neutron fluence received (this issue is extensively
described in Section 4).
3. Surveillance programmes of nuclear power plants
For decades, the nuclear industry has known of the above described problems and, in
consequence, has acquired the appropriate tools to be able to evaluate in advance the
degradation of the vessel steel properties. Surveillance programmes are the tools currently
employed to perform the follow-up of the evolution of the RPV steel properties throughout
the operating lifetime of the reactor. These programmes consist of placing inside the reactor,
from the beginning of plant operation, surveillance capsules containing specimens; these are
made of a steel (base material, weld metal or heat affected zone material – see comments
below regarding to this point) identical to the one which constitutes the vessel – along with
flux wires necessary to estimate the neutron fluence and temperature gauges.
Surveillance capsules must be located within the reactor vessel, in the beltline, so that the
specimen irradiation history duplicates as closely as possible, within the physical constraints
of the system, the neutron spectrum, temperature history and maximum neutron fluence
experienced by the reactor vessel. The fabrication history (austenitizing, quenching and
tempering, and post-weld heat treatment) of the test materials will be fully representative of
the fabrication history of the materials in the beltline of the reactor vessel. Because the
capsules are located closer to the core than the inner vessel wall, the specimens suffer
accelerated neutron fluence doses and, therefore, provide advanced information about the
evolution of the embrittlement process. This phenomenon is described through the
surveillance capsule lead factor (i.e., the ratio of the neutron fluence rate at the specimens in
a surveillance capsule to the neutron fluence rate at the inner vessel wall, E > 1 MeV). It is
recommended that the surveillance capsule lead factor be greater than one and less than or
equal to three. This range of lead factors has been selected to minimise the calculation
uncertainties in extrapolating the surveillance measurements from the specimens to the
reactor vessel wall.
Periodically, taking advantage of the plant refuelling outages, specimen removal is carried out
(along with flux wires and temperature gauges) from inside the capsules. These specimens are
subsequently tested, thus providing realistic information about the evolution of the material
properties throughout the plant operating period. This is a method for assessing the material
degradation caused by neutron irradiation. The issues related to the surveillance programme
design along with the rules for the interpretation of the results of such programmes are