Solar Cells New Aspects and Solutions Part 7 ppt
Bạn đang xem bản rút gọn của tài liệu. Xem và tải ngay bản đầy đủ của tài liệu tại đây (1.07 MB, 35 trang )
Bioelectrochemical Fixation of Carbon Dioxide with Electric Energy Generated by Solar Cell
201
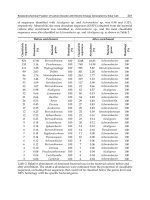
of sequences identified with Alcaligenes sp. and Achromobcter sp. was 0.98 and 0.12%,
respectively. Meanwhile, the most abundant sequences (43.83%) obtained from the bacterial
culture after enrichment was identified as Achromobacter sp., and the most classifiable
sequences were also identified as Achromobacter sp. and Alcaligenes sp. as shown in Table 2.
Before enrichment After enrichment
Classifiable
sequences
Abundance
(%)
Bacterial
genus
Homology
(%)
Classifiable
sequences
Abundance
(%)
Bacterial
genus
Homology
(%)
876 17.96
Brevundimonas
100 2248 43.83
Achromobacte
r
100
153 3.14
Pseudomonas
100 748 14.58
Achromobacte
r
100
111 2.28
Hydrogenophaga
100 595 5.87
Stenotrophomonas
100
99 2.03
Delftia
100 301 2.28
Achromobacte
r
100
86 1.76
Stenotrophomonas
100 263 1.77
Achromobacte
r
100
70 1.44
Pseudomonas
100 219 1.23
Achromobacte
r
100
53 1.09
Parvibaculum
100 117 0.90
Achromobacte
r
100
52 1.07
Brevundimonas
100 91 0.66
Achromobacte
r
100
48 0.98
Alcaligenes
100 63 0.57
Alcaligenes
100
32 0.66
Comamonas
100 46 0.53
Achromobacte
r
100
31 0.64
Bacillus
100 34 0.49
Achromobacte
r
100
26 0.53
Bosea
100 29 0.49
Castellaniella
100
21 0.43
Devosia
100 27 0.45
Achromobacte
r
100
17 0.35
Acidovorax
100 25 0.45
Achromobacte
r
100
12 0.25
Brevundimonas
100 25 0.39
Stenotrophomonas
100
12 0.25
Sphaerobacte
r
100 23 0.16
Achromobacte
r
100
11 0.23
Brevundimonas
100 23 0.14
Alcaligenes
100
9 0.18
Acinetobacte
r
100 20 0.12
Achromobacte
r
100
9 0.18
Sphaerobacte
r
100 14 0.10
Alcaligenes
100
8 0.16
Brevundimonas
100 14 0.10
Pseudomonas
100
7 0.14
Hyphomicrobium
100 11 0.08
Achromobacte
r
100
7 0.14
Thermomonas
100 10 0.08
Achromobacte
r
100
6 0.12
Achromobacte
r
100 8 0.06
Achromobacte
r
100
6 0.12
Brevundimonas
100 7 0.06
Achromobacte
r
100
4 0.10
Devosia
100 7 0.06
Achromobacte
r
100
3 0.08
Pseudoxanthomonas
100 6 0.04
Alcaligenes
100
3 0.06
Castellaniella
100 6 0.04
Achromobacte
r
100
3 0.06
Gordonia
100 6 0.04
Achromobacte
r
100
Table 2. Relative abundances of dominant bacterial taxa in the bacterial culture before and
after enrichment. The relative abundances were estimated from the proportion of classifiable
sequences, excluding those sequences that could not be classified below the genus level and
100% homology with the specific bacterial genus.
Solar Cells – New Aspects and Solutions
202
The Achromobacter sp. described in previous research was a facultative chemoautotroph
(Hamilton et al., 1965; Romanov et al., 1977); however, it grew autotrophically with
electrochemical reducing power under a CO
2
atmosphere and consumed CO
2
in this study.
This result demonstrates that Achromobacter sp. grown in the electrochemical bioreactor may
be a chemoautotroph capable of fixing CO
2
with the electrochemical reducing power.
Meanwhile, various articles have reported that Alcaligenes sp. grew autotrophically (Frete
and Bowien, 1994; Doyle and Arp. 1987; Leadbeater and Bowien, 1984) or heterotrophically
(Reutz et al., 1982). According to these articles, Alcaligenes spp. are capable of growing
autotrophically with a gas mixture of H
2
, CO
2
, and O
2
, as well as heterotrophically under air
on a broad variety of organic substrates. Alcaligenes spp. metabolically oxidize H
2
to
regenerate the reducing power during autotrophic growth under H
2
-CO
2
atmosphere
(Hogrefe et al., 1984). The essential requirement for the autotrophic growth of both
Achromobacter spp. and Alcaligenes spp. under CO
2
atmosphere is to regenerate reducing
power in conjunction with metabolic H
2
oxidation, which may be replaced by the
electrochemical reducing power on the basis of the results obtained in this research. The
electrochemical reducing power required for the cultivation of carbon-dioxide fixing
bacteria can be produced completely by the solar panel, by which atmospheric carbon
dioxide may be fixed by same system to the photosynthesis.
6. Strategy of atmospheric carbon dioxide fixation using the solar energy
In global ecosystem, land plants, aquatic plants, and photoautotrophic microorganisms
produce biomass that is original source of organic compounds (O’Leary, 1988). Autotrophs
that are growing naturally or cultivating artificially have fixed the atmospheric carbon dioxide
generated by heterotrophs, by which the atmospheric carbon dioxide may be balanced
ecologically. However, the carbon dioxide generated from the combustion of organic
compounds (petroleum and coal) that are not originated from biomass may be accumulated
additionally in the atmosphere, inland water, and sea water. The solar radiation that reaches to
the earth may not be limited for photosynthesis of phototrophs or electric generation of solar
cells; however, the general habitats for growth of the phototrophs have been decreased by
various human activities and the places for installation of the solar cells are limited to the
habitats for human. If the solar cells were installed in the natural habitats, phototrophic
fixation of carbon dioxide may be decreased in proportion to the electricity generation by the
solar cells. The constructions of new cities, farmlands, golf courses, ski resorts, and sport
grounds cause to convert the forests to grass field whose ability for carbon dioxide fixation is
greatly lower than the forest. Consequently, the plantation of trees and grasses in the habitable
lands or cultivation of algae and cyanobacteria in the habitable waters can’t be the way to
decrease additionally the atmospheric carbon dioxide.
Carbon dioxide has been fixed biologically by photoautotrophic, chemoautotrophic and
mixotrophic organisms. The photoautotrophic bacteria assimilate carbon dioxide into
organic compounds for cell structures with reducing power regenerated by the solar
radiation under atmospheric condition (Kresge et al., 2005). The chemoautotrophs
assimilate carbon dioxide into cell structure in coupling with production of methane or
acetic acid with reducing power regenerated by hydrogenase under strict anaerobic
hydrogen atmosphere (Perreault et al., 2007). The mixotrophs assimilate carbon dioxide
into biomolecules with reducing power regenerated in coupling with metabolic oxidation
of organic or inorganic compounds (Eiler, 2006). The photoautotrophs, chemoautotrophs,
and mixotrophs can reduce metabolically carbon dioxide to organic carbon with the
common reducing power (NADH or NADPH), which, however, are regenerated by
Bioelectrochemical Fixation of Carbon Dioxide with Electric Energy Generated by Solar Cell
203
different metabolisms. The photoautotrophs, especially cyanobacteria that fix carbon
dioxide by completely same metabolism (Calvin cycle) with plants, appear as if they are
ideal organism to fix biologically carbon dioxide without chemical energy; however, they
are unfavorable to be cultivated in the tank-type bioreactor owing to the limitation of
reachable distance of solar radiation in aquatic condition. The chemoautotrophs may be
useful to produce methane and acetic acid from carbon dioxide; however, they can grow
only in the limit condition of the lower redox potential than -300 mV (vs. NHE) and with
hydrogen. The mixotrophs can grow in the condition with electron donors, which are
regardless of organic or inorganic compounds, for regeneration of reducing power under
aerobic and anaerobic condition. This is the reason why the facultative anaerobic
mixotrophs may be more effective than others to fix the atmospheric carbon dioxide
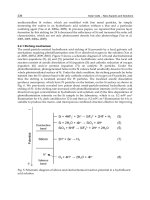
directly by simple process. Especially, the cylinder-type electrochemical bioreactor
equipped with the built-in anode compartment (Fig 9) is an optimal system for the
cultivation or enrichment of facultative anaerobic mixotrophs. Basements of buildings or
villages are used generally for maintenances or facilities for wastewater collection,
electricity distribution, tap water distribution, and garage. The basements can’t be the
habitats for cultivation of plants with the natural sun light but can be utilized for
cultivation of the carbon dioxide-fixing bacteria with electric energy generated from the
solar cells that can be installed on the rooftop as shown in Fig 12.
Fig. 12. Schematic structure of the electrochemical bioreactors installed in the building
basement. The carbon dioxide-fixing bacteria can be cultivated using the electric energy
generated by the solar cells.
Solar Cells – New Aspects and Solutions
204
The facultative anaerobic mixotrophs assimilate heterotrophically organic compounds
contained in the wastewater into the structural compounds of bacterial cells under oxidation
condition but autotrophically carbon dioxide into the biomass under condition with high
balance of biochemical reducing power (NADH/NAD
+
). DC electricity generated from the
solar cells can be transferred very conveniently to the cylinder-type electrochemical
bioreactor without conversion, which is the energy source for increase of biochemical
reducing power balance. A part of the atmospheric carbon dioxide has been generated from
the combustion system of fossil fuel, which may be required to be return to the empty
petroleum well. To store the bacterial cells in the empty petroleum well is to return the
carbon dioxide generated from petroleum combustion to the original place. The
peptidoglycans, phospholipids, proteins, and nucleic acids that are major ingredients of
bacterial cell structures are stable chemically to be stored in the empty petroleum well
owing to the non-oxygenic condition. Conclusively, what the atmospheric carbon dioxide
originated from the petroleum and coal is returned to the original place again may be best
way to decrease the greenhouse effect.
7. Conclusion
The atmospheric carbon dioxide originated from petroleum and coal is required to be
completely isolated from the ecological material cycles. The carbons in the ecological system
are accumulated as the organic compounds in the organisms and as the carbon dioxide in
the atmosphere, which is cycled via the photosynthesis and respiration, especially, plants
are the biggest pool for carbon storage. However, the forest and plant-habitable area has
been decreased continuously by human activities.
The cultivation of cyanobacteria and single cell algae with solar energy may be the best
way to isolated effectively carbon dioxide from atmosphere but is possible in the water
pool-type reactor located in the plant-habitable area. In other words, the forests or grass
lands may be replaced by the water pools, by which the effect of carbon dioxide fixation
has to be decreased. The cyanobacteria and algae can be cultivated in the bioreactor using
lamp light operated with electric energy that is generated from solar cells, for which the
solar energy has to be converted to electric energy and then converted again to the light
energy. These phototrophic microorganisms have been studied actively and applied to
produce nutrient sources and pharmacy. The goal for cultivation of the phototrophic
microorganisms is to produce the utilizable materials but not to fix carbon dioxide like the
agricultural purpose.
The carbon compounds of the organic nutritional compounds contained in the sewage
wastewater are the potential carbon dioxide, which may be the useful medium for
cultivation of the mixotrophic bacteria capable of fixing carbon dioxide. The maximal
balance of anabolism to catabolism is theoretically 0.4 to 0.6 in the mixotrophic bacteria
growing with organic carbons as the energy source, in which the carbon dioxide can’t be
the source for both anabolism and catabolism; however, the balance can be changed by
the external energy like the electrochemical reducing power. In the condition with both
the organic carbons and the electrochemical reducing power as the energy source, the
balance of anabolism to catabolism may be increased to be higher than 0.4 due to the
carbon dioxide assimilation that is generated in coupling with the redox reaction of
Bioelectrochemical Fixation of Carbon Dioxide with Electric Energy Generated by Solar Cell
205
biochemical reducing power electrochemically regenerated. The electrochemical reducing
power can induce regeneration of NADH and ATP, by which both the assimilation of
organic carbon and carbon dioxide into bacterial structure compounds can be activated.
The goal of cultivation of bacterial cells using the cylinder-type electrochemical is to
assimilate the atmospheric carbon dioxide to the organic compounds for bacterial
structure without the combustion of fossil fuel and without production of metabolites.
Some metabolites that are methane and acetic acid can be generated by the strict
anaerobic bacteria under anaerobic hydrogen-carbon dioxide atmosphere but not useful
for industrial utility owing to the cost for production. Meanwhile, the methane and acetic
acid produced from the organic compounds in the process for treatment of wastewater or
waste materials may be useful as the by-product for the industrial utility. The cell size and
structural character of bacteria permits to put directly the bacterial cells in the empty
petroleum well without any process, by which the atmospheric carbon dioxides are
returned to the original place.
8. Acknowledgement
Writing of this chapter was supported by the New & Renewable Energy of the Korea
Institute of Energy Technology Evaluation and Planning (KETEP) grant funded by the
Korea government Ministry of Knowledge Economy (2010T1001100334)
9. References
Caldwell, D.R. 1995. Microbial physiology and metabolism. Pp. 5-23. Wm. C. Brown
Publishers. Oxford. England.
Canadell, J.G., C.R. Quéré, M.R. Raupach, C.B. Field, E.T. Buitenhuis, P. Cialis, T.J.
Conway, N.P. Gillett, R.A. Houghton, and G. Marland. 2007. Contributions to
accelerating atmospheric CO
2
growth from economic activity, carbon intensity,
and efficiency of natural sinks. PNAS 104: 18866-18870.
Cheng, K.Y., G. Ho, and R. Cord-Ruwisch. 2011. Novel methanogenic rotatable
bioelectrochemical system operated with polarity inversion. Environ. Sci.
Technol. 45: 796-802.
Cox, P.M., R.A. Betts, C.D. Jones, S.A. Spall, and I.J. Totterdell. 2000. Acceleration of
global warming due to carbon-cycle feedbacks in a coupled climate model.
Nature 4008: 184-187.
Cramer, W., A. Bondeau, S. Schaphoff, W. Lucht, B. Smith, and S. Sitch. 2004. Tropical
forests and the global carbon cycle: impacts of atmospheric carbon dioxide,
climate change and rate of deforestation. Phil. Trans. R. Soc. Lond. B 359: 331-
343.
Dhillon, A., M. Lever, K.G. Lloyd, D.B. Albert, M.L. Sogin, and A. Teske. 2005.
Methanogen diversity evidenced by molecular characterization of methyl
coenzyme M reductase A (mcrA) genes in hydrothermal sediments of the
Suaymas Basin. Appl. Environ. Microbiol. 71: 4592-4601.
Solar Cells – New Aspects and Solutions
206
Eiler, A. 2006. Evidence for the ubiquity of mixotrophic bacteria in the upper
ocean: implications and consequences. Appl. Environ. Microbiol. 72: 7431-
7437.
Ferguson, T.J., and R.A. Mah. 1983. Isolation and characterization of an H
2
-oxidizing
thermophilic methanogen. Appl. Environ. Microbiol. 45: 265-274.
Ferry, J.G. 1993. Methanogenesis: Ecology, Physiology, Biochemistry and Genetics.
Chapman & Hall, New York.
Freter, A., and B. Bowien. 1994. Identification of a novel gene, aut. involved in autotrophic
growth of Alcaligenes eutrophus. J. Bacteriol. 176: 5401-5408.
Friedrich, C., 1982. Derepression of hydrogenase during limitation of electron donor and
derepression of ribulosebiophosphate carboxylase during carbon limitation of
Alcaligenes eutrophus. J. Bacteriol. 149:203-210.
Gerlach, T.M., K.A. McGee, T. Elias, A.J. Sutton, and M.P. Doukas. 2002. Carbon dioxide
emission rate of Kilauea volcano: Implications for primary magma and the
summit reservoir. J. Geophys. Res. 107:2189-2203.
Gottschalk, G. 1985. Bacterial metabolism, Second Edition, Pp. 252-260. Springer-Verlag,
New York.
Grulke, N.E., G.H. Riechers, W.C. Oechel, U. Hjelm, and C. Jaeger. 1990. Carbon balance
in tussock tundra under ambient and elevated atmosphere. Oecologia 83: 485-
494.
Hamilton, R.R., R.H. Burris, P.W. Wilson, and C.H. Wang. 1965. Pyruvate metabolism,
carbon dioxide assimilation, and nitrogen fixation by an Achromobacter species. J.
Bacteriol. 89:647-653.
Hansen, K. 2008. Water vapor confirmed as major in climate change. News topics from
NASA.
Held, I.M., and B.J. Soden. 2000. Water vapor feedback and global warming. Annu. Rev.
Energ. Environ. 25: 441-475.
Hogrefe, C., D. Römermann, and B. Friedrich. 1984. Alcaligenes eutrophus hydrogenase
gene (Hox). J. Bacteriol. 158, 43-48.
Jeon, B.Y., and D.H. Park. 2010. Improvement of ethanol production by electrochemical
redox combination of Zymomonas mobilis and Saccharomyces cerevisiae. J. Microbiol.
Biotechnol. 20: 94-100.
Jeon, B.Y., S.Y. Kim, Y.K. Park, and D.H. Park. 2009A. Enrichment of hydrogenotrophic
methanogens in coupling with methane production using electrochemical
bioreactor. J. Microbiol. Biotechnol. 19: 1665-1671.
Jeon, B.Y., T.S. Hwang, and D.H. Park. 2009B. Electrochemical and biochemical analysis of
ethanol fermentation of Zymomonas mobilis KCCM11336. J. Microbiol. Biotechnol.
19: 666-674.
Johnson, D.B. 1998. Biodiversity and ecology of acidophilic microorganisms. FEMS
Microbiology Ecology 27: 307-317.
Kang, B., and Y.M. Kim. 1999. Cloning and molecular characterization of the genes for
carbon monoxide dehydrogenase and localization of molybdopterin, flavin
Bioelectrochemical Fixation of Carbon Dioxide with Electric Energy Generated by Solar Cell
207
adenine dinucleotide, and iron-sulfur centers in the enzyme of Hydrogenophaga
pseudoflava. J. Bacteriol. 181: 5581-5590.
Kang, H.S., B.K. Na, and D.H. Park. 2007. Oxidation of butane to butanol coupled
to electrochemical redox reaction of NAD
+
/NADH. Biotech. Lett. 29: 1277-
1280.
Katsuyama, C., S. Nakaoka, Y. Takeuchi, K. Tago, M. Hayatsu, and K. Kato. 2009.
Complementary cooperation between two syntrophic bacteria in pesticide
degradation. J. Theoretical Biol. 256: 644-654.
Keeling, C.D., T.P. Whorf, M. Wahlen, and J. Vanderplicht. 1995. Interannual extremes
in the rate of rise of atmospheric carbon-dioxide since 1980, Nature. 375: 666-
670.
Kiehl, J., T. Kevin, and E. Trenberth. 1997. Earth’s annual global mean energy budget.
Bulletin of the American Meteological Society 78: 197-208.
Lamed, R.J., J.H. Lobos, and T.M. Su. 1988. Effects of stirring and hydrogen on
fermentation products of Clostridium thermocellum. Appl. Environ. Microbiol. 54:
1216-1221.
Lashof, D.A., and D.R. Ahuja. 1990. Relative contributions of greenhouse gas emission to
global warming. Nature 344: 529-531.
Leadbeater, L., and B. Bowien. 1984. Control autotrophic carbon assimilation Alcaligenes
eutrophus by inactivation and reaction of phosphoribulokinase. J. Bacteriol. 57: 95-
99.
Lee, W.J., and D.H. Park. 2009. Electrochemical activation of nitrate reduction to nitrogen
by Ochrobactrum sp. G3-1 using a noncompartmetned electrochemical bioreactor.
J. Microbiol. Biotechnol. 19: 836-844.
McKane, R.B., E.B. Rastetter, J.M. Melillo, G.R. Shaver, C.S. Hopkinson, D.N. Femandes,
D.L. Skole, and W.H. Chomentowski. 1995. Effects of global change on
carbon storage in tropical forests of south America. Global Biochemical Cycle 9:
329-350.
Morikawa, M., and T. Imakawa. 1993. Isolation of a new mixotrophic bacterium which can
fix aliphatic and aromatic hydrocarbons anaerobically. J. Ferment. Bioengin. 4:
280-283.
Na, B.K., T.K. Hwang, S.H. Lee, D.H. Ju, B.I. Sang, and D.H. Park. 2007. Development of
bioreactor for enrichment of chemolithotrophic methanogen and methane
production. Kor. J. Microbiol. Biotechnol 35: 52-57.
O’Leary, M.H. 1988. Carbon isotopes in photosynthesis. BioScienece 38: 328-336.
Kresge, N., R.D. Simoni, and R.L. Hill. 2005. The discovery of heterotrophic carbon
dioxide fixation by Harland G Wood. J. Biol. Chem. 139:365-376.
Ohmura, N., K. Sasaki, N. Matsumoto, and H. Saiki. 2002. Anaerobic respiration using
Fe
3+
, S
o
, and H
2
in the chemoautotrophic bacterium Acidithiobacillus ferroxidans. J.
Bacteriol. 184: 2081-2087.
O’Regan, B., and M. Grätzel. 1991. A low-cost, high-efficiency solar cell based on dye-
sensitized colloidal TiO
2
films. Nature 353: 737-740.
Solar Cells – New Aspects and Solutions
208
Oremland, R.S., R.P. Kiene, I. Mathrani, M.J. Whitica, and D.R. Boone. 1989. Description of
an estuarine methylotrophic methanogen which grows on dimethyl sulfide.
Appl. Environ. Microbiol. 55: 994-1002.
Park, D.H., and Z.G. Zeikus. 1999. Utilization of electrically reduced neutral red
by Actinobacillus succinogenes: physiological function of neutral red in membrane-
driven fumarate reduction and energy conservation. J. Bacteriol. 181: 2403-
2401.
Park, D.H., and J.G. Zeikus. 2000. Electricity generation in microbial fuel cells using
neutral red as an electronophore. Appl. Environ. Microbiol. 66:1292-1297.
Park, D.H., and J.G. Zeikus. 2003. Improved fuel cell and electrode designs for producing
electricity from microbial degradation. Biotechnol. Bioengin. 81: 348-355.
Park, D.H., B.H. Kim, B. Moore, H.A.O. Hill, M.K. Song, and H.W. Rhee. 1997. Electrode
reaction of Desulforvibrio desulfuricans modified with organic conductive
compounds. Biotech. Technique. 11: 145-148.
Park, D.H., M. Laiveniek, M.V. Guettler, M.K. Jain, and J.G. Zeikus. 1999. Microbial
utilization of electrically reduced neutral red as the sole electron donor for
growth of metabolite production. Appl. Environ. Microbiol. 2912-2917.
Perreault, N.N., C.W. Greer, D.T. Andersen, S. Tille, G. Lacrampe-Couloume, B.
Sherwood, and L.G. Whyte. 2008. Heterotrophic and autotrophic microbial
populations in cold perennial springs of the high arctic. Appl. Environ.
Microbiol. 74: 6898-6907.
Petty, G.W. 2004. A first course in atmospheric radiation, pp. 29-251, Sundog Publishing.
Pollack, J.D., J. Banzon, K. Donelson, J.G. Tully, J.W. Davis, K.J. Hackett, C. Agbayyim,
and R.J. Miles. 1996. Reduction of benzyl viologen distinguishes genera of the
class Mollicutes. Int. J. System. Bacteriol. 46: 881-884.
Reutz, I., P. Schobert, and B. Bowien. 1982. Effect of phosphoglycerate mutase deficiency
on heterotrophic and autotrophic carbon metabolism of Alcaligenes eutrophus. J.
Bacteriol. 151: 8-14.
Raich, J.W., and W.H. Schlesinger. 2002. The global carbon dioxide flux in soil respiration
and its relationship to vegetation and climate. Tellus 44:81-99.
Robertson, G.P., and J.M. Tiejei. 1988. Deforestation alters denitrification in a lowland
tropical rain forest. Nature 136: 756-759.
Romanova, A.K., A.V. Nozhevnikova, J.G. Leonthev, and S.A. Alekseeva. 1977. Pathways
of assimilation of carbon oxides in Seliberia carboxydohydrogena and Achromobacter
carboxydus. Microbiology 46, 719-722.
Schmidt, G.A., R. Ruedy, R.L. Miller, and A.A. Lacis. 2010. Attribution of the present-
day total greenhouse effect. J. Geophys. Res. 115, D20106, doi:10.1029/
2010JD014287.
Shine, K.P., M. Piers, and de F. Forster. 1999. The effect of human activity on radiative
forcing of climate change: a review of recent developments. Global and Planetary
Change 20:205-225.
Bioelectrochemical Fixation of Carbon Dioxide with Electric Energy Generated by Solar Cell
209
Skirnisdottir, S., G.O. Hreggvidsson, O. Holst, and J.K. Kristjansson. 2001. Isolation and
characterization of a mixotrophic sulfur-oxidizing Thermus scotoductus.
Extremophiles. 5: 45-51.
Skole, D.L., W.A. Salas, and C. Silapathong. 1998. Interannual variation in the terrestrial
carbon cycle: significance of Asian tropic forest conversion to imbalanced in
the global carbon budget. Pp. 162-186 in J.N Galoway and J.M. Melillo, eds.
Asian change in the context of global change. Cambridge: Cambridge University
Press.
Stams, A.J.M., and C.M. Plugge. 2009. Electron transfer in syntrophic communities of
anaerobic bacteria and archaea. Nature Rev. Microbiol. 7: 568-577.
Stork, N.E. 1977. Measuring global biodiversity and its decline. Pp. 46-68 in M.L. Reaka-
Kudia at al., eds. Biodiversity LL: Understanding and protecting our natural
resources. Washington, DC: Joseph Henry Press.
Tans, P. 2011. “Trends in atmospheric carbon dioxide”. National Oceanic & Atmospheric
Administration, Earth system Research Laboratory of Global Monitoring
Division. Retrieved 2011-01-19.
Thauer, R.K., K. Jungermann, and K. Decker. 1977. Energy conservation in chemotrophic
anaerobic bacteria. Bacteriol. Rev. 41: 100-180.
Tran, H.T., D.H. Kim, S.J. Oh, K. Rasool, D.H. Park, R.H. Zhang, and D.H. Ahn.
2009. Nitrifying biocathode enable effective electricity generation and sustainable
wastewater treatment with microbial fuel cell. Water Sci. Technol. 59: 1803-
1808.
Van der Bogert, B., W.M. de Vos, E.G. Zoetendal, and M. Kleerevezem. 2011. Microarray
analysis and barcoded pyrosequencing provide consistent microbial profiles.
Appl. Environ. Microbiol. 77: 2071-2080.
Van Veen, J.A., E. Liljeroth, and J.J.A. Lekkerkerk. 1991. Carbon fluxes in plant-soil
systems at elevated atmospheric CO2 levels. Ecol. Appl. 1: 175-181.
Wang, S., and D. Du. 2002. Studies on the electrochemical behavior of hydroquinone at
L-cysteine self-assembled monolayers modified gold electrode. Sensors 2: 41-
49.
Willems, A., J. Busse, M. Goor, B. Pot, E. Falsen, E. Jantzen, B. Hoste, M. Gillis, K. Kersters,
G. Auling, and J. Delay. 1989. Hydrogenophaga, a new genus of hydrogen-
oxidizing bacteria that includes Hydrogenophaga flava comb. nov. (formerly
Pseudomonas flava). Hydrogenophaga palleronii (formerly Pseudomonas palleroni),
Hydrogenophaga pseudoflava (formerly Pseudomonas pseudoflava and “Pseudomonas
carboxydoflava”), and Hydrogenophaga taeniospiralis (formerly Pseudomonas
taeniospiralis). Int. J. Syst. Bacteriol. 39: 319-333.
Williams, S.N., S.J. Schaefer, V.M. Lucia, and D. Lopez. 1992. Global carbon dioxide
emission to the atmosphere by volcanoes. Geochim. Cosmochim. Acta. 56: 1765-
1770.
Worrell, E., L. Price, N. Martin, C. Hendriks, and L.O. Meida. 2001. Carbon dioxide
emissions from the global cement industry. Ann. Rev. Energy Environ. 26: 303-
329.
Solar Cells – New Aspects and Solutions
210
Zeikus, J.G., and R.S. Wolfe. 1972. Methanobacterium thermoautotrophicum sp. nov.:
An anaerobic autotrophic, extreme thermophile. J. Bacteriol. 109: 707-713.
Zinder, S.H., S.C. Cardwell, T. Anguish, M. Lee, and M. Koch. 1984. Methanogenesis in a
thermophilic (58
o
C) anaerobic digester: Methanothrix sp. as an important
aceticlastic methanogen. Appl. Environ. Microbiol. 47: 796-807.
0
Semiconductor Superlattice-Based
Intermediate-Band Solar Cells
Michal Mruczkiewicz, Jarosław W. Kłos and Maciej Krawczyk
Faculty of Physics, Adam Mickiewicz University, Pozna´n
Poland
1. Introduction
The efficiency of conversion of the energy of photons into electric power is an important
parameter of solar cells. Together with production costs, it will determine the demand for
the photovoltaic device and its potential use (Messenger & Ventre, 2004). The design of
artificial nanostructures with suitably adjusted properties allows to increase the performance
of solar cells. The proposed concepts include, among others, third-generation devices such
as tandem cells, hot carrier cells, impurity photovoltaic and intermediate-band cells (Green,
2003). In this chapter we discuss the theoretical model of intermediate-band solar cell
(IBSC), the numerical methods of determining the band structure of heterostructures, and
the latest reported experimental activities. We calculate the efficiency of IBSCs based on
semiconductor superlattices. The detailed balance efficiency is studied versus structural and
material parameters. By adjusting these parameters we tailor the band structure to optimize
the efficiency.
The background of the concept of IBSC lies in the impurity solar cell concept proposed by
(Wolf, 1960) and presented in Fig. 1. The idea was to increase the efficiency by the introduction
of intermediate states within a forbidden gap of the semiconductor. This allows the absorption
of low-energy photons and causes them to contribute to the generated photocurrent via
two-photon absorption. However, as shown experimentally by (Guettler & Queisser, 1970),
the introduction of intermediate levels via impurities will create non-radiative recombination
centers and cause a degradation of the solar cell efficiency. This effect was studied theoretically
by (Würfel, 1993) and (Keevers & Green, 1994), with the conclusion that the introduced
impurity levels can increase the efficiency in some cases, but only marginally. However the
research in this field is still active and recently the optical transition between CB and IB band
in the GaN
x
As
1−x
alloys was proved experimentally (López et al., 2011; Luque, 2011).
Another, more sophisticated approach to the concept of impurity solar cell was proposed by
(Barnham & Duggan, 1990). A further discussion in (Araujo & Martí, 1995), (Luque & Martí,
2001), (Martí et al., 2006) led to the conclusion that the problems related to the impurity states
in the solar cell concept might be overcome if the impurities interacted strongly enough
to form an impurity band (IB). In such conditions the electron wave functions in the IB
are delocalized, causing the radiative recombinations to predominate over the non-radiative
ones. The efficiency of the system was described by (Luque & Martí, 1997) on the basis of
the extended Shockly-Queisser model (Shockley & Queisser, 1961), the most commonly used
10
2 Will-be-set-by-IN-TECH
and described in detail in the next section. Many extended versions of the model have been
developed, such as that proposed by (Navruz & Saritas, 2008) in a study of the effect of the
absorption coefficient, or the model of (Lin et al., 2009), considering the carrier mobility and
recombinations.
Fig. 1. Model of single-gap solar cell with impurity states introduced. Two possible ways of
electron-hole creation are shown: via one-photon absorption in a transition from the valence
band to the conduction band (VB
→CB), and via two-photon absorption, in which the
electron is excited from the valence band to the impurity state (VB
→IB) by one photon, and
from the impurity state to the conduction band (IB
→CB) by another photon.
2. Theoretical model
2.1 Single gap solar cell
Unlike the thermodynamic limits (Landsberg & Tonge, 1980), the limit efficiency considered
in the Shockley-Queisser detailed balance model of single-gap solar cell (SGSC)
(Shockley & Queisser, 1961) incorporates information on the band structure of the
semiconductor and the basic physics. The model includes a number of fundamental
assumptions, which allow to evaluate, question and discuss its correctness. All incident
photons of energy greater than the energy gap (E
G
) of the semiconductor are assumed
to participate in the generation of electron-hole pairs. Other assumptions include that no
reflection occurs on the surface of the solar cell, the probability of absorption of a photon
with energy exceeding the energy gap and creation of electron-hole pair equals one, and so
does the probability of collection of the created electron-hole pairs. In the detailed balance
model only radiative recombinations between electrons and holes are allowed, by Planck’s
law proportional to the temperature of the cell. According to this model, all the carriers relax
immediately to the band edges in thermal relaxation processes.
The current-voltage equation of the cell under illumination can be written in the following
form:
J
(V)=J
SC
− J
Dark
(V),(1)
where J
SC
is the short circuit current, extracted from the cell when its terminals are closed
and the load resistance is zero; the short circuit current is independent of the voltage, but
depends on the illumination; the dark current J
Dark
is the current that flows through the p-n
212
Solar Cells – New Aspects and Solutions
Semiconductor Super lattice-Based Intermediate-Band Solar Cells 3
junction under applied voltage, in the case of a solar cell, produced at the terminals of the
device under the load resistance R. The detailed balance efficiency is defined as the ratio of
the output power P
out
extracted from the cell to the input power P
in
of the incident radiation:
η
=
P
out
P
in
=
J
m
V
m
P
in
,(2)
where V
m
and J
m
is the voltage and current, respectively, that corresponds to the optimal value
of the output power.
Both P
in
and J(V) can be defined in terms of fluxes of absorbed and emitted photons. Let β
s
be the incident photon flux, or the number of incident photons per second per square meter
received from the sun and the ambient. By Planck’s law, describing the blackbody radiation:
β
s
(E)=
2F
s
h
3
c
2
E
2
e
E/k
b
T
a
−1
,(3)
where h is the Planck constant, c is the velocity of light, k
b
is a Boltzman constant and T
a
is
a temperature of the ambient. F
s
is a geometrical factor determined by the half of the angle
subtended by the sunlight:
F
s
= π sin
2
Θ
sun
2
.(4)
In all the examples discussed in this chapter the maximum concentration of sunlight,
corresponding to Θ
sun
= 180
◦
, is assumed. For that reason there is no need to describe the
incident photon flux cming from the ambient and the photon flux described by the equation
(3) is the total incident photon flux. The radiation of the sun is coming from all directions. If a
flat solar panel receives radiation over a hemisphere, the geometrical factor becomes π,which
is equivalent to the cell illuminated with Θ
sun
= 180
◦
.
The input power will be the total energy of all the incident photons:
P
in
=
∞
0
Eβ
s
(E) dE.(5)
The short circuit current can be expressed as the elementary charge multiplied by the number
of absorbed photons, with the absorption coefficient a
(E):
J
SC
= q
a(E )β
s
(E) dE = q
∞
E
G
β
s
(E) dE,(6)
where the absorption coefficient a
(E) (zero for energies lower than the bandgap, one
otherwise) determines the lower boundary of the integral.
The dark current is related to the number of photons emitted by the p-n junction:
J
Dark
(V)=q
e(E)β
e
(E, V)) dE,(7)
where e
(E) is an emission coefficient which describe the probability of the photon emission.
The generalized form of Planck’s law of blackbody radiation (Landau & Lifshitz, 1980)
describes the dependence of the flux β
e
of photons emitted by the device on the chemical
213
Semiconductor Superlattice-Based Intermediate-Band Solar Cells
4 Will-be-set-by-IN-TECH
0 0.2 0.4 0.6 0.8 1
G
q
0
500
Voltage@eVD
@
A
2
Fig. 2. The current-voltage characteristic of an SGSC with E
G
= 1.1 eV. The solid and dashed
lines represent the J
(V) function for a flat cell without concentrators, placed on Earth at a
temperature of 300 K and at absolute zero (the temperature corresponding to the ultimate
efficiency), respectively.
potential difference, which can be defined by the potential at the terminals:
β
e
(E, Δμ)=
2F
e
h
3
c
2
E
2
e
(E−Δμ)/k
b
T
c
−1
,(8)
where T
c
is the temperature of the cell, and Δμ is the chemical potential difference defined as
the difference of the quasi-Fermi levels (defined in the next Section):
Δμ
= E
FC
− E
FV
= qV.(9)
The lower boundary of the integral (7) depends on the emissivity, e
(E) (one for energies above
E
G
, zero otherwise) of the p-n junction, and thus determines the maximum voltage of the
junction (the maximum load resistance that can be applied). Above this voltage the device
will emit light.
The current-voltage function (1) becomes:
J
(V)=q
∞
E
G
(β
s
(E) − β
e
(E, V)) dE. (10)
Figure 2 presents the current-voltage characteristics of a cell with bandgap E
G
at different
temperatures. As established above, the maximum voltage (at T
= 0 K) is determined by E
G
.
In the limit of T
= 0 K temperature the value of efficiency achieves its maximum value for the
specific solar cell, i.g., the ultimate efficiency.
2.2 Intermediate band solar cells
In this section we will show how to extend the expression (10) to the case of the cell with
intermediate band. The model IBSC device, shown in Fig. 3, includes emitters n and p, for
separation and extraction of the carriers, and an intermediate band (IB) absorber material
placed between them. It is desirable that the IB be thermally separated from the valence
band (VB) and the conduction band (CB), so that the number of electrons in the IB can only
be changed via photon absorption or emission. This assumption allows to introduce three
214
Solar Cells – New Aspects and Solutions
Semiconductor Super lattice-Based Intermediate-Band Solar Cells 5
G
E
IB
Load
FI
FV
FC
IB CB
Fig. 3. Model of the band structure of a solar cell with intermediate band. The terminals of
the solar cell are connected to the n and p emitters. The possible excitation processes, via
one-photon or two-photon absorption, are indicated by arrows. Up down arrows indicate
energy differences between band edges.
quasi-Fermi levels, one for each band, to describe the population of electrons within the bands.
An infinite mobility of electrons is assumed, to ensure constant quasi-Fermi levels across the
junction and minimize the occurrence of non-radiative light traps. The introduction of the
IB can improve the efficiency by allowing the absorption of low-energy photons, and thus
overcome the problems of the impurity level concept. In Fig. 3 the lowest energy difference
between the bands is seen to depend on the value of E
IB
, the energy difference between the IB
and the CB; E
IB
determines also the threshold energy of the absorbed photons.
In the basic version of the model, the absorption and emission coefficients between each
band are assumed to be as presented in Fig. 4. It would probably be more realistic, but
still advantageous, to assume that the absorption coefficients corresponding to different
transitions are constant, but differ in value. Since the photons that contribute to the transitions
between VB and CB predominate in the incident light, the transitions between IB are CB are
much weaker that those between VB and IB. According to Martí et al. (2006), the problem has
not yet been studied systematically. However, this assumption seems to reflect the behavior of
real systems. Thus, the absorption coefficient for different transitions will fulfill the relation:
α
VC
> α
VI
> α
IC
. (11)
This allows to assume specific values of the absorption coefficients in Fig. 4, but implies that
the absorption between IB and CB will be marginal, and so will be the current generated by
two-photon absorption.
The assumed form of the absorption and emission functions allows to specify the boundaries
of the integrals in the expression for the photon flux absorbed or emitted by the band,
analogously to the SGSC model. Three fluxes are distinguished, one for each of the three
transitions: VB-CB, VB-IB and IB-CB. Each of the three fluxes contains information on the
number of absorbed and emitted photons per unit of time per unit of area:
∞
E
G
(
β
s
(E) − β
e
(E, μ)
)
dE, (12)
215
Semiconductor Superlattice-Based Intermediate-Band Solar Cells
6 Will-be-set-by-IN-TECH
0 1 2 3 4 5 6 7
0
100
200
300
400
500
600
E
IB
E
G
@
W
2
E
G
E
IB
-
0 1 2 3 4 5 6 7
0
1.0
Photon Energy @eVD
0 1 2 3 4 5 6 7
0
1.0
0 1 2 3 4 5 6 7
0
1.0
Photon Energy @eVD
a)
b)
c)
d)
a
a
a
Fig. 4. (a) Radiant emittance of a blackbody at a temperature of 5760 K. Below, plots of the
absorption coefficients for (b) IB
→CB, (c) VB→IB and (d) VB→CB transitions. The shape of
these functions depends on the energy gap and the assumptions made. The depicted forms
allow to determine the integral boundaries in equations (12), (13) and (14).
E
G
E
G
−E
IB
(
β
s
(E) − β
e
(E, μ
1
)
)
dE, (13)
E
G
−E
IB
E
IB
(
β
s
(E) − β
e
(E, μ
2
)
)
dE, (14)
where:
μ
1
= E
FC
− E
FI
, (15)
μ
2
= E
FI
− E
FV
. (16)
In the equilibrium state the number of electrons in the IB must be constant, which implies that
the increase/decrease due to the VB-IB transition must be equal to the decrease/increase due
216
Solar Cells – New Aspects and Solutions
Semiconductor Super lattice-Based Intermediate-Band Solar Cells 7
to the IB-CB transition:
E
G
E
G
−E
IB
(
β
s
(E) − β
e
(E, μ
1
)
)
dE =
E
G
−E
IB
E
IB
(
β
s
(E) − β
e
(E, μ
2
)
)
dE. (17)
The separation of the quasi-Fermi levels is determined by the applied load resistance and the
voltage produced at the terminals of the solar cell:
qV
= E
FC
− E
FV
=(E
FC
− E
FI
)+(E
FI
− E
FV
)=μ
1
+ μ
2
. (18)
0 0.2 0.4 0.6 0.8 11.06
557.1
200
400
800
0
20
40
60
80
100
Voltage @VD
P
[
[
[
[
W
m
2
J
A
2
@
h
P
J
h
a)
Voltage @VD
P
[
[
[
[
W
m
2
J
A
2
0 0.5 1 1.5 1.89
487.4
0
200
400
600
800
0
20
40
60
80
100
@
h
P
J
h
b)
Fig. 5. Voltage dependence of the current density, J,outputpowerP and efficiency η for (a) a
single-gap solar cell with E
G
= 1.08 eV; (b) an intermediate-band solar cell with E
G
= 1.9 eV,
E
IB
= 0.69 eV. The cell has a temperature of 300 K; the incident light is characterized by the
blackbody radiation at 5760 K and has a maximum concentration. The band alignment
corresponds to the maximum efficiency.
With the last two equations we can calculate the quasi-Fermi level separation for a given
voltage (Ekins-Daukees et al., 2005), and thus obtain the current-voltage characteristic. Figure
5 shows the J-V characteristics of (a) an SGSC and (b) an IBSC. The assumed energy gap
and intermediate band energy level correspond to the highest possible efficiency of the cell
illuminated by sunlight characterized by the 5760 K blackbody radiation, with a maximum
concentration. Presented in the same graph, the output power plot shows an increase in
efficiency. The short circuit current value is lower in the case of IBSC, but the significant
217
Semiconductor Superlattice-Based Intermediate-Band Solar Cells
8 Will-be-set-by-IN-TECH
1.5 2.0 2.5 3.0
0.2
0.4
0.6
0.8
1.0
1.2
1.4
@
f=0.70
f=0.54
f=0.15
f=0.17
0 1 2 3 4 5 6 7
0
20
40
60
80
@
62.95
15
15
5
25
35
35
45
45
55
55
62.95
IB
@
G
@
G
h
Fig. 6. Contour plot depicting the detailed balance efficiency η versus the energy gap E
G
and
the distance E
IB
between the intermediate band bottom and the CB bottom. The values of
E
IB
range from 0 to
E
G
2
. However, according to the model assumed the efficiency is
symmetric with respect to E
IB
in the range from 0 to E
G
. the inset in the top-left corner shows
the η in dependence on E
G
along the dashed line marked in the main figure. The inset shows
the changes of E
G
, E
I
(and η) for AlGaAs supperlattices in dependence on filling fraction (cf.
Fig. 11, 12).
increase in the operating voltage leads to a net increase in the efficiency. An explanation of
the decrease in the short circuit current in the IBSC (when low-energy photon are absorbed) is
provided by Fig. 4, showing the absorption coefficient dependence in the optimal IBSC. The
high power absorbed by the cell is seen to contribute to the two-photon processes.
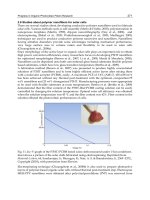
The contour plot in Fig. 6 shows the efficiency versus the bandgap and the distance between IB
and CB. These results are important for the understanding of the potential of the IB concept.
Later in this chapter they will be compared with simulation data, analyzed in terms of the
material parameters used.
If the bandwidth of the solar cell is wider than the distance from the intermediate band
to the nearest band, the spectral selectivity might be disturbed. However, these processes
are not considered in this chapter. The bandwidth is assumed to only affect the absorption
and emission spectra in one of the narrow gaps, changing the boundaries of the integrals in
equation (17):
E
G
E
G
−E
IB
(
β
s
(E) − β
e
(E, μ
1
)
)
dE =
E
G
−E
IB
E
IB
−Δ IB
(
β
s
(E) − (β
e
(E, μ
2
)
)
dE, (19)
where Δ IB is the intermediate band width.
218
Solar Cells – New Aspects and Solutions
Semiconductor Super lattice-Based Intermediate-Band Solar Cells 9
62.95
@
IB
0.690 0.695 0.700 0.705 0.710
0.00
0.02
0.04
0.06
0.08
@
D
62.9
62.5
62.5
62.1
61.7
61.3
60.9
@
h
0.00 0.02 0.04 0.06 0.08 0.10
61.0
61.5
62.0
62.5
63.0
63.5
@
D
62.95
62.1
Fig. 7. Detailed balance efficiency of an IBSC with a fixed energy gap E
G
= 1.90 eV versus the
width Δ
IB
and position E
IB
of the intermediate band. In the inset, the profile of the efficiency
function across the dashed line in the contour plot is shown.
4.5
0
5.0
5.5 6.0 6.5
1
2
3
4
5
6
G-valley energy gap (eV)
Lattice constant (A)
o
AlN
GaN
InN
AlAs
GaAs
InAs
InP
AlP
GaP
zinc-blende
T=0K
Fig. 8. Energy gap width versus lattice constant for selected III-V group semiconductor
compounds. Red line corresponds to the ternary alloy AlGaAs. Note the lattice constant does
not change significantly with changing Al concentration in the alloy. (The data have been
taken from (Vurgaftman et al., 2001))
219
Semiconductor Superlattice-Based Intermediate-Band Solar Cells
10 Will-be-set-by-IN-TECH
In this case an increase in the width of the intermediate band will result in increased
absorption, since the gap will shrink. On the other hand, the maximum applicable voltage
will decrease with increasing bandwidth, as the emission function will be affected. As shown
in Fig. 7, for a fixed energy gap the maximum efficiency may increase. The inset presents
the efficiency plotted versus the IB width for energy gap E
G
= 1.90 eV and intermediate
band level E
IB
= 0.7 eV, measured to the top edge of the IB. A maximum is found to occur
for ΔIB
= 0.015 [eV]; the maximum value is η = 62.96%. An improvement by 0.04% is
reported in (Green, 2003). An increase by 0.03% is achieved in the cell illuminated by the 6000
K blackbody radiation for ΔIB
= 0.02 eV.
3. Calculation of the band structure
We consider a 2D semiconductor superlattice which consists of a periodic array of
semiconductor inclusions embedded in a semiconductor matrix. Such a system has an
artificially introduced periodicity with a lattice constant much larger than the interatomic
distances. As a result of introducing this additional periodicity the conduction and valence
bands split into a set of minibands. In this regime of length and energy we can regard the
system as continuous on the atomic scale and, in the case of direct gap semiconductors, use
the effective parameters describing the position and curvature of the conduction band bottom
and the valence band top. Then, the miniband structure of the conduction and valence bands
can be calculated with the aid of effective Hamiltonians with spatially dependent effective
parameters (Bastart, 1988; Burt, 1999; Califano & Harison, 2000). In the case of semiconductors
with a relatively wide gap, such as AlGaAs, the electronic system can be decoupled from the
system of light and heavy holes. Also, the stress at the inclusion/matrix interfaces can be
neglected in materials of this kind, because of the small atomic lattice constant changes related
to the different concentration of Al in the alloy (see Fig. 8). Thus, the simple BenDaniel-Duke
Hamiltonian (BenDaniel & Duke, 1966) can be used for electrons in the vicinity of point Γ of
the solid semiconductor structure:
−α
∂
∂x
1
m
∗
(r)
∂
∂x
+
∂
∂y
1
m
∗
(r)
∂
∂y
+
∂
∂z
1
m
∗
(r)
∂
∂z
+ E
C
(r)
Ψ
e
(r)=EΨ
e
(r), (20)
where r is the position vector in 3D space. The dimensionless constant α
= 10
−20
¯h
2
/(2m
e
e) ≈
3.80998 (m
e
and e are the free electron mass and charge, respectively) allows to express the
energy and the spatial coordinates in eV and Å, respectively; m
∗
is the effective mass of the
electron; E
C
denotes the conduction band bottom. Both parameters are periodic with the
superlattice period:
m
∗
(r + R)=m
∗
(r),
E
C
(r + R)=E
C
(r), (21)
where R is a lattice vector of the superlattice. We have used the following empirical formulae
for a linear extrapolation of the material parameter values in GaAs and AlAs to estimate their
values in the Al
x
Ga
1−x
As matrix: E
C
= 0.944x and m
∗
= 0.067 + 0.083x, x is a concentration
of the Al in GaAs (Shanabrook et al., 1989; Vurgaftman et al., 2001).
In the case of a zinc blende structure (e.g., AlGaAs) both the light- and heavy-hole bands must
be taken into account. The Schrödniger equation for each component of the envelope function
220
Solar Cells – New Aspects and Solutions
Semiconductor Super lattice-Based Intermediate-Band Solar Cells 11
for light-holes, Ψ
lh
and heavy-holes Ψ
hh
reads (Datta, 2005):
−
⎛
⎜
⎜
⎝
ˆ
P
+
ˆ
Q 0 −
ˆ
S
ˆ
R
0
ˆ
P
+
ˆ
Q
ˆ
R
∗
ˆ
S
∗
−
ˆ
S
∗
ˆ
R
ˆ
P
−
ˆ
Q 0
ˆ
R
∗
ˆ
S 0
ˆ
P −
ˆ
Q
⎞
⎟
⎟
⎠
Ψ
h
(r)=EΨ
h
(r), (22)
where
Ψ
h
(r)=
Ψ
lh↑
(r), Ψ
lh↓
(r), Ψ
hh↓
(r), Ψ
hh↑
(r)
T
. (23)
The subscripts lh and hh label the components of the envelope function for the light and heavy
holes, respectively. The symbols
↑ and ↓ refer to bands related to opposite z components of
the light- and heavy-hole spins. The operators
ˆ
P,
ˆ
Q,
ˆ
R and
ˆ
S have the form:
ˆ
P
= E
V
(r)+α
∂
∂x
γ
1
(r)
∂
∂x
+
∂
∂y
γ
1
(r)
∂
∂y
+
∂
∂z
γ
1
(r)
∂
∂z
,
ˆ
Q
= α
∂
∂x
γ
2
(r)
∂
∂x
+
∂
∂y
γ
2
(r)
∂
∂y
−2
∂
∂z
γ
2
(r)
∂
∂z
,
ˆ
R
= α
√
3
−
∂
∂x
γ
2
(r)
∂
∂x
−
∂
∂y
γ
2
(r)
∂
∂y
+ i
∂
∂x
γ
3
(r)
∂
∂y
+
∂
∂y
γ
3
(r)
∂
∂x
,
ˆ
S
= α
√
3
∂
∂x
γ
3
(r)
∂
∂z
+
∂
∂z
γ
3
(r)
∂
∂x
−i
∂
∂y
γ
3
(r)
∂
∂z
+
∂
∂z
γ
3
(r)
∂
∂y
. (24)
The Luttinger parameters γ
1
, γ
2
, γ
3
, describe, the effective masses 1/(γ
1
+ γ
2
) and 1/(γ
1
−
γ
2
) of light and heavy holes near point Γ of the atomic lattice are, like the position of the
valence band top E
V
, periodic in the superlattice structure:
γ
β
(r + R)=γ
β
(r),
E
V
(r + R)=E
V
(r), (25)
where the subscript β is 1, 2 or 3. For periodic heterostructures consisting of a triangular or
square lattice-based system of GaAs rods embedded in Al
x
Ga
1−x
As, the following material
parameter values, dependent on the concentration of Al in aluminium gallium arsenide, can
be assumed (Shanabrook et al., 1989; Vurgaftman et al., 2001):
E
V
= 1.519 + 0.75x,
γ
1
= 6.85 − 3.40x,
γ
2
= 2.10 − 1.42x,
γ
3
= 2.90 − 1.61x. (26)
We are interested in the calculation of the spectra of a finite-thickness periodic layer of
inclusions (see Fig. 9). In such superlattices, when the superlattice period and the layer
thickness are of the order of a few nanometers the lowest miniband within the CB is detached
from the other CB minibands. Moreover, the higher CB minibands overlap to form a
continuous energy range without minigaps.
221
Semiconductor Superlattice-Based Intermediate-Band Solar Cells
12 Will-be-set-by-IN-TECH
a
1
a
2
A
B
r
h
2
A
B
C
C
a)
b)
y
x
z
z
x
y
y
A
B
C
A
B
C
C
h
1
A
B
C
h
2
c)
z
x
Fig. 9. Structure of a periodic slab with inclusions in triangular lattice, (a) top and (b) side
view. Letters A, B and C denote the inclusion, matrix and spacer materials, respectively. The
arrows indicate the cross-section plane. Dashed parallelogram in (a) delimits the unit cell,
which reproduces the whole plane when translated by superlattice vectors a
1
and a
1
.(c)The
supercell structure used in the plane wave method: an infinite stack of replicas of the
periodic slab.
In the VB all the minibands overlap or are separated by extremely narrow minigaps. Let us
assume for simplicity that the total spectrum can by approximated by the model with a single
gap (delimited by the top of the highest VB miniband and the bottom of the block of higher
CB minibands) and a single intermediate band formed by the first (lowest) CB miniband.
This simplification allows us to calculate the detailed balance efficiency of solar energy
conversion for a superlattice-based solar cell using the model with a single intermediate band
within the gap.
3.1 Plane wave method
We have calculated the band structure of electrons and holes by the plane wave method
(PWM), a technique successfully applied to studying the electronic states in semiconductor
heterostructures with quantum dots and wires of different shape and size, as well as
interdiffusion and strain effects on electronic bands (Cusack et al., 1996; Gershoni et al., 1988;
Li & Zhu, 1998; Li et al., 2005; Ngo et al., 2006; Tkach et al., 2000). By Fourier-expanding the
spatially dependent structural parameters: m
∗
, γ
β
, E
C
, E
V
, and the electron and hole envelope
functions the differential equations (20) and (22) can be transformed to a set of algebraic
equations for the Fourier coefficients of the envelope functions. This set of equations has the
form of an eigenvalue problem with eigenvalues being the energies of successive minibands
for the selected wave vector.
The PWM can only be applied to periodic systems. The structure under consideration is
finite in one direction, though. To adopt the method to the case considered we calculate the
spectrum of an infinite stack of weakly coupled periodic layers, as presented in Fig. 9(c). If
222
Solar Cells – New Aspects and Solutions
Semiconductor Super lattice-Based Intermediate-Band Solar Cells 13
0 6.
0 8.
0 2.
0 4.
0
1
E
I
CB
IB
E
G
140 160 1800 20 40 60 80 100 120
GGKM
A
HL
A
KHM L
E[eV]
a)
h =100A
1
o
h =50A
2
o
G
K
M
A
H
L
k
z
k
y
k
x
b)
Fig. 10. (a) Electronic minibands in the structure presented in Fig. 9, with GaAs cylinders
(material A) embedded in Al
0.35
Ga
0.65
As slabs (B) separated by an AlAs spacer (C). Red
dashed line represents bands in a 2D superlattice formed by an array of infinitely long rods
(i.e., for k
z
= 0). For a sufficiently thick spacer layer the minigaps are dispersionless in the z
direction (lines K-H and M-L in the Brillouin zone shown in (b)). This proves a good
separation of the periodic slabs. The calculations were performed for a superlattice with
lattice constant a = 50 Å and filling fraction f
= 0.3. The reference energy level E = 0eV
corresponds to the CB bottom in solid GaAs. The slab thickness h
2
is 50 Å and the AlAs
spacer thickness h
1
is 100 Å.
the distance between adjacent layers is large and the potential in the spacer material C forms
a high barrier both for electrons and holes, the spectrum of the system is very close to that of
a single isolated layer (Rodríguez-Bolívar et al., 2011).
Figure 10(a) shows the electronic spectrum of the structure presented in Fig. 9, with circular
GaAs rods embedded in AlGaAs slabs. Adjacent GaAs/AlGaAs slabs are separated by an
AlAs spacer, relatively thick and with a high potential to ensure a good separation of the
periodic slabs. This is reflected in the flat dispersion in the z direction (high-symmetry lines
K-H, M-L, Γ-A) and the repeated shape of the dispersion branches Γ
− K − M − Γ and A −
H − L − A. Thus, the case considered proves equivalent to that of a single periodic slab. In the
considered range of structural parameter values the electronic spectrum includes one clearly
detached miniband and a continuous block of minibands above it. The VB minibands (not
shown in Fig. 10) overlap. Thus, the model with a single intermediate band (formed by the
first CB miniband) within the energy gap (between the VB and the block of CB minibands)
can be used for the calculation of the detailed balance efficiency.
4. Detailed balance efficiency of periodic semiconductor slab
We calculate the electronic and hole spectra of periodic semiconductor layers with different
filling fraction values. The filling fraction is defined as the ratio of the in-plane cross-section
S
inc
of the inclusion to the area S of the unit cell area:
f
=
S
inc
S
. (27)
223
Semiconductor Superlattice-Based Intermediate-Band Solar Cells
14 Will-be-set-by-IN-TECH
a)
b)
x
y
x
y
Filling Fraction
@
h
G
X
M
ultimate efficiency
detailed balance efficiency
0.20 0.25 0.30 0.35 0.40 0.45 0.50 0.55
28
30
32
34
36
38
Fig. 11. (a) Detailed balance efficiency and ultimate efficiency of solar energy conversion
versus filling fraction for a slab (of thickness h
2
=50Å) with cylinders (dashed red line) and
square prisms (solid black line) arranged in a square lattice (the lattice constant of the
superlattice is a
= 50 Å). The inclusion, slab and spacer materials are GaAs, Al
0.35
Ga
0.65
As
and AlAs, respectively. (b) The high-symmetry line in the first Brillouin zone used in the
search of absolute minigaps.
We consider two shapes of the inclusions: cylinders and square prisms, and two lattices: the
square and triangular lattice. Thus, four combinations of the system geometry are possible.
For each combination we calculate the position and width of the valence and conduction
bands versus the filling fraction. The following parameters of the band structure are extracted
from the calculations:
• the width of the energy gap E
G
between the top of the VB and the bottom of the block of
CB minibands,
•theshiftE
I
between the bottom of the first CB miniband and the bottom of the block of
higher CB minibands,
•thewidthΔE
I
of the intermediate band (the first CB miniband).
All three parameters are used in the calculation of the detailed balance efficiency of solar
energy conversion for four geometries mentioned above.
224
Solar Cells – New Aspects and Solutions
Semiconductor Super lattice-Based Intermediate-Band Solar Cells 15
a)
b)
x
y
M
G
K
ultimate efficiency
detailed balance efficiency
x
y
0.2 0.3 0.4 0.5 0.6 0.7
Filling Fraction
@
h
28
30
32
34
36
38
40
Fig. 12. (a) Detailed balance efficiency and ultimate efficiency of solar energy conversion
versus filling fraction for a slab (of thickness h
2
=50Å) with cylinders (dashed red line) and
square prisms (solid black line) arranged in a triangular lattice (the lattice constant of the
superlattice is a
= 50 Å). The inclusion, slab and spacer materials are GaAs, Al
0.35
Ga
0.65
As
and AlAs, respectively. (b) The high-symmetry line in the first Brillouin zone used in the
search of absolute minigaps.
The lattice constant of the superlattice is fixed at a
= 50 Å. The assumed thickness of the
periodic slab is h
2
= 50 Å. A maximum efficiency can be observed in this size range, with
the thickness of the periodic slab comparable to the lattice constant of the superlattice. The
inclusion and matrix materials are GaAs and Al
0.35
Ga
0.65
As, respectively. A thick AlAs spacer
(of thickness h
1
= 100Å) ensures a good separation of adjacent periodic slabs in the PWM
supercell calculations. We used 15x15x15 and 13x13x13 plane waves in the calculations of the
electronic and hole spectra, respectively.
Figures 11(a) and 12(a) present the calculated ultimate efficiency and detailed balance
efficiency versus filling fraction. To investigate the width of the absolute minibands/minigaps
we calculated the electronic and hole spectra along the high-symmetry lines shown in
Figs.11(b) and 12(b) for square and triangular lattices. The assumed upper bound of
≈ 0.7
of the filling fraction range in Fig. 12 (triangular lattice) corresponds to the maximum
filling fraction values, or touching adjacent inclusions, in the considered structures: 0.68 for
225
Semiconductor Superlattice-Based Intermediate-Band Solar Cells