Sustainable Energy Harvesting Technologies Past Present and Future Part 6 potx
Bạn đang xem bản rút gọn của tài liệu. Xem và tải ngay bản đầy đủ của tài liệu tại đây (736.65 KB, 20 trang )
Modelling Theory and Applications of the Electromagnetic Vibrational Generator
89
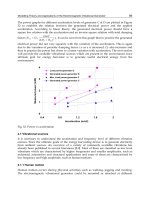
The power graphs for different acceleration levels of generator C & D are plotted in Figure
32 to establish the relation between the generated electrical power and the applied
acceleration. According to linear theory, the generated electrical power should have a
square law relation with the acceleration and an inverse square relation with total damping
factor (
2
2
)(2
)(
emp
emavg
DD
ma
DP
+
=
). It can be seen from this graph that in practice the generated
electrical power did not vary squarely with the variation of the acceleration. This is again
due to the variation of parasitic damping factor, i.e as a is increased, D
p
also increases and
thus in practice the power has closer to a linear variation with acceleration. The next section
will provide the available vibrational sources which are present in the environment since
ultimate goal for energy harvester is to generate useful electrical energy from the
environment.
0
1
2
3
4
0.4 0.8 1.2 1.6 2
Acceleration (m/s2)
Measured power (mW)
Load power-generator D
Generated power-generator D
Max. Load power-generator C
Generated power-generator C
Fig. 32. Power vs acceleration
2.1 Vibrational sources
It is necessary to understand the acceleration and frequency level of different vibration
sources. Since the ultimate goals of the energy harvesting device is to generate electricity
from ambient sources. An overview of a variety of commonly available vibrations has
already been published in several literatures [2,9]. Most of them are classified as low level
vibrations which are characterised by higher frequencies and smaller amplitudes, such as
industrial, automotive and structural applications and some of them are characterised by
low frequency and high amplitude, such as human motions.
2.1.1 Human motion
Human motion occurs during physical activities such as walking, jogging and running.
The electromagnetic vibrational generator could be mounted or attached at different
Sustainable Energy Harvesting Technologies – Past, Present and Future
90
locations on the human body, wired into clothes, foot-wear, a belt bag, rucksack, etc to
power electronic devices using these activities. However, the amplitude, frequency, and
nature of the vibration can be quite different at different locations on the human body and
the acceleration would be quite high and frequencies are very low in these circumstances.
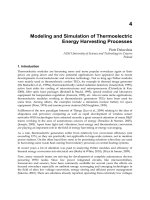
For example, the acceleration level in different locations on the human body is shown in
Figure 33 during walking, jogging and running on a treadmill (measured for VIBES
project [31-33]). Table 6 summarises a few examples of the measured acceleration levels
during walking when the accelerometer was tightly fastened on the ankle, wrist and
chest. It can be seen that the maximum vertical acceleration level can be achieved at the
ankle with 108 m/s
2
compared to 25 m/s
2
on the wrist and 6.6 m/s
2
on the head (front).
The maximum vertical acceleration levels during walking and slow running condition
were 4.9 m/s
2
(0.5g) and 9.81 m/s
2
(1g) when the accelerometer was placed in rucksack
bag, as shown in Figure 34. It can be seen from this measurement that vibration is
irregular and consists of high amplitude impulse like excitation rather than sinusoidal
excitation and the frequency is less than 3 Hz. A resonant generator may not be the most
suitable for human motion due to low frequency, high amplitude and irregular nature of
human movement. Since the vibration signal in human motion tends to be non-sinusoidal
random vibration, a suitable generator structure is necessary which can vibrate easily at
off resonance conditions.
Fig. 33. Accelerometer locations on the human body.
Location Maximum acceleration (m/s
2
)
Ankle 108
Wrist 25
Chest 16
Head (front) 6.6
Table 6. Summary of acceleration levels on the human body.
Modelling Theory and Applications of the Electromagnetic Vibrational Generator
91
-2
-1
0
1
2
00.511.52
Time (s)
Measured acceleration (g)
Acceleration-rucksack walk
Acceleration-rucksack slow run
Fig. 34. Measured acceleration inside rucksack bag during walking and slow running.
2.1.2 Home appliance, machinery and automotive vibration
Vibrations from automotive applications give rise to frequencies of tens of Hz to several
hundred Hz but with smaller accelerations. The vibrations generated from home appliances
such as clothes, dryers, small microwave ovens and blender casings [9],[31],[32] are similar.
Vibrations from rotating machines, such as pumps and fans, can include quite high
frequency
components, but are in general limited to relatively small accelerations. The
rotational speed of these machines is constant and generates several harmonic frequency
vibrations which consist of multiples of the fundamental frequency corresponding to the
rotational speed. The vibration spectrum of an industrial fan (nominal speed 1500 rpm- 25
Hz), pump (nominal speed 3000 rpm-50 Hz) and air compressor unit were measured in
different positions of the machines for the VIBES project [5], [33]. Figure 35, 36 and 37 show
the vibration spectrum of an industrial fan and top and bottom of an air compressor unit at
different positions. It can be seen from the graphs that the vibration signal is quite low
amplitude with multiple vibration peak frequencies. It can be seen that all these have a peak
at or near 50 Hz, 100, 150 or 250 Hz. A resonant generator structure is essential for this
application in order to achieve a reasonable displacement from this very low amplitude
vibration. Table 7 shows the available acceleration and frequency level of the different home
appliance, machinery and automotive sources. In the following section, we present such a
generator and measure the power generated from human motion when the generator is
placed in a rucksack. The generator makes use of a “magnetic spring” as opposed to a
mechanical spring, which could give advantages such as ease of construction, ease of
tenability, and lower sensitivity to fatigue.
Sustainable Energy Harvesting Technologies – Past, Present and Future
92
Fig. 35. Measured vibration spectrum of the industrial fan from [33].
CA RV
CA RH
COA RV
COA RH
Modelling Theory and Applications of the Electromagnetic Vibrational Generator
93
0
0.01
0.02
0.03
0.04
0.05
0.06
0.07
0.08
050100
Fr e que ncy, Hz
Fig. 36. Measured vibration spectrum on top of the air compressor unit [5 ]
0
0.05
0.1
0.15
0.2
0.25
0.3
0.35
0 25 50 75 100 125
Frequency, Hz
Acc, g
Fig. 37. Measured vibration spectrum at the bottom of an air compressor unit [ 5]
Vibration source Fundamental frequency
(Hz)
Acceleration
(m/s
2
)
Car engine compartment 200 12
Base of 3-axis machine tool 70 10
Blender casing 121 6.4
Clothes dryer 121 3.5
Car instrument panel 13 3
Door frame just after door closes 125 3
Small microwave oven 121 2.5
HVAC vents in office building 60 0.2-1.5
Windows next to a busy road 100 0.7
CD on notebook computer 75 0.6
Second story floor of busy office 100 0.2
Vehicle –C (high way) 15.13 1.987
Vehicle –C (mountain) 36.88 0.0175
Vehicle-C (city) 52.87 0.0189
Industrial fan 25 0.7
Pump 50 1.4
Table 7. Home appliance, machinery and automotive vibration
Sustainable Energy Harvesting Technologies – Past, Present and Future
94
2.2 Magnetic spring generator and its applications
An electromagnetic vibrational generator could be used to power electronic devices using
human body activity would be considerable interest. In such an application, For example, a
displacement of
==
n
D
ma
x
ω
9.75 mm could be achieved for a mass of m of 10 mg, a of 4.905
m/s
2
, D of 0.4 N.s/m at f
n
equal to 2 Hz.
In this case, the generated electrical power,
2
2
)(2
)(
emp
em
DD
ma
DP
+
=
=1.5 mW assuming EM
damping can be made equal to parasitic damping.
It can be seen from this simple calculation that at least several cm size generators are
required. In particular, a cantilever resonant generator structure would not be realistic for
such a low frequency application. If we consider a 3 mm width and 50 μm thick Si or Cu
cantilever beam, the length of the cantilever for a 10 mg mass and 2 Hz frequency would be:
=⇒== Lm
L
EI
k
n
2
3
3
ω
290 mm
In order to achieve a 10 Hz frequency, a Si cantilever would have to be a 100 mm long. We
present such a generator and measure the power generated from human motion when the
generator is placed in a rucksack. The generator makes use of a “magnetic spring” as
opposed to a mechanical spring, which could give advantages such as ease of construction,
ease of tenability, and lower sensitivity to fatigue. Some of these results have already been
highlighted in literature [4].
Figure 38 shows different possible configurations for the magnetic spring generator
structure. The basic idea is that axially magnetized permanent magnets are placed vertically
inside a tube so that facing surfaces have the same polarization. Thus, the magnets repel one
another. Two magnets are fixed at both ends of the generator tube housing. A middle
magnet or magnets is free to move but is suspended between both fixed end magnets in the
generator housing due to the repulsive force. A coil is wrapped around the outside of the
tube. When the tube is vibrated, the middle magnet vibrates up and down, and a voltage is
induced in the coil. This structure can be built easily since the generator simply consists of
magnets and a coil without the need for any mechanical beam. Essentially the suspended
moving magnet acts like a magnetic spring constant. This construction is similar to the
inductively powered torch [34], except with the addition of a magnetic spring. We know
that the generation of voltage is the product of flux linkage gradient and velocity. In order to
increase the flux-linkage, the single moving magnet can be replaced by two magnets
separated by a soft magnetic “pole” piece, where the magnets and pole piece are glued
together so that they move as a single object as shown in Figure 38 (b). The variation of
flux-linkage between the single moving magnet and double moving magnets plus pole
structure generator will be shown in the next section.
In order to increase the displacement, instead of using two fixed magnets, the generator
could be built using only one fixed end magnet and a single moving object, as shown in
Figure 38 (c). In this case, the resonant frequency would be lower and the displacement of
Modelling Theory and Applications of the Electromagnetic Vibrational Generator
95
the moving magnet would be higher compared to both fixed end magnets. The benefit of
this concept in a human motion powered generator can be explained by considering the
response of a spring damper system to an impulse excitation :
(
)
[
]
[]
00
0
/, 0
exp( ) sin( )
nd
Xt F kfor t t
tX t Ø
f
or t t
ξω ω
=<<
=− + >
(32)
When the top magnet is removed from the generator, the effective spring constant is
decreased and hence the resonant frequency is decreased. Thus according to equation (32),
the initial displacement will be greater and the decay rate will be slower, which would
result in increased voltage and larger average power. This concept will be verified with the
measured results of the real prototype which has been built and tested.
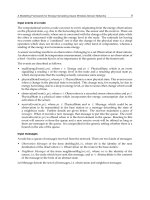
Fig. 38. Magnetic spring generator structure: (a) Single moving magnet (b) Single moving
magnet replaced by two magnets + pole (c) One fixed magnet.
2.3 Analysis of generator structure
The generator structure has been modeled using Finite Element Analysis (FEA) in order to
understand the spring forces which exist between the fixed and moving magnets and to
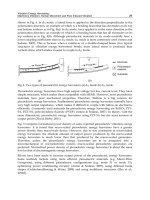
understand the flux linkage with the coil. Figures 39 (a) and (b) show the results of an axi-
symmetric finite element simulation of the corresponding generator structure of Figure 32 (a)
and (b), respectively, showing magnetic field lines. In Figure 39 (a), a 15 x 19 mm single
moving magnet is used. In Figure 39 (b), 15 x 8 mm double moving magnets and a 15 x 3 mm
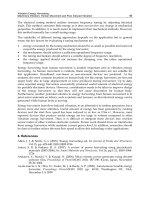
ferrite core are used. The overall generator dimensions are given in the next section. Figure 40
shows a plot of the radial component of the B field along a line extending from the top to the
bottom of the generator for both of the generator structures. It can be seen from these field
plots that the peak flux density for the double moving magnets with the pole piece is almost
twice as high as for the single moving magnet generator structure. Thus, the flux gradient is
higher, which translates into higher voltages and higher electromagnetic damping.
Sustainable Energy Harvesting Technologies – Past, Present and Future
96
(a) (b)
Fig. 39. Finite element simulation, showing flux lines for a) single moving magnet b)
double moving magnets plus pole generator structure.
It is also of interest to investigate the dependence of the force between the magnets poles,
which can be expressed analytically [35] as:
2
210
4
r
F
mm
m
π
μ
=
(33)
where
AHQ
cm
=
, H
c
is the coercive force and A is the pole surface area, r is the distance
between the poles. The spring constant, k, over small displacements, x, can be calculated
from the linear approximation of the balanced forces equation:
Fkx
=
(34)
where the total force, F, acting on the centre magnet is given by
21 mm
FFF
−
=
, F
m1
and F
m2
are the repulsive force magnitude on the middle magnet due to the top and bottom magnets
respectively. The electromagnetic force and spring constant can be calculated from a FE
transient simulation using the force vs displacement graph for the double moving magnets
Fixed end magnets
Fixed end magnets
Pole
Moving magnet
Moving magnet
Moving magnet
Modelling Theory and Applications of the Electromagnetic Vibrational Generator
97
-0.6
-0.3
0
0.3
0.6
10 20 30 40 50 60
Distance (mm)
Fluxdensity (T)
Double moving magnets +pole
Single moving magnet
Fig. 40. Plot of radial component of flux density along a coil surface line extending from the
top of the magnet tube to the bottom.
-0.4
-0.2
0
0.2
0.4
-0.008 -0.004 0 0.004 0.008
Displacement (m)
Force (N)
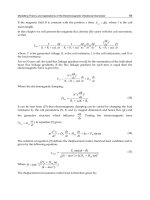
Fig. 41. Electromagnetic force vs displacement of the double moving magnets + pole
generator.
plus pole structure generator which is shown in Figure 41. The resting position of the
moving magnets is 4 mm away from the middle position due to the gravitational force. It
can be seen from this graph that the electromagnetic force on the moving magnets is almost
linear with displacement. The spring constant between the 4 mm to 8 mm region can be
linearised and estimated from the graph as 61.5 N/m. In order to calculate the voltage and
Sustainable Energy Harvesting Technologies – Past, Present and Future
98
the electromagnetic damping factor, the flux linkage gradient is also necessary. This flux
linkage gradient can be calculated from the simulated displacement and flux linkage graph
as shown in Figure 42. The gradient from + 4 mm to -4 mm is 23 Wb/m. The coil can always
be positioned to take advantage of this flux gradient.
Fig. 42. FE simulated flux linkage gradient for the double moving magnets + pole generator.
2.4 Generator prototype and test results
The generator prototype consists of two opposite polarity circular magnets tightly glued to a
3 mm thick steel pole piece. This combination was inserted into a hollow Teflon tube so that
it can move freely. After inserting, the two opposite polarity magnets were fixed on the both
ends of the Teflon tube and 40 μm copper wire with 1000 turns coil was wrapped around
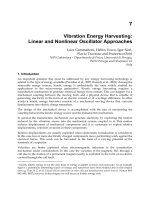
the tube, offset by -4 mm away from the centre of the tube. Figure 43 shows the prototype
which has been built, pictured beside a standard AA size battery. The complete dimensions
and parameters of the generator are given in Table 8.
Parameters Dimension
Tube (mm) 17 X 55
Middle magnets (mm) 15 X 8
End magnets (mm) 10 X 1
Moving mass (kg) 0.027
Coil outer diameter (mm) 18
Coil inner diameter (mm) 17
Coil thickness (mm) 6
Coil resistance (ohm) 800
Table 8. Generator parameters
Modelling Theory and Applications of the Electromagnetic Vibrational Generator
99
Fig. 43. Tube generator -1
2.4.1 Measured results for sinusoidal acceleration
For the first tests, the generator mounted it vertically on a force controlled electromagnetic
shaker. The vibration frequency of the shaker was swept in order to determine the resonant
frequency of the moving magnet combination. Any system always generates maximum
vibration at the resonance condition and resonance occurs when the system natural
frequency matches with the vibration frequency.
Figure 44 shows the no-load voltage vs frequency curve for 0.38259 m/s
2
acceleration level.
It can be seen that the resonant frequency of the generator is at approximately 8 Hz. The
theoretical resonant frequency, calculated from
mk
n
/=
ω
, where the spring constant, k,
was estimated from the previous simulation, is 7.6 Hz. The measured open circuit quality
factor of the generator can be estimated from the frequency response to be 18. The
maximum load power measured was 14.55 μW using 7.3 kΩ load resistance where the
electromagnetic damping and parasitic damping are equal. However, the aim of this
generator is not to excite it with sinusoidal excitation but to excite from human movement.
In the next section, we present the measured and calculated results for the prototype with
human body movement.
2.4.2 Measured results of the generator for human body vibration
The generator was placed inside a rucksack and the voltage and power outputs were
measured during walking and slow running conditions. An ADXL321 bi-axial accelerometer
was mounted on the generator body and connected to an XR440 pocket data logger. The
pocket data logger was used to measure the generator load voltage and the acceleration
levels experienced by the generator.
The measured acceleration for 2 seconds data during walking and slow running conditions
has already been discussed in the application section. The data shows peak acceleration
levels of approximately 0.5g with a frequency of 2 Hz for walking and peak acceleration
levels of approximately 1g with a frequency of approximately 2.75 Hz for slow running.
Sustainable Energy Harvesting Technologies – Past, Present and Future
100
1000
1300
1600
1900
2200
7.7 7.8 7.9 8 8.1 8.2 8.3
Frequency (Hz)
No-load peak voltage (mV)
Fig. 44. Measured no-load peak voltage for half power bandwidth frequency.
Figure 45 shows the measured generated voltage graph during the walking and slow
running conditions. It can be seen that the generated voltage for the slow running case is
more than two times higher than for the walking case. The average load powers of the
generator were measured to be 0.30 mW for walking and 1.86 mW for slow running when
the coil resistance and load resistance are matched.
A second version of this generator, without a top fixed magnet, was also tested in order to
compare the difference in the system frequencies, generated voltages and power levels.
Figure 46 shows the measured generated voltage graph during the walking and slow
running conditions. The average measured maximum load powers of the generator without
top fixed magnets were 0.95 mW and 2.46 mW during the walking and slow running
conditions respectively. Comparing this to the power levels obtained from the generator
with both fixed magnets, it can be seen that the power level is increased three times during
walking but the power level during the slow running condition is increased by only 32 %.
During the slow running condition, the magnet displacement is large and it moves outside
the coil where it does not generate any more voltage or power. In this case, the dimensions
of the coil should be optimized for the expected displacement. In order to verify the
generator voltage obtained from a single shock, the impulse responses of both generators
were captured in an oscilloscope and are shown in Figure 47. It can be seen that the natural
frequency and decay rate are higher in the case of the top and bottom fixed end magnet
generator than the generator without top fixed magnet generator. Due to the lower spring
constant the generator without the top end magnet gives a higher displacement of the
moving magnet as well as a higher voltage. This is consistent with equation (32) discussed
earlier.
Ultimately, the electrical energy generated will have to be stored in either a rechargeable
battery or a capacitor. Thus it is of interest to investigate how much energy the generator
can store over a certain period of time. The generator was placed inside a rucksack and the
Modelling Theory and Applications of the Electromagnetic Vibrational Generator
101
-10
-5
0
5
10
0 0.5 1 1.5 2
Time (s)
No-load voltage (V)
Rucksack- slow run
Rucksack-walk
Fig. 45. Measured no-load voltage during walking and slow running when the generator
was placed inside rucksack bag.
-12
-6
0
6
12
0 0.5 1 1.5 2
Time (s)
No-load voltage (V)
Rucksack-slow run
Rucksack-walk
Fig. 46. Measured no-load voltage during walking and slow running for generator with only
one fixed magnet.
Sustainable Energy Harvesting Technologies – Past, Present and Future
102
-12
-8
-4
0
4
8
12
0 0.2 0.4 0.6 0.8 1
Time (s)
Peak voltage (V)
Without top magnet
Top and Bottom end fixed magnet
Fig. 47. Impulse responses of generators with both fixed end magnets and only one fixed
end magnet.
output was connected to a rechargeable Li-MnO
2
Varta coin cell (Maxwell-ML1220) through
a simple diode capacitor rectifier circuit. The battery was initially discharged to a voltage of
1.09 V. After 1 hour walking, the battery voltage had increased from 1.09 V to 1.27 V. In
order to calculate the energy transfer during this time, the discharged characteristic curve of
the battery was measured with a 5.5 kΩ load using the pocket logger. The measured results
show that 3.54 joules of energy is transferred to the battery from the generator. This energy
level is consistent with the powering of low power sensor modules without a battery. For
example, the power consumption of a wearable autonomous Microsystem which consists of
a light sensor, a microphone, accelerometer, microprocessor and a RF transceiver is 700 μW
which is equivalent to 2.5 joules [36]. The cantilever prototypes which have been built and
tested were not optimised and were not built for a specific application. Since the eventual
goal would be the integration of the generator into autonomous sensors modules, a
miniature generator is essential. In the following section, we will present a prototype of an
optimised micro generator and its applications.
2.5 Cantilever micro generator and its applications
The theoretical model of the electromagnetic vibrational generator had been discussed and
successfully verified with the different macro scale cantilever prototype generators which
have been built and tested. Magnetic spring generator had also been tested using real
human body applications. However all the prototypes were not optimized and it is essential
to optimize the generator for specific application in order to reduce the cost and size. Few
optimized micro generators had been built and tested by the University of Southampton for
air compressor application [5]. The theoretical analysis and the verification of the measured
results have been done as part of Author’s Ph.D work for the VIBES project. The details
optimization concepts of those micro generators were explained in the literature [5].
Modelling Theory and Applications of the Electromagnetic Vibrational Generator
103
However in this section we will highlight some parts of those results. Figure 48 shows the
VIBES optimized microgenerator associated with the electronics.
Fig. 48. VIBES generator associated with electronics powering the accelerometer.
The generator generates maximum power and delivers maximum power
to the load when
the electromagnetic damping factor equals the parasitic damping factor. Since the parasitic
damping is fixed for the particular generator within linear movement, the electromagnetic
damping factor can be increased by using the optimum magnet size for a particular coil,
using more coil turns, and keeping the gap between the magnet and coil as low as possible.
It can be seen from the following equation of electromagnetic damping that it has a square
law relation with the number of coil turns and the flux linkage gradient:
lc
em
RR
dx
d
N
D
+
=
22
)(
φ
In order to achieve the maximum flux linkage gradient, the optimum magnet for a
particular coil and the lowest possible gap between magnet and coil is necessary. Three
optimised micro generators withs 600-, 1200- and 2300 turns coil with identical mechanical
dimension have been built and tested for different acceleration levels for target application
of the air compressor unit. These three generators differ only in the number of turns in the
coil. Each coil was mounted on the same generator base and the same beam was assembled
on each base. The 70 μm thick single crystal silicon cantilever beam which was used in the
initial micro generator which was found to be too brittle to handle during assembly. The
resonance frequency of the 70 μm silicon beam was 91 Hz. The targeted application is an air
compressor unit which has a resonance frequency in the 50-60 Hz range. In order to reduce
the resonance from 91 Hz to 60 Hz, either we have to increase the beam length or decrease
Sustainable Energy Harvesting Technologies – Past, Present and Future
104
the beam thickness. Instead of using a 70 μm silicon beam, a 50 μm BeCu beam was used for
the optimized micro generators. BeCu has better fatigue characteristics and less brittle
behaviour [5] compared to Si but both have the same Young’s modulus properties. The
calculated resonance frequency of the 50 μm beam is 55 Hz, which is very close to the target
application frequency. This frequency can be adjusted to the required 50 Hz or 60 Hz
frequency during assembly. Table 9 shows the three principle parameters of the coil.
Wire diameter, λ (μm)
No. of turns
R
coil
(Ω)
Fill factor
25 600 100 0.67
16 1200 400 0.63
12 2300 1500 0.53
Table 9. Coil parameters.
In order to analyse the measured results with the linear modelling approach, initially the
micro generator with the 600 turn coil has been tested for different acceleration levels within
the linear region of the spring constant. Figure 49 shows the measured and calculated power
with an optimum load resistance of 200 Ω up to 30 mg acceleration. The generated
mechanical, generated electrical and the load power are calculated using the following
equations:
)(2
1
2
0
emp
T
loadmech
DD
F
dtxF
T
P
+
==
∫
ω
;
2
2
)(2
emp
emelec
DD
F
DP
+
=
;
lc
l
emp
eml
RR
R
DD
F
DP
+
+
=
2
2
)(2
.
The electromagnetic damping was calculated from the FEA simulations and the parasitic
damping was calculated from the measured total quality factor using the following formula:
lc
em
RR
dx
d
N
D
+
=
22
)(
φ
,
em
T
n
p
D
Q
m
D −=
ω
The measured total quality factor (total damping factor) and the open circuit quality factor
(parasitic damping factor) for 20mg acceleration were 119 (0.0084) and 232 (0.0041),
respectively. The calculated electromagnetic damping factor was 0.0043. It can be seen from
Figure 49 that the simulated power agrees with the measured power. It is also indicated
from the measured quality factor that the maximum power is transferred to the load when
the electromagnetic damping and the parasitic damping are equal which agrees with the
theoretical model. In this generator, the measured results showed that the generated
mechanical and electrical power varied with the square of the acceleration due to no
variation of the parasitic damping factor. This is in contrast to the measured results for the
macro scale generator, where it was found that the parasitic damping could change with the
acceleration level.
Modelling Theory and Applications of the Electromagnetic Vibrational Generator
105
0
3
6
9
12
0 5 10 15 20 25 30
Acceleration (mg)
Power (uW)
Measured load power
Generated mechanical power
Theoretical maximum electrical power
Model load power
Fig. 49. Measured and calculated power of optimized micro generator for 600 turns coil.
0
100
200
300
400
500
48 49 50 51 52 53 54 55
Frequency (Hz)
Volta
g
e
(
mVrms
)
600turn
1200turn
2300turn
Fig. 50. Measured load voltages on optimum load resistances.
The voltages and power for 600 turn, 1200 turn and 2300 turn generators were also
measured at 60 mg acceleration and with different load resistances. Figures 50 & 51 shows
the measured load voltage and load power vs frequency on optimum load resistances for
each generator. The optimum load resistance for 600 turns, 1200 turns and 2300 turns
generators were 200Ω, 500Ω, and 4 kΩ respectively. The measured voltage shows that the
generated voltages are almost proportional to the number of turns. However, the maximum
load powers are constant for the three coils due to the nature of wire-wound coil
Sustainable Energy Harvesting Technologies – Past, Present and Future
106
technology. The measured results could not be analysed with the linear modeling approach
due to the non linear behaviour of the generator for this acceleration. These non-linear
results could be verified with the non-linear mass-damper- spring theory [30]. However, it is
necessary to know the non linear spring constant to verify non-linear theory and this is
beyond the scope of this work. Note that for practical operation it may be desirable to
operate slightly away from the exact resonance frequency because of this non-linear effect.
Fig. 51. Measured load powers on optimum load resistances.
2.6 Conclusions
We have presented the theory behind the modeling of the electromagnetic linear vibrational
generator. The model for an electromagnetic-based vibrational energy-harvesting device has
been compared to measurements on macro scale devices and FE simulation results in order
to verify the modeling approach. The optimum conditions observed from measurements are
shown to agree well with the model. The model and the experimental results clearly show
that the generated mechanical and electrical power depends on the applied force which is
the product of mass and acceleration and the damping factor: parasitic and electromagnetic
damping. The parasitic damping depends on material properties, acceleration, etc., and the
electromagnetic damping depends on parameters of the magnet and coil parameters. The
experimental results suggest that significant parasitic damping is always present and that a
maximum of 50 % of the generated electrical power could be lost in the coil’s internal
resistance if the parasitic damping is much greater than the electromagnetic damping. The
measured results also indicate that this parasitic damping is not constant with changing
acceleration level and most likely it increases with increasing the acceleration level.
However in general the exact behaviour of parasitic damping with acceleration will depend
on the spring material. The measured results also showed that if the magnet and coil
parameters are chosen so as to maximize flux gradient and the electromagnetic damping can
be made equal to the parasitic damping, then typically 80-90% of the generated electrical
power can be delivered to the load. It is also clear that the generator size depends strongly
0
10
20
30
40
50
48 49 50 51 52 53 54 55
Frequency (Hz)
600turn
1200turn
2300turn
Power (μW)
Modelling Theory and Applications of the Electromagnetic Vibrational Generator
107
on the desired system resonance frequency which in turn depends on the spring constant
and the mass attached to the beam. In order to design the generator to operate at less than 10
Hz frequency, the generator should be at least a few cm size generator is size. We
introduced the structure of a magnetic spring electromagnetic generator which could be
beneficial over the cantilever structure for random human body activity. The prototype
generators generated 0.3 - 2.46 mW when placed inside a rucksack which was worn during
walking and slow running. These results indicate that a useful amount of voltage and power
could be generated from the vibration of the human body. However, this device has not
been optimized. The generated power of the magnetic spring generator could be increased
by adding a separate coil close to the top or bottom end of the tube and connecting all coil
terminals in parallel to the load. Moreover, it is possible that this generator could deliver
more energy during walking if placed in other locations on the body such as the waist
where higher acceleration level may be available.
3. References
[1] C. B. Williams, M.A. Harradine Shearwood, P. H. Mellor, T.S. Birch and R. B. Yates, “
Development of an electromagnetic micro-generator”, IEE Proc. Circuits Devices
Systems, vol 148, 337-342, 2001.
[2] T. V. Buren, “Body-Worn Inertial Electromagnetic Micro-Generators” Ph.D thesis, Swiss
Federal Institute of Technology Zurich.
[3] N. G. Stephen, “Energy harvesting from ambient vibration”, Journal of Sound and
Vibration, vol 293, 409-525, 2006.
[4] C. R. Saha, T. O’Donnell, N. Wang and P. McCloskey, “Electromagnetic generator for
harvesting energy from human motion”, Sensors and Actuators –A: Physical,
Volume 147, Issue1, 15 September 2008.
[5] S. P. Beeby, R. N. Torah, M. J. Tudor, P. Glynne-Jones, T. O’Donnell, C.R. Saha and S. Roy
“Micro electromagnetic generator for vibration energy harvesting”, Journal of
Micromechanics and Microengineering, 17, 1257-1265, 200
[6] C. Saha, T. O’Donnell, H. Loder, S. Beeby and J. Tudor, “Optimization of an
Electromagnetic Energy Harvesting Device”, IEEE Transaction on Magnetics,
Volume 42, No 10, October 2006.
[7] T. O’Donnell, C. Saha, S. Beeby and J. Tudor, “Scaling Effects for Electromagnetic Vibrational
power Generator”, Journal of Microsystem Technology, November, 2006.
[8] P. D. Mitcheson, T. C. Green, E. M. Yeatman and A. S. Holmes, “Architectures for
vibration-driven micro power generators”, IEEE/ASME Journal of
Microelectromechanical System, Vol 13, no. 3, 429-440, 2004.
[9] S. Roundy, P.K. Wright and J. Rabaye, “A study of low level vibrations as a power source
for wireless sensor nodes”, Computer Communication, vol 26, 1131-1144, 2003.
[10] P. Miao, A.S. Holmes, E.M. Yeatman and T.C. Green, “Micro-machined variable
capacitors for power generation”, Department of electrical and electronics
engineering, Imperial college London, UK.
[11] G. Despesse, J.J. Chaillout, T. Jager, J.M. Leger, A. Vassilev, S. Basrour and B. Charlot,
“High Damping Electrostatic System for Vibration Energy Scavenging”, Joint sOc-
EUSAI conference, Grenoble October 2005.
[12] P. Mitcheson, Stark B, P. Yeatman E, Holmes A and Green T, "Analysis and
optimisation of MEMS on-chip power supply for self powering of slow moving
sensors", Proc. Eurosensors XVII.
Sustainable Energy Harvesting Technologies – Past, Present and Future
108
[13] F. Peano and T. Tambosso “Design and optimization of a MEMS electret-based
capacitive energy scavenger” Microelectromechanical Systems, Journal of Volume
14, Issue 3, June 2005 Page(s):429 – 435.
[14]
[15] Transformer and Inductor Design Handbook, Colonel W.T. McLyman, Second Edition,
Marcel Dekker Inc.New York, 1988.
[16] Electromagnetic and Electromechanical machine, Leander W. Matsch, and J. Derald
Morgan, Third Edition, John Wiley and Sons.
[17] Electromechanics and Electric Machines, S. A. Nasar and L.E. Unnewehr, Second
Edition, John Wiley and Sons.
[18] F. Bancel “Magnetic nodes”, Journal of Physic D: Applied physics 32 (1999), 2155-2161.
[19]
[20] John Borwick, Loudspeaker and Headphone Handbook, Focal press, Second edition
[21] P. Glynne-Jones, M. J. Tudor, S. P. Beeby, N.M. White, "An electromagnetic vibration
powered generator for intelligent sensor systems", Sensors and Actuators A, 110 (2004).
[22] X. Zhang and W. C. Tang, “Viscous air damping in laterally driven microresonators”,
IEEE proceedings on MEMS workshop, pp. 199-204, 1994
[23] Thermoelastic damping in micro and nanomechanical systems, R Liftshitz, M Roukes,
Physical Review B, Vol. 61, No. 8, 15 Feb 2000, pp.5600-5609.
[24] Internal friction in solids: 1: theory of internal friction in reeds, C Zener, Physical
Review, Vol. 52, 1937, pp. 230-235.
[25] An analytical model for support loss in micromachined beam resonators, Z Hao, A
Erbil, F Ayazi, Sensors and Actuators A, Vol. 109, 2003, pp. 156-164.
[26] Energy dissipation in sub-micrometer thick single crystal silicon cantilevers, J Yang, T
Ono, M Esashi, J. Micromech. Systems, Vol. 11, No. 6, 2002, pp.775-783.
[27] Andrew D. Dimarogonas, Sam Haddad, Vibration for engineering, Prentice-Hall
International editions, chapter 12, page 605.
[28] R. Scott Wakeland, “Use of electrodynamic drivers in thermo-acoustic refrigerators”,
Journal of Acoustical Society of America, 107(2), February 2000.
[29] Z. Yu, S. Backhaus and A. Jaworski, “Design and testing of a travelling wave looped
tube engine for low cost electricity generators in remote and rural areas”, American
Institute of Aeronautics and Astronautics, 2009.
[30] Ali H. Nayfeh, Dean T. Mook, Nonlinear Oscillation, A Wiley-interscience publication.
[31] T. von Buren, P. Lukowicz and G. Troster , “Kinetic Energy Powered Computing-an
Experimental Feasibility Study”, Proc. 7
th
IEEE Int. Symposium on Wearable
Computer.
[32] T. Starner and J. A. Paradiso, “Human generated power for mobile electronics”, Low
Power Electronics Design, CRC Press, Summer 2004.
[33] Vibrational Energy Scavenging (VIBES), FP6-IST-507911, Deliverable: Application
Analysis and Specification, June 2004.
[34] A. Luzy. 1472335: magneto flash light. US Patent, October 30, 1923.
[35] S. C. Mukhopadhyay, J. Donaldson, G. Sengupta, S. Yamada, C. Chakraborty and D.
Kacprzak, “Fabrication of a repulsive-type magnetic bearing using a novel
arrangement of permanent magnets for vertical-rotor suspension”, IEEE
Transactions on Magnetics, vol. 39, No. 5, September 2003.
[36] N. B. Bharatula, S. Ossevoort, M. Stager, G. Troster, “Towards Wearable Autonomous
Microsystems”, Pervasive computing, proceeding of the 2
nd
international
conference, page 225-237, Vienna, Austria, April 2004.