Wind Energy Management Part 6 pptx
Bạn đang xem bản rút gọn của tài liệu. Xem và tải ngay bản đầy đủ của tài liệu tại đây (644.77 KB, 13 trang )
Wind Energy Management
56
21
mL
im
b
dE
p
sv
(16)
Herein
,,, ,,,
mmL
dEp
and
denote for mechanical and thermal correction factors
for stress super-elevation at branches, mean diameter, mean wall thickness, linear expansion
coefficient, Young’s modulus, Poisson’s ratio and the range of pressure and temperature
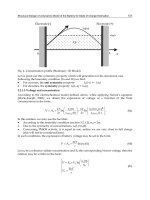
difference during load change, respectively. Fig. 17 shows qualitatively the evaluation of the
working stress during load change. The maximum number of load changes comparable to
the actual one is generated from the Wöhler-curve. The percentile fatigue of the actual load
change is then:
1
100e
N
(17)
Fig. 17. Principle of evaluation of component stress for cyclic loading (Levin et. al, 1990).
This estimation leads to conservative results in order to handle the numerous uncertainties
in calculation of working stresses at complex components and material properties.
This method allows to benchmark different and possible future operation modes in terms of
their level of deterioration to different components. In Fig. 18 is the fatigue of a warm start
and several load changes plotted for the in- and outlet headers of the super- and reheaters. It
should be stated, that currently normal operation is between 50 % and 100 % load with a
ramping rate of 2 % per minute, so the shown load change of higher then 60 % as well as the
load gradients of 4 % per minute could be considered as an unconventional operation. These
load changes corresponds to a possible future operation with a lowered minimum load of
for instance 35 % and a doubled load gradient.
Technical Framework Conditions to Integrate
High Intermittent Renewable Energy Feed-in in Germany
57
Fig. 18. Fatigue of heating surface in- and outlet headers for different base stress situations
It could be obtained, that the outlet header of super heater three and four are affected the
most, whereas the headers of the reheaters are not or low stressed. Furthermore it could be
derived, that conventional load changes less the 50 % barely cause any fatigue, because the
stress levels are below the endurance strength.
Considering the flaw growth of pre-damaged component gives a far more sensitive view on
the operation mode. The Forschungskuratorium Maschinenbau (FKM, 2001) gives guidelines
for the calculation of crack progress. Fig. 19 gives a general overview on crack propagation
rate as function of the range of stress intensity factor
K
.
There is a certain load that does not lead to crack propagation (ΔK ≤ ΔK
th
). In region I to III
there is a stable propagation to be expected (ΔK
th
≤ ΔK ≤ ΔK
c
) which can be conservatively
estimated by the law of Paris and Erdogan:
m
da
CK
dN
(18)
Where a, N, C, m denotes for crack length, number of cycles, a case-specific factor and a load
specific exponent, respectively.
The stress intensity factor has to be calculated depending on the flaw’s geometry and size
and its position within the component. With this tool it is possible to detect the most
strained components by comparing the crack growth over a certain reference time period.
In an analogue manner as in Fig. 18 the flaw propagation is shown for thick-walled headers
in Fig. 20.
In contrast to the fatigue also low stress levels of small load changes cause impairment and
consequently with this estimation a method is given to evaluate the deterioration potential
of load changes during normal operation.
Wind Energy Management
58
Fig. 19. Overview on crack propagation under cyclic load (FKM, 2001)
Fig. 20. Flaw growth in potentially pre-damaged thick-walled in- and outlet headers for
different base stress situations
Technical Framework Conditions to Integrate
High Intermittent Renewable Energy Feed-in in Germany
59
In this way, future demands on power plants which might become necessary in order to
realize wind integration successfully at controllable costs can be benchmarked. Since the
detailed manner of the plant model does not allow long term simulation over years or even
weeks due to high computing time, the fatigue has to be extrapolated by decomposing long
term load schedules to base operation scenarios and adding the individual fatigues and
crack growths under the assumption of linear damage accumulation. In cooperation with
the power plant scheduling model it is possible to evaluate such long term load profiles for
e.g. a heavy wind month.
This aspect of power plant operation management will probably become more important
due to highly increasing wind power production and its fluctuating characteristic.
Furthermore the modular structure of the model allows the easy replacement of single
components, e.g. life steam temperature control, which enables for example the benchmark
of advanced control systems or the implementation of different or additional hardware for
different operation scenarios.
6. Conclusion
In Germany the existing electrical power production and distribution systems are going to
be essentially influenced due to the continuously increasing relevance of renewable energy
sources.
To analyze these intermittent power sources and to simulate the influence onto thermal
power plants, several simulation models can be used. These models can be used to simulate
the power plant scheduling that is necessary to consider technical restrictions of thermal
power plants like operation states, minimum up- and downtimes, minimum power output,
ramping rates, storage capacities etc. Today such models are often formulated as a Mixed-
Integer Linear Programmed (MILP) optimization problem, commonly known as the unit
commitment problem.
With the calculated schedules for each station within the model, the number of load changes
and start-up cycles for the different types of power plants can be determined. These
schedules can be rated in terms of mechanical wear due to thermal stress by a
thermodynamical model that simulates the life time consumption of the different
components used within a hard coal fired power plant with a complex model of the water
steam cycle as well as the mill and boiler components. This model of the thermodynamical
process is controlled by a detailed simulation of the power plant control system.
The renewable energy generation will be the future solution for the global energy
consumption problem. Therefore it is very important to consider all technical restrictions of
the network control and the thermal power plants that are necessary to ensure the safety of
supply.
To investigate the effects of the increasing fraction of renewable energy produced by
intermittent generators like wind turbines and photovoltaic systems within the existing
generation system several models with different time domains are necessary as described in
this chapter. These models can help to evaluate new concepts for power plants in regard to
economical issues and they can help to determine the limitations of a stable system
operation in regard to reduced system inertia.
Wind Energy Management
60
7. References
Arroyo J. M. & Conejo A. J. (2000). Optimal response of a thermal unit to an electricity spot
market, IEEE Trans. Power Sys., vol. 15, no. 3, pp. 1098–1104.
Carrión, M. & Arroyo, J. M. (2006), A Computationally Efficient Mixed-Integer Linear
Formulation for the Thermal Unit Commitment Problem, IEEE Trans. Power Syst, vol.
21, no. 3, pp. 1371-1378.
Delarue E.; Bekaert D.; Belmans R. & D’haeseleer W. (2007). Development of a Comprehensive
Electricity Generation Simulation Model Using a Mixed Integer Programming Approach,
World Academy of Science, Engineering and Technology 28 2007.
Frangioni A.; Gentile C. & Lacalandra F. (2009). Tighter Approximated MILP Formulations for
Unit Commitment Problems, IEEE Trans. on Power Sys., vol. 24, no. 1, pp. 105–113.
Streiffert D.; Philbrick R. & Ott A. (2005). A Mixed Integer Programming Solution for Market
Clearing and Reliability Analysis, IEEE.
Dahl-Soerensen, M.J. & Solberg, B. (2009). Pulverized Fuel Control using Biased Flow
Measurements, IFAC Symposium on Power Plants and Power Systems Control,
Tampere.
Casella, F. & Leva, A. (2005). Object-Oriented Modelling and Simulation of Power Plants with
Modelica, proceedings of 44th IEEE Conference on Decision and Control, and the
European Control Conference, Sevilla.
Casella,C. & Leva,A. (2003). Open Library for Power Plant Simulation: Design and Experimental
Validation, proceedings of 3rd. International Modelica Conference, Linköping
Deutscher Dampfkesselausschuss (2000). Technische Regeln für Dampfkessel (TRD) 301
Berechnung auf Wechselbeanpruchung durch schwellenden Innendruck bzw. durch
kombinierte Innendruck- und Temperaturänderungen. Carl Heymanns Verlag KG
Deutscher Dampfkesselausschuss (2000). Technische Regeln für Dampfkessel (TRD) 508
Zusätzliche Prüfungen an Bauteilen berechnet mit zeitabhängigen Festigkeitswerten, Carl
Heymanns Verlag KG
Forschungskuratorium Maschinenbau (2001). Bruchmechanischer Festigkeitsnachweis für
Maschinenbauteile, VDMA-Verlag
Part 4
Wind Farm Analysis
4
The Design and Implement of Wind Fans
Remote Monitoring and Fault Predicting System
Yao Wanye and Yin Shi
North China Electric Power University
China
1. Introduction
In modern wind power farms, it is imperative to establish a remote monitor system to
monitor the unmanned working process and the fans which working in the bad
environment. Under this remote monitoring system, we realized the supervisory
information of the wind farms, which similar to the SIS of fuel power plant, including:
power forecasting of fans, fault predicting of wind generators and more. This article mainly
introduced the OPC system for data collection, the virtual private network (VPN), the real-
time data base monitoring and fault predicting. If the wind farms have been established
electricity special communication network, we can apply for the special communication
network to transfer data of fans and boost station, which will be more safety and steady. On
the basis of these, the remote monitoring system has the function of fault predicting in
control center. This system has been used in Hebei Construction and Investment New
Energy and Datang new Energy.
2. Preface
Along with the global resources and environment worsening, the development and
utilization of new energy has gotten more attention. While, comparing with traditional
energy sources, wind energy is a clean renewable energy. It is not dependent on fossil
energy, no fuel price risk, and no carbon emissions and other environmental costs. In
addition, the availability of wind energy is widely distributed around the globe. Because of
these unique advantages, wind power has become an important part of sustainable
development in many countries. According to statistical report which Global Wind Energy
Council (Abbreviation GWEC) edited, global wind power generator installed capacity has
reached 158 million kW, the cumulative growth rate has reached 31.9%. To the end of 2009,
worldwide there have been more than 100 countries that involved in wind power
development, among them, there are 17 countries accumulative total installed capacity over
million kilowatts. Large-scale wind power operation will increase uncontrolled power
output, which will generates a lot of pressure for electric power dispatching.
In the wind farms, fans are widely distribution with large amount and they are away from
the monitoring center, working environment is poor. In order to ensure the safe and stable
operation of the wind farms, we need to satisfy the wind power operation requirements,
own better function performance and stability of remote monitoring system to improve the
Wind Energy Management
64
management efficiency. In view of this, the power group increasing highly requirements on
wind farm group management, but at present, the single SCADA system which the fan
manufacturers offered has failed to meet our requirements. With the investment of new
energy, more and more wind farms will be building.
Currently, the wind farm supervisory control and data acquisition (SCADA) system are
provided completely by fan manufacturers, the main problems are shown as follows:
1. Compatibility issues:
There are more than 40 companies engaged in research and development wind
generator, and more companies are developing proprietary fans components or
complete machine. Large-scale wind farm are generally provided by multiple vendors,
the manufacturers of SCADA systems are not compatible, different types of fans lack of
effective monitoring and management studies, it is difficult to unified maintenance and
management.
2. Information development level:
At present, the problems of wind power still concentrate in the reliability of wind
power generation, power prediction, and Security to the grid, etc. In the SCADA
software, the application of information and centralized data collection is still the
degree of showing. It is only available to supply operator real-time data and historical
data without deeper level of information development, such as condition monitoring,
fault diagnosis, operational guidance and so on.
On the basis, this article designs the wind farm remote monitoring and data analysis
system to achieve a variety of fans in different wind farms, and realize wind farm
cluster control and data analysis and fault warning.
2.1 The present situation and the solution of the wind farms remote monitoring
system
First, because the existing wind farms adopt the monitoring system of the different fans of
the manufacturer, the data between the different systems cannot fulfil resource sharing, and
can't meet the needs of remote monitoring. Secondly, the wind farm applied to cluster
control, which will facilitate different fans operating conditions and the output comparing.
Third, the resolving of failure fans began to carry out after the fan malfunction happened,
which is not conducive to run economy of wind farms. So we must build a fault early
warning ways and improve the operation reliability of the wind farms.
Therefore, we are currently using remote monitoring system for wind farms, which refer to
the experience of thermal power project. We have integrated the data that is from different
fan manufacturers, and gathered real-time data of run fans and remote communication of
booster station. It can realize the remote monitoring, data analysis and processing, provides
management with the power plant in the various operating statements, on the basis of this,
we also realize equipment fault diagnosis and life management of funs, wind power
prediction, and other functions.
2.2 The overall program design of system function
The design of the system can be achieved parallel with the existing fan SCADA system,
maintaining data integrity and continuity with kinds of fans running centralized display.
1. The maintenance of the wind resource information
The Design and Implement of Wind Fans Remote Monitoring and Fault Predicting System
65
Wind resource generally includes a number of wind farms, usually displayed in the
map marked.
2. The maintenance of wind farm information
Maintain basic information of wind farms, fan information and electric price in tariff in
a time period.
3. The maintenance of fans information
a. Maintain each fan’s information, and marked on the map.
b. Providing for each class, each wind farm of the standard extension for comparison
when doing technical analysis.
c. Each type of fan fault code table.
4. The maintenance of substation information
It include basic information and the wiring diagram of the wind farm, main transformer,
circuit breakers, high voltage side arrester, reactive power compensation device, booster
station and other equipment.
Remote monitoring system for wind farm should include the following function modules:
real-time data collection and monitoring, remote centralized control, performance statistics
and analysis, fault early warning, life management, output statistics and forecasts, operation
optimization. The functional design should include three levels. First, the underlying data
collection and monitoring, namely: using OPC technology to achieve real-time collection for
fans and booster station, which save in real time / history stored in the database. By the
way, it is shown in web as configuration mode. The second is the upper fault warning
analysis, life management function, which including: equipment failure records, fan
performance comparison, statistics and fan life management. The third level is a fan of the
forecasting and planning, which is on the basis of meteorological data and historical data.
This module can get fan’s model to predict short-term and even medium-term output
forecast for the power grid to provide scheduling support.
The module used to implement specified data collection from existing SCADA systems and
substation system. Base on the Web application technology and Browse/Server(B/S),
when data uploaded to data center, users can access via IE overview of wind resources and
wind farms, an operation status, substation operation, real-time wind data and other
information, real-time operating status of individual fans, all kinds of alarm and fault
information. this feature provide wind farm running status of monitoring real-time power
and other information for leaders, and they can easily check the production of key
information, including core businesses of production management, wind power generation,
booster station operation and so on.
The figure of the physical structure of remote monitoring system of wind power is shown in
figure 1.
Equip each of the wind farms with a front-end computer to collect the information of the
running fans in wind farms and the booster station. The main task of front interface
computer is collecting the data of the monitoring systems which are then organized into
UDP packets, sent to the data repeater through the firewall, and finally stored in the real-
time/historical data server. Develop the function of data cache in front-end computer to
ensure that the data is cached when the link is interrupted while it is able to uplink data
after the link is unblocked. Install redundant database services on the side of group center to
store real-time data and historical data. The 500,000 points real-time\historical database of
Tianren Huadian is chosen as the database. For the traditional fan monitoring system, one
can enter the fan surveillance server (with a public IP) simply through the VPN client and a
Wind Energy Management
66
simple password to monitor and control the operations of fans now, which does not meet
the requirements of information security and must be improved. Cancel public network IP
and all the information exchange with the outside world is to be conducted through a
specified isolation unit. Apply optical fibre communication system to the communication
link we use and a special 2M special line (E1 lines) used to transmit the information of wind
farms is opened for all the wind farms, which in essence ensures the security of information
exchange.
Fig. 1. The physical structure of remote monitoring system of wind power
The data which are lost due to network interruption or other reasons can be amended
through manual labour. For areas with no broadband transmission, or no interconnected
The Design and Implement of Wind Fans Remote Monitoring and Fault Predicting System
67
network, we can export the data on the plant side, and then sent it to the group through
other means to have the data import manually.
The data flow chart of remote monitoring system of wind power is shown as follows:
Fig. 2. The data flow chart of remote monitoring system of wind power
3. Design and development of SCADA system software
The software structure of the system is divided into 3 levels. The bottom level is the site
monitoring software which can complete the site supervision of respective wind farms
independently and is provided by the respective fan manufacturers. The middle level is the
redundant real-time / historical database, which covers the storage of the data of fans and
booster stations. The top level is software application Level, which completes the
programming of plug-in applications and the analysis, processing and prediction of data.
The data level mainly focuses on collecting the operating parameters of wind fields and
storing the data in real-time/historical database, with OPC as the collecting method. The
application level deals with the applications of real-time database intensively, consisting of
business components like business processing service, system authentication service, data
connection service, application management system, etc. Those business components can be
deployed flexibly in accordance with the actual situation. We can either centralize them on
one single computer or choose to deploy them discretely. The chief function of the
presentation level, in which the system and users interact, lies in accomplishing man-
machine interface works like monitoring, operating, system management, etc.
The system adopts the application system structure in which B/S and C/S combine with
each other, which can be configured flexibly according to the actual situation of the scene
and user’s requirements. It adopts application service based on .NET, fulfils system
applications using SVG and XML technology and possesses advantages like easy
maintenance, high efficiency, easy to transplant, etc.
3.1 The design and implementation of OPC interface
In a traditional system, application programs like supervisory control and data acquisition
system (SCADA), human-machine interface (HMI), configuration software, etc.
communicate with field devices through drivers. However, the driver has its own
limitations. Different drivers need to be developed if we want to adapt a device to different
client applications, resulting in duplication of labour. Once the hardware upgrades, the
Wind Energy Management
68
Fig. 3. SCADA software development diagram
Fig. 4. The design of software structure
previously developed drivers should be modified accordingly. Normally drivers take the
form of dynamic link library (DLL), and dynamic data exchange (DDE) is their primary
means for data exchange. However, this approach does not allow the visit of multiple
applications on one device simultaneously.