Sustainable Growth and Applications in Renewable Energy Sources Part 6 doc
Bạn đang xem bản rút gọn của tài liệu. Xem và tải ngay bản đầy đủ của tài liệu tại đây (1.89 MB, 20 trang )
Experiences of Community Wind Electrification
Projects in Bolivia: Evaluation and Improvements for Future Projects
91
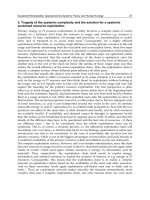
To get the detailed wind map not only from specific points but also for the whole
community, a specific wind simulation software WAsP, The Wind Atlas Analysis and
Application Program, by RISO, were used. This software extrapolates wind data collected
by the anemometer located at a point and calculates the distribution of the wind resource
throughout the surrounding area, considering the height map of the region. The
topographic maps of the area were acquired in the Military Geographic Institute (La Paz,
Bolivia). The energy generated by a wind turbine at each point of the community is also
calculated by WAsP considering the power curves of wind turbines.
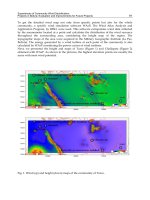
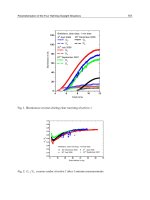
Next, we presented the height and maps of Turco (Figure 1) and Challapata (Figure 2)
obtained with WAsP. As shown in the pictures, the highest elevation points are usually the
areas with most wind potential.
Fig. 1. Wind (up) and height (down) maps of the community of Turco.
Sustainable Growth and Applications in Renewable Energy Sources
92
Fig. 2. Wind (left) and height (right) maps of the community of Challapata.
From the different technological options and according to the result of the wind resource
evaluation, the promoters of the project decided to use wind energy to electrify these
households of the communities (in front of photovoltaic solar systems, for instance).
4. Electrification project description
In 2009, 22 wind turbines were installed, 13 in the municipality of Turco and 9 in Challapata;
in total, 80 people were beneficed. To ensure proper operation and maintenance of systems
throughout the year, only households with permanent residents throughout the year were
electrified.
4.1 Technical description
In Turco, the 13 beneficiaries of the project are grouped in five villages: Iruni, Villacollo
Norte, Villacollo Sur, Huasquiri and Huasquiri Collo with 5, 3, 2, 2 and 1 households,
respectively. In Challapata the 9 beneficiaries are dispersed and only two of them are close
to each other. Given the dispersion of the households, the project promoters decided to
install one individual wind turbine at each household. The chosen were the AIR-X-South
West Windpower, which were distributed by SIE, a Bolivian company which offers the
distribution, installation and maintenance service.
The design of wind systems at each household was carried out taking into account that
turbines operate at a rated voltage of 12 V direct current-CC, and includes the generation
system, regulation (directly incorporated into the wind turbine) and energy storage. The
home system components are as follows:
Generation. It consists of a wind turbine that converts the kinetic energy of wind into
electrical energy.
Regulation. Regulation to avoid over charging the battery is performed by a controller
included in the turbine itself. If necessary, an inverter may be installed to prevent deep
discharge by cutting consumption. However, in these projects, simple controllers that
act as a viewfinder of the state of battery charge were installed.
Storage. The accumulation and storage of electrical energy is done in batteries. Batteries
are loaded when there is generation and discharged to supply power when the
generation is insufficient.
Experiences of Community Wind Electrification
Projects in Bolivia: Evaluation and Improvements for Future Projects
93
Conversion. Inverters are used to convert direct current (coming out of batteries) to
alternating current (which work for most electric devices) to allow the use of
conventional devices, but having a power limit.
Distribution. The electricity is distributed within the household at a nominal voltage
level of 220 V.
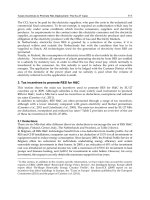
Figure 3 shows a breakdown of the basic outline of individual wind electrification, with
connections between different equipments.
Fig. 3. Configuration of a wind individual electrical system.
4.2 Management model description
A common challenge in isolated electrification systems is to ensure the long-term project, for
instance, in terms of sufficient maintenance and access to spare parts. To reinforce this
challenge, the organizers of the project focused on developing an appropriate "management
model".
The management model is a management tool developed in consensus with all stakeholders
involved in the project, which aims to develop business service structure, and skills and
abilities for the collective and individual sustainability. It contains regulations and
operational rules governing the role of each different actor. Specifically, there is an operator-
manager of the community that is in charge of the maintenance and management of all the
systems. Users pay a monthly fee that goes to a fund for the maintenance of systems and
possible replacements of equipment (batteries, etc.). A committee of users is also formed to
supervise the technical and financial performance. The municipalities and town halls are the
owners of the systems and are responsible for their long term sustainability.
The coordination mechanisms among stakeholders in these projects are:
During the design and development of the project a fluid communication was
guaranteed within a board of directors composed by beneficiaries and technicians
responsible for implementing the planned activities.
Once the installation finished and once the company that installed the systems and
promoter institutions left the communities, the municipality and the town hall became
the responsible of sustainability of the systems. The commitment is embodied in an
agreement to support the management committees in which they agree to take charge
of a consideration when replacing parts of the system (whenever required).
Sustainable Growth and Applications in Renewable Energy Sources
94
Once the project finished, the management committees are required to perform
preventive maintenance and to collect monthly contributions from users. In addition,
each committee has at least one technical operator per municipality, who is also a
beneficiary and each member received additional training which has been provided to
them focusing on equipment maintenance and financial management.
5. Evaluation methodology
The purpose of external evaluation is to determine and assess the degree of progress of the
project in relation to fulfilment of the outcomes of intervention in the implementation period
(2008-2010). This analysis allows to detect the strengths and weaknesses of the project and to
make corrections of the deviations detected, aiming to improve future interventions in the
area. The evaluation team that conducted the evaluation presented in this paper focused
most of his work on analyzing the following main sections:
Real coverage of the project, in terms of direct and indirect beneficiaries, whether
individuals or institutions.
Degree of appropriation of activities by the beneficiaries.
The scope of the intervention at the regional level and the integration of the logical
intervention and complementarities between the different levels.
The degree of impact of the first actions, depending on the time of project
implementation, with special attention to indicators and real achievement.
The effectiveness of tracking and monitoring mechanisms initially planned, and
improvements in relation to the interaction with regional participants throughout the
implementation process.
The level of involvement of local and regional activities planned, as well as the
beneficiaries.
5.1 Evaluation activities
The work consisted of office work and field work. The office work consisted of:
Identification and analysis of available documentation on the context.
Analysis of available information on the interventions to evaluate: formulation of the
project, the technical and economic progress reports, annual programming documents
and sources of verification.
Design of methodological tools for collecting, processing and analyzing information to
ensure the reliability of sources and the rigor and analysis in the field.
Planning of field work and structuring of the surveys.
Design of indicators for the analysis of the evaluation criteria.
Fieldwork was conducted in October 2010 in the municipalities of Turco and Challapata and
essentially consisted of:
Interviews with key officials of the municipalities involved: the Mayor, Council
Members, and the indigenous heads.
Interviews with technicians of the project team.
Semi-structured interviews to members of the Management Committee or
representatives of their organizations according to their customs.
Visit to households of the beneficiaries in order to inspect the installed equipment, and
collect information via surveys to each of the users.
Experiences of Community Wind Electrification
Projects in Bolivia: Evaluation and Improvements for Future Projects
95
The data collected from the surveys was processed and systematized in a database; SPSS
was the information processing computer software used. In the same way, data collected
from interviews was processed and compared providing greater reliability evaluation.
5.2 Definition of the evaluation criteria
The evaluation criteria were defined between the technical and social specialists of the promoter
institutions and the external evaluator team. Criteria were defined before starting to collect
information and results to ensure maximum objectivity. The defined evaluation criteria were:
1. RELEVANCE. This criterion assesses the suitability of the intervention in terms of local
needs. It evaluates whether the proposal is technically valid, solves real problems and is
appropriate to the context in which it is framed.
2. EFFICIENCY. This criterion examines the relationship between enforcement activities
and compliance with the results and the relationship of these with the investment.
3. EFFECTIVENESS. This criterion measures the degree of compliance with the initial
specific objectives of the projects and the actual outcome of the expected benefits to the
beneficiaries.
4. IMPACT. This criterion examines the net effects of the project from a broad perspective,
taking into account all stakeholders, and projects in the medium term.
5. SUSTAINABILITY. This criterion analyses the possibility of consistent positive effects
of the project once the foreign aid ends, taking into account all relevant factors.
6. COHERENCE. This criterion analyses the compatibility between the objectives,
activities and expected results of public policies and recommendations of international
organizations.
7. FACILITIES: This criterion checks the compliance with the Bolivia IBNORCA NB - 1056.
Table 1. summarizes the indicators and related components for each of the criteria.
CRITERIA INDICATORS
COMPONENTS
Relevance
Adequacy of the project
to local needs
Does the intervention correspond to priorities and needs of the
population?
Have the needs of communities changed after the first
identification? What chan
g
es have there been?
Have the actions proposed in the project been able to solve the
problems identified? Have they taken into account the
socioeconomic context?
Adequacy of the project
to local priorities
Which are the priorities of government intervention in the
territory and the sector involved in the project?
Whic
h
are the priority interventions of local government in the
area?
Is the project aligned with the priorities of national and local
g
overnment?
Complement with other
actions
Does the project being completed in a real way in the area?
Are there mecha
n
isms for coordination between different
actors?
Design of the
intervention
Has the project taken into account the views and opinions of
local staff? Which have been the levels of participation of them
in their formulation?
Do the planned activities actually lead to the fulfillment of the
intended outcomes? Is internal logic of the program the best
wa
y
to address the identified problems?
Sustainable Growth and Applications in Renewable Energy Sources
96
CRITERIA INDICATORS
COMPONENTS
Are the results feasible and relevant to the achievement of the
lo
g
ical framework? Are the
y
formulated in terms of impact?
Efficiency
Analysis of the
achievement of
individual results from
realized activities
What was the level of compliance with each of the activities?
What factors facilitated and hindered compliance?
What was the degree of compliance with each
of the results?
What factors facilitated or hindered performance?
Were there an
y
unanticipated results? Which ones?
Analysis of the relationship
between results and
resources invested
What was the relationship between invested resources and
obtained results?
What were the results in relation to time spentlike ?
Analysis of management
in relation to the results
Has the management of staff been adequate? Which was the
commitment of staff with the communities?
Has the project follow-up been adequate? How was the
relationship with the field team?
Effectiveness
Performance analysis of
the specific objectives
What is the level of compliance of the specific ob
j
ectives?
Which factors have facilitated/ impeded the fulfilment of the
specific ob
j
ectives?
Usefulness and
availability of the specific
objectives
Were the benefits of the project well received by the
population? Were there problems to access to these benefits?
What is the perception of utility that people and community
leaders have about the ob
j
ectives of the pro
j
ect?
Impact
Analysis of compliance
of logical framework
Contribution of the project to the achievement of logical
framework
Factors that have facilitated / impeded the project's
contribution to the achievement of lo
g
ical framework
Impacts from a broad
perspective
Project's positive impacts on beneficiaries, on the economic,
environmental, social, and or
g
anizational aspects.
Project's negative impacts on the social, economic,
or
g
anizational and environmental aspects
Unexpected impacts (positive and negative, on all players and
d
y
namics)
Factors and interventions outside the project have been able to
g
enerate positive or ne
g
ative effects on the impacts
Sustainability
Analysis of the possibility
that each of the processes
and their positive impacts
are sustainable
Is there a local government department responsible of the
processes established by the project?
Factors that facilitate /
impede the permanence
of the positive effects
Political factors, Institutional factors, Gender factors, Economic
factors, Technological factors, Other factors
Coherence
Relation with the
strategical policies of
public sector
Do the identified problems correspond to the purposed
objectives?
Facilities
The design of the
facilities meet the
re
g
ulatio
n
The design of the facilities meet the needs of the usersand the
standard IBNORCA NB-1056
Facilities are in
accordance with the
desi
g
n
Facilities are in accordance with the design and standards
Facilities are operating
accordin
g
to desi
g
n
Facilities are operating according to the design
Table 1. Criteria, indicators and assessment components.
Experiences of Community Wind Electrification
Projects in Bolivia: Evaluation and Improvements for Future Projects
97
6. Results of the evaluation
This chapter provides the information, the analysis and the results of the external evaluation
in terms of each of the criteria and carries out global evaluation.
6.1 Relevance
The results of the evaluation confirmed that these projects have made a direct benefit for the
families supplying access to electricity in their households. The field assessment after the
implementation of the project has revealed that electric service has given them the ability to
access telephone communication (cell phones had network coverage only needed electricity
to recharge) and audiovisual media (television, radio, etc.).
However, the degree of satisfaction of the beneficiaries is not for all the same. Some of the
beneficiaries are completely satisfied with the recent access to electricity, whereas others are
only partially satisfied because their expectations were superior to actual performance and
possible uses of electricity. Some of the beneficiaries confirm they use electricity for lighting
and some low power appliances, as it was planned in the logical framework of the project
but, at the same time, they claim that they wish to have more energy for other uses. In
Turco, 6 out of 11 beneficiaries are completely satisfied and 5 are partially satisfied. In
contrast, In Challapata almost all beneficiaries are completely satisfied, 7 out of 8. Among
other factors, the difference is probably due to the difference in wind potential in the
communities; the wind potential available in the Challapata is greater than in Turco, thus,
the same generation equipment generates much more energy.
6.2 Efficiency
The results indicate that the projects justify the investment and that the management of staff
has been adequate. It is noteworthy the commitment of the staff to the beneficiary
communities that was reflected in the interviews. Results of the evaluation confirmed that
the objectivities and results defined in the logical framework of the project were achieved
with an optimal degree of compliance.
However, the short time available to carry out the activities has been identified as a negative
factor. The key aspects that influence and make the time needs critic are:
The fieldwork itself needs a lot of time, in particular due to the remoteness of the
communities. The need of technological and logistic external support and their
availability also constrained the schedule.
In terms of community activities, the communication process that involves speaking
Spanish as well as native language (Quechua, Aymara) requires more time. Moreover,
gaining the confidence and trust of the beneficiaries and overcoming some internal
conflicts in the communities also require dedication and perseverance. The education
and training according to the needs of the community and implementation of
management models must be repeated in a lengthy process to ensure the correct
appropriation.
The coordination with municipal governments, as well as making effective their
economic commitment was also a long process.
However, the only weakness found caused by the short time spent in the project was that
the management committee was concerned about not being self-sufficient to keep
equipment running. Although the interviewees say their organization does work, the correct
Sustainable Growth and Applications in Renewable Energy Sources
98
performance may be threatened by the lack of commitment tools that would help to ensure
the fulfilment of the obligations of the users. In particular, they claim more training and time
for a proper comprehension of the rules of the new organization because the management
committee has no element of coercion to require monthly contributions, and the technical
operator receives no remuneration for his work as inspector. These deficiencies are repeated
in Turco and Challapata but with different intensity.
6.3 Effectiveness
One of the specific objectives of this project aimed to train the users in the maintenance of
wind power systems and organizational management techniques for the sustainability of
the systems. A key point is the emphasis on training and awareness of people through
workshops and seminars. The results of the evaluation confirmed the population received
good training, are aware of the benefits of the project and have a positive perception of
usefulness. Users are also aware of the existence and significance of the management
committee although no regularity when making the respective contributions has been
achieved. These delays have had no negative consequences so far because there have been
no need to replace elements, because the projects have been running for a short time.
In terms of uses of electricity, the beneficiaries use the energy depending on their economic
possibilities to buy electric appliances, from lighting to communication and leisure. The
most noteworthy nightlife activities are spinning, knitting or sewing by women and
schoolwork by children. Table 2 shows the number of users per municipality using different
types of appliances.
Focus TV Radio Cell Phone Battery chargers Others
Turco 11 0 1 10 1 0
Challapata 8 0 4 2 1 0
Table 2. Number of users of each appliance in each community.
6.4 Impact
In terms of the logical framework, the project has largely achieved its objectives and actually
incorporated renewable energy in Turco and Challapata communities as demonstration
projects in Bolivia.
The main factors that facilitated the success were:
Training of all users and technicians from the municipal governments.
The development of management manuals.
The most noteworthy positive impacts of the project are:
Improved quality of life, preserving the environment.
The achievement of an organization to manage the systems designed according to
customs.
From the economic point of view, almost all beneficiaries agree that now with the new
electricity service they spend less money on the provision of electricity than they used to
spend on traditional energy sources (kerosene, candles, etc.). Apart from that, some of them
state they no longer have to breathe smoke like when they used kerosene, burners or
candles. Beneficiaries state they have a solid and consolidated organization, although this is
not directly reflected at the time of monthly contributions.
Experiences of Community Wind Electrification
Projects in Bolivia: Evaluation and Improvements for Future Projects
99
Table 3 shows the qualitative assessment of the changes resulting from the project in the
organizational, economic, social and environmental aspects; it shows the percentage of
beneficiaries that state the changes have been positive, negative or non significant (no
change). The most significant changes occur in the economic area, thanks to a reduction of
costs on energy provision, and in the environmental aspects, by decreasing smoke of
candles, lighters and kerosene lamps.
positive negative no change
Turco
Organizational 100% 0% 0%
Economical 60% 0% 40%
Social 10% 10% 80%
Environmental 100% 0% 0%
Challapata
Organizational 100% 0% 0%
Economical 100% 0% 0%
Social 0% 0% 100%
Environmental 100% 0% 0%
Table 3. Assessment of the changes.
The only negative impact found in the evaluation is that people who are not beneficiaries of
the project are now in an unequal position and feel they are now in a situation of inferiority.
It is noteworthy to remind that only homes with at least one permanent resident throughout
the year were electrified, to ensure proper operation and maintenance.
6.5 Sustainability
The promoters (Engineers Without Borders, CINER and Mosoj CAUSAY), and the
management committees of the projects signed an agreement with the mayors involved in
the projects, where the municipalities assumed to take over the sustainability of actions. The
management committees are afraid of not being self-sufficient to maintain the systems of
electrification (lack of regular payments, technical operator's temporary absence, etc.) and so
the mayors involved agreed to give support and to take over the long term sustainability of
projects. However, changes in the technical and municipal authorities, bureaucracy, lack of
financial resources, lack of continuity in the training of technicians of the municipality and
other stakeholders may hinder the fulfilment of commitments.
Moreover, the future of these systems is contingent on the proper use and proper
maintenance of each of the equipments. The company that installed the wind systems is
committed to maintain and to repair themfor a period of two years. So far, the company
repaired the systems when needed but has taken some time, so some beneficiaries have had
no electricity during weeks or months.
6.6 Coherence
The results of the evaluation confirmed there is a clear coherence between identified
problems in the area and goals of the project. The project has successfully overcome one of
the main problems identified in the area: lack of electricity and reliance on traditional
energy sources (candles, lighters, wood and other fuels). Now beneficiaries say they no
longer breathe smoke (of kerosene or candles), and state they spend less money on energy
supply.
Sustainable Growth and Applications in Renewable Energy Sources
100
In addition, the evaluation confirmed this project is not against any plan, program or policy;
on the contrary, it contributes to the government's obligation to provide basic services to the
population.
6.7 Facilities
The verification of the quality of the facilities is conducted as part of the field work, making
home visits to most users of both Turco and Challapata. To check the correct design and
installation of the facilities, the standard guidance document IBNORCA Bolivian NB 1056
was used. All components were verified in each household, taking into account the data of
the original design. Most equipment was found to be working properly and user feedback
was favourable. Only minor problems were detected which were easily solved (low
batteries, bearing noises, light poles with vertical offset).
6.8 Evaluation and analysis
The rating scales and the weighting of each criterion were discussed and agreed at a
meeting between the evaluation team and CINER and Mosoj Causay. This meeting was held
before the start of the collection and analysis of information to ensure maximum objectivity.
From the analysis of the results of the evaluation and the defined rating scales (1 to 5), each
of the components of each criterion was quantified. The resulting score of each component
of each indicator is shown in the following table (Table 4).
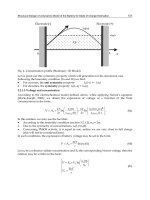
Figure 4 shows the results of the evaluation according to each criterion. The project achieved
an overall weighted evaluation of 89.33%, which corresponds to a qualitative assessment of
"functioning under optimal conditions".
CRITERIA Total Nª
COMPONENT Value
RELEVANCE 4.35
1 Adequacy of the project to local needs expressed 4.33
2 Adequacy of the project to local priorities 3.57
3 Complement with other actions 5
4 Design of the intervention 4.5
EFFICIENCY
4.50
5
Analysis of the achievement of individual results from realized
activities
4.17
6
Analysis of the relationship between results and invested
resources
4.33
7 Analysis of management in relation to the results 5
EFFECTIVENESS 4.67
8 Performance analysis of the Specific Objectives 4.63
9 Usefulness and availability of the Specific Objectives 4.71
IMPACT 4.75
10
Analysis of compliance of the logical framework 5
11
Impacts from a broad perspective 4.5
SUSTAINABILITY
4
12
Analysis of the possibility that each of the processes and their
positive impacts are sustainable
5
13
Factors that facilitate / impede the permanence of the positive
effects and the processes
3
COHERENCE 5 14
Relation with strategic public sector policies 5
FACILITIES 4.33
15
The design of the facilities meet the regulation 4.5
16
Facilities are in accordance with the design 4.5
17
Facilities are operating according to design 4
Table 4. Evaluation of the external evaluation process.
Experiences of Community Wind Electrification
Projects in Bolivia: Evaluation and Improvements for Future Projects
101
1. Relevance: 4.35/5 (weight: 25%)
2. Efficiency: 4.50/5 (weight: 10%)
3. Effectiveness: 4.67/5 (weight: 10%)
4. Impact: 4.75/5 (weight: 15%)
5. Sustainability: 4/5 (weight: 15%)
6. Coherence: 5/5 (weight: 10%)
7. Facilities: 4.33/5 (weight: 10%)
Fig. 4. Results from the multicriteria evaluation.
6.9 Recommendations of use and maintenance
The following recommendations are deduced from the evaluation and are proposed to
proper use and maintenance of systems and to promote long term sustainability:
To facilitate the sustainability of the project, the management was transferred to the
involved municipalities, and should be monitored periodically by these entities. The
mayors should support the preventive maintenance plan for wind turbines and should
include training for users at least once a year, especially to the young.
Management committees in coordination with Installation Company must check the
level of the batteries and the wind systems performance. The maintenance plan for
wind systems must check the status of bearings, the load control system and the
verticality of the poles.
Users must remember that when they buy a radio or TV their power must be
appropriate for the wind systems. The maintenance plan should ensure that the light
output of focus fulfils the standard NB IBNORCA -1056 and users should paint rooms
in white for greater light efficiency.
Batteries must be in a suitable container for efficient and secure use. The municipal
government should provide a battery charger as a backup system for each
community.
Sustainable Growth and Applications in Renewable Energy Sources
102
7. Analysis of alternative designs
Due to the characteristic dispersion of communities, rural electrification projects tend to
install individual systems at each point of consumption, as the cases presented in this paper.
Alternatively, design of a single point of generation and distribution of electricity with
microgrids (Kirubi et al. 2009) has its advantages:
Flexibility in use: energy generation and storage is shared among several users, thus
one or more users can increase their consumption at a specific moment if needed.
Easier integration of future users: new users may be electrified just extending a wire.
Robustness against failure: microgrids facilitate feeding users with more than one
generator. Thus, in case of failure of a generator, energy supply decreases but no user is
completely left without access.
Cost savings: microgrids facilitate to use more powerful equipment, which are
proportionally cheaper.
In particular, the electrification with microgrids in Turco and Challapata would have
avoided some of the problems identified in the assessment:
1. Some users were expecting to have more energy availability. The use of microgrid
generation facilitates the use of more powerful and proportionally cheaper turbines, so
more energy can be generated and supplied with the same investment. Moreover,
higher energy supply scenarios can be considered with lower cost increase.
2. People that do not live permanently in the community were not electrified to avoid
operation and maintenance problems. In systems with microgrids generation
equipment is not installed at each household and, therefore, not living permanently is
not a problem because the maintenance is common and not necessarily the
responsibility of each user.
3. The lack of supply during breakdowns. In case of breakdown of a generator, no user
is completely left without access, so the time taken to repair the system is not that
critic.
7.1 Design models with microgrids
To study the possible use of microgrids in future projects, the electrification options with
microgrids in Turco and Challapata are analysed. Although in both communities most
households are scattered, there are small groups of households close to each other that could
have been electrified with a microgrid.
To optimize the design of these alternatives a Mixed Integer Linear Programming (PLEM)
model (Ferrer-Martí et al., 2011) is used. This model is based on the definition of a set of
parameters (which specify the input data of the problem), variables (which define the
configuration of the solution) objective function (which defines the standard resolution) and
constraints (that specify the set of conditions to be satisfied that the solution is feasible). The
solution of this model determines the point of generation and micro design to minimize
costs, taking into account the demand, the wind resource and power generation equipment
available in the area (cost and technical characteristics).
Next, the parameters, variables, objective function and constraints of this model are briefly
introduced.
Parameters
Demand: Energy and power consumption of each point and days of autonomy.
Experiences of Community Wind Electrification
Projects in Bolivia: Evaluation and Improvements for Future Projects
103
Generation and accumulation: Turbines with built-in controller (type, cost,
maximum operating power, and maximum power generated at one point) and
batteries (type, cost, capacity and discharge factor).
Definition of the network: Distance between points, conductors (types, cost
including the infrastructure, resistance and current carrying capacity), rated
voltage distribution and voltage drop.
Equipment: Inverters (type, cost and power) and meters (cost).
Variables
Equipment: number of each type of equipment installed at each points.
Definition of the network: connections between two points, and energy and power
flow between the two points.
Objective function: To minimize the investment cost considering wind turbines,
batteries, inverters, meters and conductors.
Constraints
Generation and accumulation: Energy and power balances at each point, required
energy capacity in the batteries at each point of generation.
Definition of the microgrid: It establishes the relationship between energy and
power flows and the existence of a conductor between two points, compliance of
maximum voltage drop and maximum intensity, the structure of microgrid (if any)
should be radial.
Equipment. Inverters are installed at the points of generation; the meters are
installed at points of microgrid.
To specifically assess all the advantages of the microgrids, a constraint that forces to form
microgrids to feed the households that were close to each other at each community is
included.
7.2 Results of the design of the projects with microgrids
Next, the data and parameters considered in the generation and study of alternative designs
are summarized. In particular, this experiment considers the use of the equipment installed
in the real projects and more power equipment for their possible use in microgrids that feed
several households.
Demand
Two demand scenarios: the first for a basic consumption (energy 140Wh/day,
power 100W) and the second to promote the development of productive activities
(energy 280Wh/day, power 200W).
2 days of autonomy.
Generation and accumulation
4 types of turbines: Air X, Whisper 100, Whisper 200 and Whisper 500) at a cost of
$1000-$4600 and 550W- 3300W, respectively, by South West Windpower.
Regulators are incorporated into each type of turbine.
3 types of batteries: $240-325 and 150-250Ah capacity discharge 60%.
Microgrids
3 types of conductors: cost $4.05- 4.4 per meter.
220V distribution voltage and a 5% maximum voltage drop.
Equipment
Sustainable Growth and Applications in Renewable Energy Sources
104
1 type of inverter: cost $ 255, power 350W.
1 type of meter: cost $ 50.
Table 5 shows the obtained results. The table is divided into two columns for each demand
scenario and two rows for each municipality. The sub-columns show the obtained results
considering: 1) the individual solution (one generation equipment per household); 2) the
solution with microgrids with one type of wind turbines (the type used in the real projects,
Air X) and 3) the solution with microgrids with 4 types of wind turbines (the type used in
the real projects, Air X, and 3 more powerful ones). The sub-rows present the investment
cost, the difference of the cost of individual generators in the low demand scenario, the total
energy, wind turbines used, the microgrids and the number of users in each one and
number of individual users.
Low Energy Demand
(140Wh/day; 100W)
High Energy Demand
(280Wh/day; 200W)
Individual
Microgrid
(1 w.t.)
Microgrid
(4 w.t.)
Individual
Microgrid
(1 w.t.)
Microgrid
(4 w.t.)
Turco
Total cost [$]
19423 17862 16862 26423 26277 22777
Difference
(%)
- -8,0% -13,2% 36,0% 35,3% 17,3%
Energy
[Wh/day]
4460 4234 4166 6086 6124 6227
Wind
turbine
(type)
13 (Air X)
12 (Air X)
8 (Air X)
2 (Whis.
100)
20 (Air X)
20 (Air X)
7 (Air X)
3 (Whis.
100)
1 (Whis.
200)
Microgrids
(users)
-
1 (4)
1 (3)
2 (2)
1 (4)
1 (3)
2 (2)
-
1 (4)
1 (3)
2 (2)
1 (4)
1 (3)
2 (2)
Individual
users
13 2 2 13 2 2
Challapata
Total cost [$]
14447 13886 13886 16447 16867 15867
Difference
(%)
- -3,9% -3,9% 13,8% 16,8% 9,8%
Energy
[Wh/day]
4641 3381 3381 5185 5196 5161
Wind
turbine
(type)
10 (Air X)
8 (Air X)
8 (Air X) 12 (Air X)
12 (Air X)
9 (Air X)
1 (Whis.
100)
Microgrids
(users)
- 3 (2) 3 (2) - 1 (2) 1 (2)
Individual
users
9 3 3 9 7 7
Table 5. Analysis of the electrification solutions of Turco and Challapata with microgrids.
Experiences of Community Wind Electrification
Projects in Bolivia: Evaluation and Improvements for Future Projects
105
In Turco, in the low demand scenario, the cost of real implemented project, that installed an
individual wind turbine at each household, is $19423. The design with microgrids reduces
the cost by 8% when only one type of wind turbine is available ($19423 vs. $17862); the cost
reduction is higher 13.2% when 4 types and more powerful wind turbines are considered
($19423 vs. $16862). In both solutions one microgrid of 4 households is formed in Iruni,
another of 3 households is formed in Villacollo Norte and 2 microgrids are formed in
Villacollo Sur and Huasquiri.
In the high demand scenario in Turco, the cost of electrification solution increases by 36%
when only individual generators are considered ($19423 vs. $26423). This increase is
significantly reduced to 17.3% when microgrids and 4 types of wind turbines are considered
($19423 vs. $22777); thus, twice energy and power demand only implies a cost increase of
17.3%. The formed microgrids are always the same in all cases.
In Challapata, in the low demand scenario, the cost of real implemented project is $14447.
The design with microgrids reduces the cost by 3.9% ($14447 vs. $13886); 3 microgrids of 2
users each are formed. In the high demand scenario, the cost of electrification solution in
Challapata increases by 13.6% when only individual generators are considered ($14447 vs.
$16447). This increase is reduced to 8.8% when microgrids and four type of wind turbines
are uses ($14447 vs. $15867).
8. Conclusions
This article aims to describe and evaluate two wind generation projects implemented in
Bolivia, in the municipalities of Turco and Challapata, department of Oruro. This multi-
criteria evaluation was conducted when the systems had been running for one year by an
external evaluation team. The results of the evaluation showed that the project has achieved
its main objectives giving a weighted mark 89.33%, which corresponds to a qualitative
assessment of "functioning under optimal conditions." This confirms that renewable energy
is the best choice for access to modern energy in isolated communities.
Among the main strengths of the project s the positive acceptance of the beneficiaries and
access to electricity in remote areas must be highlighted. The main weaknesses of the project
are the bureaucracy that slows down municipal governments and internal conflicts among
beneficiaries. The assessment highlighted limitations in the systems that must be resolved in
future projects, for instance, the training should be extensive in time. The biggest risk is long
term sustainability if the municipalities do not fulfil their commitments.
Furthermore, alternative designs were analyzed with microgrids to improve some of the
drawbacks identified in the assessment: the continuity of supply against breakdowns, supply
of electricity to non-permanent residents and the possible increase in energy supply to cover
more applications. The results recommend taking advantage of microgrids for projects in
future, to feed groups of households, improve the quality of electric service and reduce costs.
9. Acknowledgments
This paper was supported by the Spanish MICINN project ENE2010-15509 and co-financed
by FEDER, by the Centre for Development Cooperation of the Universitat Politècnica de
Catalunya - Barcelona Tech (UPC), by the Agència Catalana de Cooperació al
Desenvolupamentand (ACCD) and by the Agencia Española de Cooperación Internacional
para el Desarrollo (AECID).
Sustainable Growth and Applications in Renewable Energy Sources
106
10. References
Chaureya, A., Ranganathana, M. and Mohanty, P. (2004). Electricity access for
geographically disadvantaged rural communities—technology and policy insights.
Energy Policy, 32, 1693–1705.
Ferrer-Martí, L., Garwood, A., Chiroque, J., Escobar, R., Coello, J, Castro, M. (2010) A
Community Small-Scale Wind Generation Project in Peru. Wind Engineering, 34
(3), p 277–288.
Ferrer-Martí, L., Pastor, R., Capó, G.M. and Velo, E., (2011). Optimizing microwind rural
electrification projects. A case study in Peru. Journal of Global Optimization, 50 (1),
127-143.
IEA (2009) International Energy Agency: World Energy Outlook
Kanagawa, M. and Nakata, T. (2008). Assessment of access to electricity and the socio-
economic impacts in rural areas of developing countries. Energy Policy, 36 (6),
2016-2029.
Kirubi, C., Jacobson, A., Kammen, D.M. and Mills, A., (2009). Community-Based Electric
Micro-Grids Can Contribute to Rural Development: Evidence from Kenya. World
Dev., 37 (7), 1208–1221.
Lew, D.J. (2000). Alternatives to coal and candles: wind power in China. Energy Policy, 28,
271-286.
PDM (2007) Municipal Development Program.
Seitz, M. (2006). Patagonia wind aids remote communities, BBC News, 10 February 2006.
6
Taxes Incentives to Promote Res Deployment:
The Eu-27 Case
José M. Cansino*, María del P. Pablo-Romero,
Rocío Román and Rocío Yñiguez
University of Seville,
Spain
1. Introduction
The share of renewable energy source (RES) in gross final energy consumption was 10.3% in
the European Union (EU-27) in 2008; the remaining 89.7% was covered through the use of
conventional fuels such as natural gas or oil products (Eurostat, 2010). The renewable
energy share in gross final energy consumption was used for the production of heat (5.5%),
electricity (4%) and transport fuels (0.8%).
Deployment of RES contributes to two of the four targets of the EU-27 energy strategy: the
need to reduce primary energy dependency and the stress of demand on primary energy
resources. In addition, the Green House Gas (GHG) abatement due to a more intensive use
of RES contributes to improve the EU-27’s target related to climate change, this being the
fourth target in its energy strategy.
From a legal point of view, The Green Paper (EC 1996), which was the first attempt of
establishing a common policy on renewable energies in the European Union, settled down
the goal of duplicating the contribution of RES in the gross domestic consumption in 15
years. From the year 1996 until the present, the European Union has developed an intense
ruling activity around the promotion of RES.
An important step forward the construction of the Community framework about
harmonized fiscal treatment was the passing of the Directive (EC, 2003/96), that restructures
the community regime about taxation over energy products and electricity.
In order to improve on energy efficiency, the most important EU policies for the households
sector are the EPBD (EP&C, 2010), “The Energy Services Directive (ESD)” (EP&C, 2006) and
“The Eco-design Directive” (EP&C, 2009).
The renewable energy Directive 2009/28/EC covers renewable energy use in three
sectors:
1. Gross final consumption of electricity from renewable energy sources;
2. Gross final consumption of energy from renewable sources for heating and cooling (H
& C); and
3. Final consumption of energy from renewable sources in transport.
IEA (2009) has recently pointed out that part of renewable energies growth is due to strong
policy support. Therefore, policy measures to promote RES are becoming an interesting
issue in its deployment.
Sustainable Growth and Applications in Renewable Energy Sources
108
In November 2010 the Commission presented the new strategy for competitive, sustainable
and secure energy (COM 2010/0639). The communication, named “energy 2020”, fixes the
priorities in the field of energy for the next ten years and the actions that should be
performed to save energy, achieve a competitive market, and guarantee the safety of supply,
promoting at the same time technological leadership.
Focusing on green electricity, RES for Heating and Cooling and its use in transport, this
chapter offers an overview of the main tax incentives that have been implemented to
promote their use by the Member States (MSs) of the EU-27. In a general way, along with
the reduction of investment costs, tax incentives can also be used to make the energy
generated from RES more profitable than that generated by conventional energy sources.
Chapter has been structured as follows. Section 2 analyzes tax incentives to promote green
electricity. Section 3 is dedicated to study the same topic in promoting RES for H & C.
Section 4 focus on the way MSs promote the use of biofuels in transport by using tax
incentives. Finally, section 5 includes a political discussion and main conclusions.
In a summarized way, Section 2 provides a comprehensive overview of the main tax
incentives used in the EU-27 MSs to promote green electricity. Sixteen MSs use tax
incentives to promote green electricity along with other promotion measures as quota
obligations and price regulation. Section 3 shows the main tax incentives used to promote
RES for H&C by EU-27 countries up to 2009. Although subsidies is the most widely used
instrument to promote RES for H&C, twelve MSs have used tax incentives as deductions,
exemptions and reduced tax rates. Section 4 analyses the tax incentives that MSs have used
to reach the target of a share of 5.75 % in final consumption of energy biofuels in transport
in 2010. This is the target fixed by Directive 2009/28/EC. Although green electricity for
transport and hydrogen vehicle are included in the Directive 2009/28/EC framework, this
chapter focuses on the policy measures, mainly those related with taxes, that have been used
to promote the use of biofuels in transport.
2. Tax incentives to promote green electricity
This section provides a comprehensive overview of the main tax incentives used in the EU-
27 MSs to promote green electricity
1
. As stated Cansino et al. (2010), in promoting green
electricity, there are probably no “perfect” fiscal incentives that should be widely applied in
all situations and countries. These incentives are applied simultaneously with other
promotion’s measures, specially quota obligations and price regulation.
In UE-27, seventeen MSs have used fiscal incentives to promote green electricity. Mainly
designed as tax exemptions, rebates on taxes, tax refunds and by applying lower tax rates on
activities promoted. However, not all disposable technologies are always promoted. Table 1
provides an overview of the use of these tax incentives in the EU-27 MSs.
Fiscal incentives in direct taxes are used to promote electricity from RES by seven MSs. Czech
Republic, Belgium, France and Luxembourg use the personal income tax as it allows either tax
deductions or exemptions depending on the source of income and the capacity installed.
1
In this section, in addition to the country-specific information, we have taken into account the country
reports in EREC (2009) titled "Renewable Energy Policy Review", the information obtained from
Bundesministerium für Umwelt, Naturschutz und Reaktorsicherheit (2011), the "Taxes in Europe"
database published by the European Commission (2011) and the paper of Cansino et al. (2010).
Taxes Incentives to Promote Res Deployment: The Eu-27 Case
109
Czech Republic has a total exemption of the tax revenues that the taxpayer obtains coming
from the generation of this type of energy. A similar exemption is also contemplated in the
corporate tax. In Belgium and in France an exemption is allowed in the personal income tax
(on the taxable income) on behalf of the cost of the investment of the system installation PV. In
the French case, the exemptions not only cover the cost of the investment in system PV but
also in the systems with small capacity which use wind energy, hydraulics and biomass.
Luxembourg promotes solar photovoltaic electricity with an exemption from income tax of the
sale of electricity generated by this system and whose capacity is small.
Personal
Income
Tax
Corporate
tax
Property
Tax
VAT
Others
Excise Duty
Exemptions
CCL
Other
Taxes
Belgium
Czech Rep.
Denmark
Finland
France
Germany
Greece
Italy
Luxembourg
Netherlands
Poland
Portugal
Romania
Slovakia
Spain
Sweden
United
Kingdom
Source: Cansino et al. (2010)
Table 1. Fiscal incentives to promote green electricity
Belgium, Greece and Spain allow the deduction of a percentage of the investment made in
systems that generate green electricity from the net tax base in the corporate tax. In the first
two cases, the exemption is allowed by the company that has spent the funds in building the
systems that generate green electricity. In Spain, it is allowed a deduction of a percentage of
the investment that the company carries out in the installation of systems for the green
electricity from the net tax base.
Finally, only Italy and Spain have used property taxes to promote green electricity. In Italy,
municipalities may establish rates lower than 4 per 1000 of ICI (‘Imposta comunale sugli
immobili’) for taxpayers who install or have installed a system of renewable energy to
produce electricity or heat for domestic use. In Spain, municipalities may reduce the IBI,
which is a similar tax to ICI, under specific conditions, up to 50% of the full share of the tax
for real state to promote the establishment of solar energy systems. However, this measure
has been used by few municipalities because are borne by them.
Sustainable Growth and Applications in Renewable Energy Sources
110
Fiscal incentives in indirect, pigouvian and others taxes are used to promote electricity from
RES by twelve MSs. The Value Added Tax is theoretically one of the most suitable indirect
tax to promote renewable energies. However, only three MSs have chosen this tax as an
instrument to boost green electricity: France, Italy and Portugal.
A cut in the Value Added Tax rate has to follow European guidelines about state helps that
favour the environment (EC, 2001) and also has to get the Commission’s authorization in
order to prevent disproportioned effects over competition and economic growth. France
allows a 5.5% reduction when buying basic products related to improvements, changes and
installation in residential buildings that incorporate technology based on solar power, wind
power, hydro-electric power and biomass. Italy charges a reduced tax rate on sales and
services related to wind and solar power generation. There is also a reduced tax on
investments in green electricity distribution networks. Finally, Portugal allows a reduction
in buying systems which generate green electricity.
Electric energy excise duty exemption is the most pervasive measure to encourage the use of
renewable electricity of all. Actually, six MSs use it: Germany, Denmark, Romania, Slovakia,
Sweden and Poland. In general, they use this measure because produces two types of benefits,
known as the double dividend (Goulder, 1995). The first is to preserve the environment and
the second can be obtained in several ways, as a positive impact on employment levels (De
Mooij, 1999). This measure has been also use for reducing the higher prices of production of
this type of energy. In that sense, this type of exemption is being usually applied to biofuels
sales (Bomb et al., 2007; Van Beers, C et al. 2007). Nevertheless, some EU countries have applied
to renewable electricity with the same propose. Fossil fuels and nuclear generations’ benefit of
a competitive advantage with respect to RES because its lower marginal costs than new
renewable technologies and they are able to cope with downward price pressure. Because of
that, taxation is important for decreasing most costs of RES sector, by allowing exemptions,
reductions and accelerated depreciations (Di Domenico, 2006).
In Germany the law provides exemptions to encourage the use of friendly sources of energy
when the electricity is generated exclusively from renewable sources and taken for use from
a power grid. In the same sense, Romania has included an exemption from the payments of
excises duties for energetic products and electricity when the electricity is generated by RES.
is (also) promoted in Slovak Republic renewable energy is promoted through the exemption
of the excise duty on electricity. Finally, the new Polish legislation continues to exempt from
excise duty electricity from RES.
In the other hand, some countries have introduced electricity excise exemptions for
renewable electricity only if they are generated by determinate technology. In Denmark, it is
only exempt for excise duty, the electricity produced by wind, waterpower or solar cell
systems or in a small plant. In Sweden, the electricity produced in a wind power station is
not taxable if it is for own consumption although the electricity surplus might be sold. The
exemption value depends on the consumption area. Also, during a transition period all
wind energy production has been also entitled a tax reduction (environmental bonus).
Some other tax exemptions are used to promote green electricity. In the United Kingdom,
electricity from RES is exempted from the ‘Climate Change Levy –CCL-’, which can
characterize as a typical pigouvian tax. This tax is borne by agents that generate carbon
emissions because it pursues to reduce negative externalities which come from human
activities (Viladrich, 2004). The CCL was forecast to cut annual emissions by 2.5 million tons
by 2010, and forms part of the UK's Climate Change Program.