Advanced Biomedical Engineering Part 7 docx
Bạn đang xem bản rút gọn của tài liệu. Xem và tải ngay bản đầy đủ của tài liệu tại đây (4.05 MB, 20 trang )
Fine Biomedical Imaging Using X-Ray Phase-Sensitive Technique
111
To obtain a quantitative phase map showing the spatial distribution of d
θ
, a sub-fringe
method, such as Fourier transfer (FT) (Takeda et al., 1982) and fringe scanning (FS) (Bruning
et al., 1974), is required. The former method is traditionally used in in vivo observations as it
is used to detect phase shifts from only one interference pattern. The latter method, which
requires multiple interference images to calculate phase shift, has a wide dynamic range of
density and high spatial resolution compared to that of FT. Therefore, this method is
normally used for fine observations of static samples such as formalin-fixed biomedical soft
tissues.
To broaden the scope of X-ray interferometric imaging in biomedical applications such as in
vivo observations, a large-area field of view and suppression of the thermal disturbance
caused by a sample's heat are indispensable. However, the monolithic X-ray interferometer
cannot cope with these requirements because the field of view is limited by the size of the
silicon ingot from which the interferometer was cut, and the sample cannot be set apart from
the optical components of the interferometer due to the geometrical limitations. To
overcome these limitations, a two-crystal X-ray interferometer consisting of two silicon-
crystal blocks each having two crystal wafers has been developed (Fig. 2 (b)) (Becker &
Bonse, 1974). By dividing the crystal block of the interferometer into two blocks, the field of
view can be extended by four times or more. In addition, the distance between the crystal
blocks and the sample can be kept long; the thermal influence, such as deformation of the
crystal wafers caused by the sample's heat, is negligible and can be applied for the
observation of living samples. On the other hand, a relative rotation between the blocks
changes the X-ray phase very sensitively, and therefore rotational stabilization of the
subnano-radian order is necessary for performing fine observations.
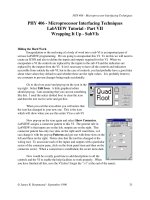
Fig. 2. (a) Monolithic triple Laue-case X-ray interferometer and (b) skew-symmetric two-
crystal X-ray interferometer.
2.2.2 Diffraction-enhanced method
When X-rays pass through a sample, their optical paths (propagation direction) diverge
slightly due to refraction by the sample as shown in Fig. 3(a). This refraction angle, ds, is
given by
=
,
(9)
where d
θ
/dx is the spatial differential of the phase shift. Therefore, phase shift d
θ
can be
obtained by calculating the integral of ds. The ds can be detected using the X-ray diffraction
of the perfect crystal placed downstream of the sample for analyzing. The intensity of the
diffracted X-ray changes depending on the incidence angle to the crystal around the Bragg
Advanced Biomedical Engineering
112
angle, θ
B
, as shown in Fig. 3(b). This curve is called a rocking curve, and its full width at half
maximum (FWHM) is a few arc seconds for a perfect silicon crystal. In addition, the slopes
near the angles θ
L
or θ
H
, where the diffracted intensity is half the maximum, are very steep.
Therefore, the intensity of the diffracted X-ray can be made almost proportional to ds by
adjusting the analyzer crystal to θ
L
or θ
H
. Namely, the crystal functions as an angular
analyzer of the ds, and the ds can be very sensitively detected as changes in the intensity of
the diffracted X-ray.
Fig. 3. (a) Diffraction-enhanced method and (b) diffracted X-ray intensity (rocking curve)
obtained by rotating analyzer crystal (calculation).
To obtain a correct phase map without the effect of the X-ray absorption by the sample,
measurement methods using multiple diffraction images taken at different crystal angles are
required. One measurement method is diffraction-enhanced imaging using two (i.e., “T”)
images (DEIT) (Chapman et al., 1997). The ds is calculated as
ds
(
x,z
)
=
(
,,
)
(
)
(
,,
)
(
)
(
,,
)
(
)
(
,,
)
(
)
,
(10)
where R(θ) is the reflectivity of the analyzer crystal and I is the intensity of the diffracted X-
ray. Only two images are needed, so this method is suitable for quick measurements such as
in vivo observations. However, if the ds is larger than the FWHM of the rocking curve, the
intensity of the diffracted X-ray shows an incorrect value because the angular point on the
rocking curve is far from the peak, where the ds is not proportional to the diffracted
intensity. Therefore, the dynamic range of density of DEIT is not as wide as that of the
method obtained by scanning the analyzer crystal throughout the rocking curve, i.e.,
diffraction-enhanced imaging using many (i.e., “M”) images (DEIM) (Koyama et al., 2004).
The ds in DEIM is calculated as
ds
(
x,z
)
=
∑
(,)
∑
(,)
,
(11)
where
θ
k
is the angle of the analyzer crystal and I
k
is the intensity of the diffracted X-ray at
θ
k
. The scanning angular range depends on the spatial density changes in the sample. For
samples with large spatial density changes, a large range is required to obtain correct
images. A long measurement time is required to obtain the images, but the dynamic range is
not limited by the angular width of the total reflection of the analyzer crystal.
Fine Biomedical Imaging Using X-Ray Phase-Sensitive Technique
113
2.3 Imaging system
2.3.1 Crystal X-ray interferometric imaging (XII) system
A schematic view of an XII system (Yoneyama et al., 2004a; Yoneyama et al., 2005) fitted
with a skew-symmetric two-crystal X-ray interferometer (STXI) is shown in Fig. 4. The
system consists of an asymmetric crystal, an STXI, positioning tables for the STXI, a sample
positioner, and a phase shifter. The imaging system has been set up at beamline BL-14C2 (at
the Photon Factory in Tsukuba, Japan) to use the X-ray synchrotron radiation emitted from a
vertical wiggler. The X-ray is monochromatized by a Si (220) double-crystal monochromator
(not shown), enlarged horizontally by the Si (220) asymmetric crystal, and irradiated onto
the first block of the STXI. One interference image generated by the STXI is taken with the
charge-coupled device (CCD)-based low-noise X-ray imager for detecting the phase map of
the sample. The other image is used in the feedback system stabilizing the X-ray phase
fluctuation. The main specifications of the imaging system are shown in Table 1.
To attain subnano-radian mechanical stability of the STXI for fine observation, the
positioning tables of the STXI are simplified as much as possible, made robust against
vibration, and driven by laminated piezoelectric translator (PZT) actuators. In addition, the
drift rotation is suppressed by the feedback system, which controls the PZT's expansion so
as to cancel the movement of the X-ray interference pattern caused by the drift rotation
between the crystal blocks of the STXI (Yoneyama et al., 2004b). Due to these features,
mechanical stability (standard deviation) within 0.04 nrad was achieved, enabling fine
observations of biomedical samples to be obtained.
Fig. 4. Schematic view of XII system using two-crystal X-ray interferometer.
X-ray imager
STXI
STXI tables
Asymmetric
crystal
X-ray
Sample
PZT voltage
source
PC
Feedback system
X-ray Imager 2
Advanced Biomedical Engineering
114
X-ra
y
ener
gy
17–52 keV
Field of view 60×30 mm at 17 keV; 25×30 mm at 35 keV
S
p
atial resolutio
n
A
pp
rox. 50
μ
m
Density resolution
Approx. 1 m
g
/cm3 for 3D measurement
for 2 hours
Table 1. Main specifications of XII system.
The X-ray imager consists of a scintillator that converts X-rays into visible light, a relay-lens
system that transfers the light from the scintillator to a camera, and a full-frame-type CCD
camera (Momose et al., 2001). The field of view of this imager is 36 × 36 mm, composed of
2048 × 2048 pixels of 18-μm square, and the image-transfer period is about 3 s for a full
image. Gd
2
O
2
S (GOS) was used to fabricate the scintillator. The GOS thickness is 30 μm, and
its absorption ratio is 78 and 20% for 17.8- and 35-keV X-rays, respectively. The CCD camera
is cooled with water instead of an air fan to avoid any mechanical vibration.
A sample is placed in the object beam path using a sample positioner composed of vertical
and horizontal linear tables and a rotational table with the horizontal axis. Each table is
driven by stepping motors operated by remote control. A plastic wedge used as a phase-
shifter is also positioned by another positioner with the same structure as the sample
positioner. Each positioner is attached to rails installed on the frame and can move
perpendicular to the interfering beam so that it can be roughly adjusted and the samples can
be exchanged. The frame stands independently of the STXI table so as to prevent vibration
caused by the motion of the positioner from disturbing the interference.
Interference images for the FS method are taken by scanning the wedge vertically at even
intervals. For 3D observation, the sample is rotated perpendicularly to the beam path for 180
degrees by using the rotational table of the sample positioner. The phase-contrast
tomograms are obtained as follows.
1. Calculate the phase map from the obtained interference images by the FS method.
2. Unwrap the phase map and then generate a sinogram from it.
3. Calculate the tomograms using a filter-back projection with a Shepp-Logan filter (Shepp
& Logan, 1974).
2.3.2 Diffraction-enhanced imaging (DEI) system
A schematic view of a DEI system (Yoneyama et al., 2008) is shown in Fig. 5. The system
consists of an asymmetric crystal, an analyzer crystal, and an X-ray imager. The X-ray
synchrotron radiation emitted from the storage ring is monochromatized and enlarged
horizontally by the Si (220) symmetric crystal in the same way as in the XII system, and it
irradiates the sample directly. The X-ray beam that has passed through the sample is
diffracted by the Si (220) analyzer crystal placed downstream of the sample and is detected
by the same X-ray imager used in the XII system. The main specifications of the DEI system
are shown in Table 2.
X-ra
y
ener
gy
17–70 keV
Field of view 60×30 mm at 17 keV; 8×30 mm at 70 keV
S
p
atial resolutio
n
A
pp
rox. 50
μ
m
Density resolution
More than a few m
g
/cm3 for 3D
measurement for 2 hours
Table 2. Main specifications of DEI system.
Fine Biomedical Imaging Using X-Ray Phase-Sensitive Technique
115
Fig. 5. Schematic view of DEI system using Si (220) diffraction.
The asymmetric and analyzer crystals are mounted on a precise rotational mechanism
consisting of a vertical rotational table and a tilt table. Each table is driven by a stepping
motor remotely, and the rotational resolutions are 0.05 and 8 μrad for horizontal and tilt
rotation, respectively. By using these precise tables, the drift rotation of the analyzer crystal
can be made negligible. The sample is positioned by a sample positioner composed of
vertical linear tables and a rotational table with the vertical axis. For 3D observation, the
sample is rotated vertically for 180 degrees by using the rotational table. The tomograms are
obtained as follows.
1. Calculate the ds map from obtained diffracted X-ray images by using equation (10) or
(11).
2. Calculate the phase map by using
=
(,).
3. Generate a sinogram from the phase map.
4. Calculate the tomograms using a filter-back projection with a Shepp-Logan filter.
2.4 Comparison of imaging performance
Figure 6 shows the phase maps of a formalin-fixed rat liver obtained using (a) XII, (b) DEIT, (c)
DEIM, and (d) conventional radiography (absorption contrast). Each image was 24-mm wide
and 25-mm high. The X-ray energy was set to 17.8 keV, and the total X-ray dose for obtaining
the images was adjusted to remain at the same level by changing the exposure time. The
sample was put in a sample cell filled with formalin to prevent rapid phase shifts caused by a
large density difference between the sample and its surrounding environment. The fringe
number for FS in XII was set at 3, and 11 diffraction images were used for DEIM. Large blood
vessels with a diameter of ~1 mm can be clearly seen in phase maps (a) to (c), but not in (d),
because the phase shift of saline solution injected in blood vessels is different from that of the
surrounding liver tissues (Takeda et al., 2002). Blood vessels with a diameter of less than 100
μm can be seen in (a), but not in (b) and (c). In addition, phase maps (b) and (c) include many
horizontal noise lines caused by the integral calculation of ds along the x-axis (horizontal
direction in the figures). As shown here, the radiographic image quality of XII is better than
that of DEIM and DEIT because DEI has no sensitivity in the vertical direction.
Analyzer crystal
Sample
Asymmetric
crystal
X-ray
RotaƟng
tables
A
n
a
l
y
z
er
c
r
y
s
t
al
Sampl
e
A
s
y
mm
e
t
r
i
c
cr
y
s
t
al
r
a
y
R
o
ta
Ɵ
n
g
t
a
bl
e
s
X-ray imager
y
x
z
Advanced Biomedical Engineering
116
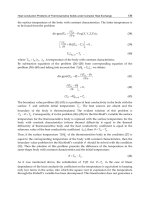
Fig. 6. Phase maps of rat liver obtained using (a) XII, (b) DEIT, (c) DEIM, and (d) conventional
radiography. Large blood vessels with a diameter of ~1 mm can be clearly seen in every phase
map, but blood vessels with a diameter of less than 100 μm can only be seen in (a).
Figure 7 shows 3D images and tomograms of a formalin-fixed rat kidney obtained using (a)
XII, (b) DEIT, and (c) DEIM. The X-ray energy was set at 35 keV, and the X-ray dose was
adjusted to remain at the same level in the same way as in radiographic imaging. The
sample was rotated in the sample cell filled with formalin to decrease artifacts caused by a
large density difference between the sample and its surrounding environment. The image
quality of (a) is better than that of (b) and (c); soft tissues such as blood vessels, medullas,
and cortexes are clearly visible in (a), while the details of tissues cannot be distinguished in
(b) and (c).
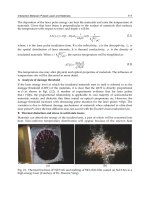
Fig. 7. 3D images and tomograms of rat kidney obtained using (a) XII, (b) DEIT, and (c)
DEIM, with 35-keV X-ray beam. Soft tissues such as blood vessels, medullas, and cortexes
are clearly visible in (a), while only cortexes can be distinguished in (b) and (c).
5 mm
(a) (b) (c) (d)
(a) (b) (c)
Fine Biomedical Imaging Using X-Ray Phase-Sensitive Technique
117
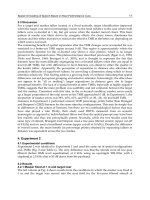
The density resolutions of XII, DEIT, and DEIM for X-ray intensities at the sample position
are shown in Fig. 8. The density resolutions were calculated from the standard deviation of
the relative refractive index in the background regions in each obtained tomogram. The X-
ray energy was set at 35 keV, and typical total exposure times to obtain one data set for one
projection were 1.5, 3, 7.5, 15, and 30 s. To conduct the comparison correctly, the same
phantom consisting of polyethylene tubes filled with saline solution was used with each
imaging system. As expected from the observations of the kidney, this result shows that the
sensitivity of XII was the highest among these methods. In addition, the sensitivity of DEIM
is about one fifth that of DEIT because all the images (including those obtained at the angles
far from the Bragg condition) were used to calculate the ds for a wider dynamic range of
density. Note that images obtained by DEIT and DEIM include many horizontal noise lines
as shown in Fig. 6, and therefore it is thought that the relative difference of the density
resolution between XII and DEIs is larger in 3D observations.
Fig. 8. Density resolution of XII, DEIT, and DEIM at each X-ray intensity.
A 3D image of a formalin-fixed rat tail obtained using DEIM with a 35-keV X-ray beam is
shown in Fig. 9. The bone, disc, and hair are clearly visible. The density between the disc
and the muscle was very different; therefore, the phase shift caused by the tail was too large
and could not be detected correctly using either XII or DEIT. DEIM has lower sensitivity
than the other methods, but it has a wide dynamic range of density and enables observation
of a sample having regions with large differences in density.
3. Application for observation of pathological samples
Current biomedical research commonly uses various imaging techniques, such as X-ray CT,
magnetic resonance imaging (MRI), positron emission tomography (PET), optical imaging,
and supersonic imaging, to visualize the inner structures of objects (Wu & Tseng, 2004;
Weissleder, 2006; Grenier et al., 2009; Hoffman & Grambhir, 2007). Micro-imaging
techniques require high spatial resolution of the micrometer order and high contrast
resolution, especially for basic biomedical research with small animals. For example, micro-
X-ray CT with a conventional X-ray tube has spatial resolution of a few micrometers, but the
contrast resolution is significantly low (Ritman, 2002).
0.1
1
10
100
100 1000 10000 100000
Density resoluƟon [mg/cm]
X ray intensity at sample posiƟon [count/pixel]
XII
DEIT
DEIM
Advanced Biomedical Engineering
118
Fig. 9. 3D images of rat tail obtained using DEIM with 35-keV X-ray beam. Bone, disc, and
hair are clearly visible.
X-ray interferometric imaging clearly depicts minute density differences within biological
objects composed of low atomic number elements. Thus, this imaging technique was
applied to observe biomedical objects, and detailed images that cannot be visualized by
conventional X-ray imaging techniques was obtained. Here, we describe ex-vivo and in-vivo
biomedical images obtained using XII.
3.1 Breast cancer imaging
A conventional X-ray mammogram is obtained as a projection image, and a lower X-ray
energy of 18 keV is used to detect micro-calcification of more than 0.2 mm and soft tissue
mass lesions of more than 2–3 mm. The phase-contrast X-ray imaging technique has high
sensitivity to detect soft tissue lesions and enables the X-ray exposure for the patient to be
decreased. The diagnosis of breast cancer is one of the most important targets of this
technique.
An absorption-contrast X-ray image, phase map, and histological picture stained with
hematoxylin-eosin of an invasive ductal breast cancer specimen are shown in Fig. 10. Breast
tissue and its cancer, which is composed of fat, soft tissue, and micro-calcification, have a
wide density difference. Therefore, to increase the dynamic range of density, a high X-ray
energy of 51 keV was used in interferometric imaging of breast tissue specimens. In the
phase map, the mosaic-like structure of breast cancer is clearly depicted, resembling the
histological picture, whereas in the absorption-contrast image, the cancer and surrounding
breast soft tissue are shown as homogeneous (Takeda et al., 2004c). The signal to noise ratio
of the phase map at 51 keV on soft tissue against surrounding water was approximately 478-
folds higher than that of the absorption X-ray image at 17.7 keV.
The phase map at 51 keV also had an excellent ability to enable differentiation of minute
changes in the soft tissue density and detection of micro-calcifications of 0.036 mm that were
undetected by the absorption-contrast X-ray technique. The phase map of the inner breast
cancer structures matched well with pathological pictures. Therefore, XII might detect an
Hair
Bone
Disc
Skin
Fine Biomedical Imaging Using X-Ray Phase-Sensitive Technique
119
extremely early stage of breast cancer, and thus it could improve the prognosis for the
patient. In addition, the use of 51-keV X-ray energy markedly reduces the X-ray exposure of
the patient. For example, to image a 50-mm-thick object, a 51-keV X-ray dose by XII would
be less than 1/80 of the dose in conventional X-ray mammography.
Fig. 10. (a) Absorption-contrast image, (b) phase map, and (c) pathological picture of 10-
mm-thick formalin-fixed specimen of invasive ductal breast cancer.
3.2 Formalin-fixed colon cancer specimens from nude mice
Imaging of cancer is very important for diagnosis and determining a treatment strategy. In a
conventional X-ray CT image, the absorption differences among cancer, fibrosis, necrosis,
and normal tissues are difficult to detect because the differences in the linear attenuation
coefficients of these tissues are very small. As mentioned earlier, XII enables visualization of
the inner structures of human cancer specimens (Takeda et al., 2000) and animal cancer
specimens (Momose et al., 1996; Takeda et al., 2004d), the brain (Beckmann et al., 1997), and
the kidney (Wu et al., 2009) without contrast agents composed of heavy atomic elements.
Here, we describe the images of cancer specimens obtained using XII at 35-keV X-ray
energy.
The formalin-fixed specimens, approximately 12 mm in diameter, were of colon cancer that
had been implanted in nude mice with a subsequent ethanol injection performed to examine
the therapeutic effect of ethanol. Obtained sectional images clearly depicted the detailed
inner structures of the subcutaneous implanted colon cancer mass, including cancer lesions,
necrosis, mixed changes, surrounding tumor vessels, the subcutaneous thin muscle layer,
subcutaneous tissue, and skin (Fig. 11). Cancer cells underwent necrosis in the central
portion of the cancer mass due to the ethanol injection. In addition, the bulging of cancer
from the thin muscle layer was well demonstrated. The pathological picture well resembled
the phase-contrast sectional image. Thus, pathological information generated by the
difference in density could be detected clearly. This indicates that quantitative evaluation
could be easily performed using XII for new therapeutic applications.
5 mm
(a)
(b)
(c)
Advanced Biomedical Engineering
120
Fig. 11. (a) Phase-contrast X-ray CT and (b) pathological picture of colon cancer implanted in
nude mouse.
3.3 Amyloid plaques in mouse model of Alzheimer’s disease
Alzheimer's disease (AD) is the most common cause of dementia, and it is pathologically
characterized by the deposition of amyloid plaques. Amyloid plaques, composed of densely
aggregated β-amyloid (Aβ) peptides, are believed to play a key role in the pathogenesis of
AD. Therefore, visualization of amyloid plaques is believed important for diagnosing AD. In
this study, the brains from 12 PSAPP mice, an excellent AD model mouse for studying
amyloid deposition, were imaged by XII at 17.8 keV X-ray energy.
Numerous bright white spots having high density were typically observed in the brains of 3
PSAPP mice at the age of 12 months, whereas no spots were depicted in an age-matched
control mouse without the use of contrast agents. An example is shown in Fig. 12 (Noda-
Saita et al., 2006). To confirm the identity of these bright spots, histological studies were
performed after the observation. The bright spots were found to be identical to amyloid
plaques. Finally, we performed quantitative analysis of Aβ spots in the brains of 3 PSAPP
mice each at 4, 6, 9, and 12 months of age. The results showed that the quantity of Aβ spots
clearly increased with age as shown in Fig. 13.
Fig. 12. Amyloid plaque in 12-month old mouse model of Alzheimer’s disease. Identification
of bright spots observed in brain of PSAPP mouse, but age-matched control mouse did not
show such spots. Scale bars = 2 mm.
2 mm
(a)
(b)
White spots
(β-amyloid plaque)
(a) Control mouse brain (b) PSAPP mouse brain
Fine Biomedical Imaging Using X-Ray Phase-Sensitive Technique
121
Fig. 13. Representative 3D images of Aβ spots (orange) in brain (cerebral cortex and
hippocampus) of PSAPP mice at 4, 6, 9, and 12 months old.
3.4 Phase-contrast X-ray CT imaging of live mouse
In-vivo observation of a small animal disease model is very important for establishing a
new diagnostic and/or treatment method in basic clinical research. With the benefit of a
two-crystal interferometer, in-vivo imaging of a mouse implanted with colon cancer was
achieved using the XII system (Takeda et al., 2004). Furthermore, sequential observation
was performed to examine the treatment effect of paclitaxel as a cancer drug (Yoneyama
et al., 2006).
A series of horizontal slice images obtained from a tumor following injection of paclitaxel is
shown in Fig. 13. The tumor size did not change significantly, but the low density area
(necrosis) near the center became larger gradually. A typical 3D image observed during the
second day after cancer drug therapy started is shown in Fig. 14. The tumor was 10 mm in
diameter and ~6 mm thick. The blue area indicates a low-density region and the green area
indicates a high-density region.
These results showed that the phase-contrast X-ray CT enables us to perform detailed
observation with high spatial resolution without harming the target, and therefore ex-
and in-vivo visualization of biomedical objects is believed very useful for biomedical
research.
4 M
6 M
9 M 12 M
Advanced Biomedical Engineering
122
Fig. 14. Series of horizontal slice images of colon cancer and 3D in-vivo phase-contrast X-ray
CT images taken before and after anti-cancer drug therapy started.
4. Application for embryo imaging
Embryos undergo complicated morphogenetic changes during the course of development.
Classically, drawings and solid reconstruction were used to demonstrate the 3D changes
of embryonic structures. The wax plate technique of reconstruction was used for
embryology, and based on the reconstructed models, numerous accurate drawings of
embryos were produced by hand (see Yamada et al., 2006). During the past 20 years,
computer-assisted reconstruction of biological structures has become available, which has
enabled the reconstruction of various 3D structures from serial sectional images. Non-
destructive imaging technologies such as X-ray CT and magnetic resonance (MR)
imaging, which were originally developed as non-invasive diagnostic tools in clinical
medicine, have also been applied to the imaging and 3D reconstruction of tiny biological
structures such as embryos. The MR microscopic technology has been widely used to scan
and visualize relatively small samples, including mammalian embryos (Smith et al., 1996;
Smith, 1999; Haishi et al., 2001; Yamada et al., 2010), but MR microscopy does not yield
resolution or contrast high enough for millimetre-sized embryos. Conventional X-ray CT
was also developed for microscopic observation of small structures, but it is not
appropriate for soft tissues such as embryos.
Sequential images during mouse embryo development obtained by the DEI system are
shown in Fig. 15. By using formalin-fixed mouse embryos, detailed observation of the
internal organs can be made throughout the early to late stages of mouse embryonic
development by tomographs, as well as of the external appearance by surface
reconstruction. The developing bone structures do not affect the phase-contrast images (see
E15.5 and E17.5 in Fig. 15).
2 mm
IniƟal
condiƟon
1st day
2nd day
Fine Biomedical Imaging Using X-Ray Phase-Sensitive Technique
123
Fig. 15. Sequential images of mouse embryo development. Bars = 1 mm.
Embryo images obtained by the XII and DEI systems are shown in Fig. 16. Both systems can
provide fine surface reconstruction and images of the internal structure. Images by the XII
system seem to be better than those of the DEI system for the same embryo, although the
scan time of DEI (1 hr) is much shorter than that of XII (4–5 hrs). The image sharpness can be
affected by the direction of the rotation of the samples. Some precious samples were not
glued directly on the stage but were embedded in agar, which was then fixed on the stage
by an adhesive agent. Therefore, small deformation of the agar by gravity may affect the
images by the XII system.
Fig. 16. Images by XII and DEI systems for E13.5 mouse embryo in Fig. 15. Bars = 1mm.
Surface
reconstrucƟon
SagiƩal plane
Image
E11.5 E13.5 E15.5 E17.5
XII
DEI
Surface
reconstrucƟon
Head Chest Abdomen
Advanced Biomedical Engineering
124
These images show that the phase-contrast X-ray CT has a wide enough field and high
enough resolution for observation and analyses of morphological changes during embryo
development.
5. Conclusion
Phase-contrast X-ray imaging is a novel imaging method using the X-ray phase shift caused
by a sample as image contrast. The sensitivity of the method is much higher than that of the
conventional method using X-ray absorption by the sample. To detect X-ray phase shift,
many detection methods such as X-ray interferometric imaging (XII) and diffraction-
enhanced imaging (DEI) have been developed. XII has the highest sensitivity (density
resolution) and therefore is suitable for observations requiring high density resolution, such
as visualization of β-amyloid plaques. DEI has a wide dynamic range of density and is thus
suitable for observation of samples including regions with large differences in density, such
as bone and soft tissues. Many fine observations of pathological soft tissues and mice
embryos were performed by selecting the most suitable imaging method. The results show
that phase-contrast X-ray imaging enables us to perform fine observation of biomedical and
organic samples without extreme X-ray exposure or any supplemental agents.
6. Acknowledgments
We thank Dr. Y. Hirai of Saga Light Source, Dr. Y. Shitaka, Dr. K. Noda-Saita, Dr. N. Amino,
Dr. M. Mori, and Dr. M. Kudoof of Astellas Pharma Inc. for experimental help and advice.
We also thank Dr. K. Hyodo of the Photon Factory for his technical assistance at the beam
line. The observations were carried out under Proposal Nos. 2002S2-001, 2005S2-001, and
2009S2-006 approved by the High Energy Accelerator Research Organization.
The experiment was approved by the Ethics Committee of the University of Tsukuba for the
human sample, and the Medical Committee for the Use of Animals in Research of the
University of Tsukuba and the Animal Ethical Committee of Astellas Pharma Inc. It
conformed to the guidelines of the American Physiological Society for animal experiments.
7. References
Ando, M., Sugiyama, H., Kunisada, T., Shimao, D., Takeda, K., Hashizume, H., & Inoue, H.
(2004). Construction of X-ray dark-field imaging with a view size of 80 mm square
and first visualization of human articular cartilage of femoral head under a nearly
clinical condition. Jpn. J. Appl. Phys., 43, L1175-L1177
Becker, B. P. & Bonse, U. (1974). The skew-symmetric two-crystal X-ray interferometer. J
Appl. Cryst., 7, 593–598.
Beckmann, F., Bonse, U., Busch, F., & Gunnewig, O. (1997). X-ray microtomography using
phase contrast for the investigation of organic matter. J. Comput. Assist. Tomogr., 21,
539–553.
Bonse, U. & Hart, M. (1965). An X-ray interferometer. Appl. Phys. Lett., 6, 155–156.
Bruning, J. H., Herriott, D. R., Gallagher, J. E., Rosenfeld, D. P., White, A. D., & Brangaccio,
D. J. (1974). Digital wavefront measuring interferometer for testing optical surfaces
and lenses. Appl. Opt., 13, 2693–2703.
Fine Biomedical Imaging Using X-Ray Phase-Sensitive Technique
125
Chapman, D., Thomlinson, W., Johnston, R. E., Washburn, D., Pisano, E., Gmur, N., Zhong,
Z., Menk, R., Arfelli, F., & Sayers, D. (1997). Diffraction enhanced x-ray imaging.
Phys. Med. Biol., 42, 2015–2025.
Connor, M. D., Benveniste, H., Dilmanian, F. A., Kritzer, M. F., Miller M. L., & Zhong, Z.
(2009). Computed tomography of amyloid plaques in a mouse model of
Alzheimer's disease using diffraction enhanced imaging. Neuroimage, 46, 908–914.
Davis, T. J., Gao, D., Gureyev, T. E., Stevenson, A. W., & Wilkins, S. W. (1995). Phase
contrast imaging of weakly absorbing materials using hard X-rays. Nature, 373,
595–598.
Donath, T., Pfeiffer, F., Bunk O., Grünzweig, C., Hempel, E., Popescu, S., Vock, P., & David,
C. (2010). Toward clinical X-ray phase-contrast CT: Demonstration of enhanced
soft-tissue contrast in human specimen, Investigative Radiology, 45, 445–452.
Grenier, N., Sardanelli, F., Becker, C. D., Walecki, J., Sebag, G., Lomas, D. J., & Krestin, J. P.
(2009). Development of molecular imaging in the European radiological
community, European Radiology, 13, 655–656.
Haishi, T., Uematsu, T., Matsuda, Y., & Kose, K. (2001). Development of a 1.0 T MR
microscope using a Nd-Fe-B permanent magnet. Magn. Reson. Imaging, 19, 875–880.
Hoffman, J. M. & Gambhir, S. S. (2007). Molecular imaging: the vision and opportunity for
radiology in the future. Radiology, 244, 39–47.
Ingal, V. N. & Beliaevskaya, E. A. (1995). X-ray plane-wave topography observation of the
phase contrast from a non-crystalline object. J. of Physics D, 28, 2314–2317.
Koyama, I., Hamaishi, Y., & Momose, A. (2004). Phase tomography using diffraction
enhanced imaging. AIP Conference Proceedings, 705, 1283–1286.
Mollenhauer, J., Aurich, M. E., Zhong, Z., Muehleman, C., Cole, A. A., Hasnah, M., Oltulu,
O., Kuettner, K. E., Margulis, A., & Chapman, L. D. (2002). Diffraction-enhanced X-
ray imaging of articular cartilage. Osteoarthritis and Cartilage, 10, 163–171.
Momose, A. & Fukuda, J. (1995). Phase-contrast radiographs of nonstained rat cerebellar
specimen. Med. Phys., 22, 4, 375–380.
Momose, A. (1995). Demonstration of phase-contrast x-ray computed tomography using x-
ray interferometer. Nucl. Inst. and Meth. in Phys. Research A, 352, 622–628.
Momose, A., Takeda, T., Itai, Y., & Hirano, K. (1996). Phase-contrast x-ray computed
tomography for observing biological soft tissue. Nature Med., 2, 473–47.
Momose, A., Takeda, T., Yoneyama, A., Koyama, I., & Itai, Y. (2001). Wide-area phase-
contrast X-ray imaging using large X-ray interferometers. Nucl. Instrum. Meth.,
A467-468, 917–920.
Momose, A., Kawamoto, S., Koyama, I., Hamaishi, Y., Takai, K., & Suzuki, Y. (2003).
Demonstration of X-ray Talbot interferometry. Jpn. J. Appl. Phys., 42, L866-L868.
Momose, A., Yashiro, W., & Kuwarara, H. (2009). Grating-based X-ray phase imaging using
multiline X-ray source. Jpn J. of Appl. Phys., 48, 076512.
Noda-Saita, K., Yoneyama, A., Shitaka, Y., Hirai, Y., Terai, K., Wu, J., Takeda, T., Hyodo, K.,
Osakabe, N., Yamaguchi, T., & Okada M. (2006). Quantitative analysis of amyloid
plaques in a mouse model of Alzheimer’s disease by phase-contrast X-ray
computed tomography. Neuroscience, 138, 1205–1213.
Advanced Biomedical Engineering
126
Oltulu, O., Zhong, Z., Hasnah, M., Wernick, N. M., & Chapman, D. (2003). Extraction of
extinction, refraction and absorption properties in diffraction enhanced imaging.
Journal of Physics D, 35, 2152–2156.
Pisano, E. D., Johnston, R. E., Chapman, D., Geradts, J., Iacocca, M. V., Livasy, C. A.,
Washburn, D. B., Sayers, D. E., Zhong, Z., Kiss, M. Z., & Thomlinson, W. C. (2000).
Human breast cancer specimens: Diffraction-enhanced imaging with histological
correlation-improved conspicuity of lesion detail compared with digital
radiography. Radiology, 214, 895–901.
Rigon, L., Arfelli, F., & Menk, R. H. (2007). Three-image diffraction enhanced imaging
algorithm to extract absorption, refraction, and ultra small-angle scattering, Appl.
Phys. Lett., 90, 11, 114102.
Ritman E. L. (2002). Molecular imaging in small animals—roles for micro-CT. Journal Cellular
Biochemistry Supplement, 39, 116–124.
Smith, B. R., Linney, E., Huff, D. S., & Johnson, G. A. (1996). Magnetic resonance microscopy
of embryos. Comput. Med Imaging Graph, 20, 483–490.
Smith, B. R., Huff, D. S., & Johnson, G. A. (1999). Magnetic resonance imaging of embryos:
an Internet resource for the study of embryonic development. Comput. Med Imaging
Graph, 23, 33–40.
Snigirev, A., Snigirev, I., Kohn, V., Kuznetsov, S., & Schelokov, I. (1995). On the possibilities
of x-ray phase contrast microimaging by coherent high-energy synchrotron
radiation. Rev. Sci. Instrum., 66, 5486–5492.
Sunaguchi, N., Yuasa, T., Huo, Q., Ichihara, S., & Ando, M., (2010). X-ray refraction-contrast
computed tomography images using dark-field imaging optics. Appl. Phys. Lett., 97,
15, 153701.
Takeda, M., Ina, H., & Kobayashi, S. (1982). Fourier-transform method of fringe pattern
analysis for computer-based topography and interferometry. J. Opt. Soc. Am., 72,
156–160.
Takeda, T., Momose, A., Itai, Y., Wu, J., & Hirano, K. (1995). Phase-contrast imaging with
synchrotron X-rays for detecting cancer lesions. Acad. Radiol., 2, 799–803.
Takeda, T., Momose, A., Hirano, K., Haraoka, S., Watanabe, T., & Itai, Y. (2000). Human
carcinoma: Early experience with phase-contrast X-ray CT image with synchrotron
radiation: Comparative specimen study with optical microscopy. Radiology, 214,
298–301.
Takeda, T., Momose, A., Wu, J., Yu, Q., Zeniya, T., Lwin, T. T., Yoneyama, A., & Itai, Y.
(2002). Vessel imaging by interferometric phase-contrast x-ray technique.
Circulation, 105, 1708–1712.
Takeda, T., Wu, J., Tsuchiya, Y., Lwin, T. T., Yoneyama, A., Itai, Y., & Itai, Y. (2004a). Vessel
imaging by interferometric phase-contrast x-ray technique. Proc. of 3rd Congress on
Heart Disease, 105, 143–146.
Takeda, T., Yoneyama, A., Wu, J., Lwin, T. T., Tsuchiya, Y., & Hyodo, K. (2004b). In-vivo
imaging of cancer implanted in nude mice by two-crystal interferometer-based
phase-contrast X-ray CT. Jpn. J. Appl. Phys., 43, L1144-1146.
Fine Biomedical Imaging Using X-Ray Phase-Sensitive Technique
127
Takeda, T., Wu, J., Tsuchiya, Y., Yoneyama, A., Lwin, T. T., Aiyoshi, Y., Zeniya, T., Hyodo,
K., & Ueno, E. (2004c). Interferometric X-ray imaging of breast cancer specimens at
51 keV X-ray energy. Jpn. J. Appl. Phys., 43, 5652–5656.
Takeda, T., Wu, J., Tsuchiya, Y., Yoneyama, A., Lwin, T. T., Hyodo, K., & Itai, Y. (2004d).
Interferometric phase-contrast X-ray CT image of VX2 rabbit cancer at 35 keV X-ray
energy. AIP Conference Proceedings, 705, 1328–1331.
Weissleder, R. (2006). Molecular imaging in cancer. Science, 312, 1168–71.
Weitkamp, T., Diaz, A., & David, C. (2005). X-ray phase imaging with a grating
interferometer. Optics Express, 13, 6296–6304.
Wernick, M. N., Wirjadi, O., Chapman, D., Zhong, Z., Galatsanos, N. P., Yang, Y., Brankov,
J. G., Oltulu, O., Anastasio, M. A., & Muehleman, C. (2003). Multiple-image
radiography. Phys. Med. Biol., 48, 23, 3875–3895.
Wilkins, S. W., Gureyev, T. E., Gao, D., Pogany, A., & Steven, A. W. (1996). Phase-contrast
imaging using polychromatic hard X-rays. Nature, 384, 335–338.
Wu, J. C., Tseng, J. R., & Gambhir, S. S. (2004). Molecular imaging of cardiovascular gene
products. J. Nucl. Cardiol., 11, 491–505.
Wu, J., Takeda, T., Lwin, T. T., Momose, A., Sunaguchi, N., Fukami, T., Yuasa, T., &
Akatsuka, T. (2009). Imaging renal structures by X-ray phase-contrast
microtomography. Kidney International, 75, 945–951.
Yamada, S., Uwabe, C., Nakatsu-Komatsu, T., Minekura, Y., Iwakura, M., Motoki, T.,
Nishimiya, K., Iiyama, M., Kakusho, K., Minoh, M., Mizuta, S., Matsuda, T.,
Matsuda, Y., Haishi, T., Kose, K., Fujii, S., & Shiota, K. (2006). Graphic and movie
illustrations of human prenatal development and their application to
embryological education based on the human embryo specimens in the Kyoto
collection. Dev. Dyn., 235, 468–477.
Yamada, S., Samtani, R. R., Lee, E. S., Lockett, E., Uwabe, C., Shiota, K., Anderson, S. A., &
Lo, C. W. (2010). Developmental atlas of the early first trimester human embryo.
Dev. Dyn., 239, 1585–1595.
Yoneyama, A., Momose, A., Seya, E., Hirano, K., Takeda, T., & Itai, Y. (1999). Operation of a
separated-type X-ray interferometer for phase-contrast X-ray imaging. Review of
Scientific Instruments, 70, 4582–4586.
Yoneyama, A., Momose, A., Koyama, I., Seya, E., Takeda, T., Itai, Y., Hirano, K., & Hyodo,
K. (2002). Large-area phase-contrast X-ray imaging using a two-crystal X-ray
interferometer. Journal of Synchrotron Radiation, 9, 277–281.
Yoneyama, A., Takeda, T., Tsuchiya, Y., Wu, J., Lwin, T. T., Koizumi, A., Hyodo, K., & Itai,
Y. (2004a). A phase-contrast X-ray imaging system—with a 60×30 mm field of
view—based on a skew-symmetric two-crystal X-ray inteferometer. Nucl. Inst. and
Meth. in Phys. Research A, 523, 217–222.
Yoneyama, A., Takeda, T., Tsuchiya, Y., Wu, J., Lwin, T. T., & Hyodo, K. (2004b). Large-area
phase-contrast X-ray imaging system using a two-crystal X-ray interferometer—
development of an interference-pattern-based feedback positioning system. AIP
Conference Proceedings, 705, 1299–1302.
Advanced Biomedical Engineering
128
Yoneyama, A., Takeda, T., Tsuchiya, Y., Wu, J., Lwin, T. T., Hyodo, K., & Hirai, Y. (2005).
High-energy phase-contrast X-ray imaging using a two-crystal X-ray
interferometer. J. Synchrotron Rad., 12, 534–536.
Yoneyama, A., Amino, N., Mori, M., Kudoh, M., Takeda, T., Hyodo, K., & Hirai, Y. (2006).
Non-invasive and time-resolved observation of tumors implanted in living mice by
using phase-contrast X-ray computed tomography. Jpn. J. Appl. Phys., 45, 1864–
1868.
Yoneyama, A., Wu, J., Hyodo, K., & Takeda, T. (2008). Quantitative comparison of imaging
performance of X-ray interferometric imaging and diffraction enhanced imaging.
Med. Phys., 35, 4724–4734.
Yoneyama, A., Takeda, T., Yamazaki, T., Hyodo, K., & Ueda, K. (2010). High-energy
diffraction-enhanced X-ray imaging, AIP Conference Proceedings, 1234, 477–480.
8
Diffusion of Methylene Blue in Phantoms of
Agar Using Optical Absorption Techniques
Lidia Vilca-Quispe, Alejandro Castilla-Loeza,
Juan José Alvarado-Gil and Patricia Quintana-Owen
Centro de Investigación y de Estudios Avanzados del IPN, Unidad Mérida
Mérida,Yucatán
México
1. Introduction
Diffusion of substances in tissue is an extremely complex process. Various phantoms have
been proposed as a model to simulate biological organs and to study physicochemical effects
on the human body. Low concentration aqueous agar phantoms systems are specially suited
for this purpose (Madsen et al., 2005), because they resemble the desired tissue, and are
inexpensive to prepare (Bauman et al., 2004). Recently, they have been suggested for the study
of the treatment of neurodegenerative diseases of the central nervous system (CNS) by
implantation of nanoreservoirs, for controlled drug release into the brain (Staples et al., 2006).
A variety of experimental methods have been developed for the study of drug diffusion
phenomena in such a complex system. Methylene blue can be used to monitor the diffusion
processes inside a gel-like material to simulate the actual process that takes place in the living
tissue, since the size of this molecule is similar to that of some chemotherapeutic drugs
(Buchholz et al., 2008). Methylene blue is a heterocyclic aromatic chemical compound with the
molecular formula C
16
H
18
N
3
SCl, a scheme of the molecule is shown in Figure 1. Additionally,
methylene blue is a molecule that has played important roles in microbiology and
pharmacology. It has been widely used to stain living organisms, to treat methemoglobinemia,
and recently it has been considered as a drug for photodynamic therapy (Tardivo et al., 2005).
This compound shows in-vivo activity against several types of tumors, when locally injected
and illuminated with read laser light (Tardivo et al., 2005). Orth and coauthors have
demonstrated that intratumoral injection of 1% methylene blue followed by illumination by an
argon-pumped dye laser, was able to kill xenotransplanted tumors in animals and recurrent
esophageal tumors in patients (Orth et al., 1998).
Fig. 1. Molecular structure scheme of the methylene blue.
Advanced Biomedical Engineering
130
Various techniques have been developed to study this kind of process using microscopy,
optical techniques, electrical analysis, etc. (Bauman et al., 2004). For the experimenter it is
always important to have access to new, simple, and reliable methodologies. Optical
techniques have been also used successfully to study diffusion processes (Almond & Patel,
1996). These techniques are in general based in the study of light transmission at a fixed
height of a sample column or illuminating the whole column to detect the change of the
system. In this case, the results have been interpreted as a consequence of variations in the
optical properties of the system. Photoacoustic effect has been demonstrated to be a useful
tool for materials characterization, and in the study of diverse phenomena (Almond & Patel,
1996; Mandelis, 1993; Vargas & Miranda, 1988). Photoacoustics have been also used recently
in the study of the evolution of dynamic systems, such as oxygen release in plants, blood
sedimentation, evaporation of liquids, etc. (Acosta et al., 1996; Frandas et al., 2000; Landa et
al., 2003; Martinez-Torres & Alvarado-Gil, 2007). The photoacoustic (PA) signal is not only
directly related to the time evolution of the optical and thermal properties, but also with
various physical processes leading to modulated heat and additional changes in the
geometry of the sample (Bialkowski, 1996). The PA technique is based on the periodic
heating of a sample illuminated with modulated optical radiation. In a gas-microphone
configuration, the sample is in contact with the gas-tight cell. In addition to a steady-state
temperature gradient, a thermal wave in the material couples back to the gas around the
sample and this will result in a periodic fluctuation of the temperature of a thin layer of gas,
close to the sample surface. This thin layer of gas will act as an acoustic piston, which will
result in the production of a periodic pressure change in the cavity. A sensitive microphone
coupled to the sample chamber can be used to detect this pressure fluctuation.
In this work the diffusion of an aqueous solution of methylene blue into an agar gel using a
novel optical technique and photoacoustic spectroscopy are presented. The optic study was
performed illuminating with a laser a transparent tube containing the sample of agar,
simultaneously the data acquisition of the transmission is done using eight photodiodes.
This technique allows measuring the diffusion of methylene blue into the agar as a function
of the position and time. Additionally, the diffusion process is monitored applying the
photoacoustic technique using a modified Rosencwaig photoacoustic cell (Fernelius, 1980;
Quimby & Yen, 1980), in which the sample is illuminated with a modulated red laser beam
at a fixed frequency (Teng & Royce, 1980; Wetsel & McDonald, 1977). For both techniques,
simple theoretical analyses allow the determination of the evolution of the effective optical
properties. The stabilization time of the process, is presented, and it is shown that the
characteristic time, in which the dye diffusion process stabilizes, increases with the agar
concentration.
2. Materials and methods
2.1 Materials preparation
Samples were prepared using agar powder (BD Bioxon hygroscopic bacteriologic agar) and
17.4 MΩ.cm of de-ionized water. The following agar powder concentration in water is used
for the optical analysis [100 × mass of agar powder / (mass of agar powder + mass of
water)] and fixed at 0.1 %, 0.2 %, 0.3 %, 0.4 % and 0.5 % mass/volume (w/v) and for
photoacoustic technique measurement 0.01 % and 0.05 % mass/volume (w/v), were
analyzed. This difference is due to the size of the agar column analyzed in each case. Optical
measurements were made in containers much larger than the ones used in photoacoustics.