Aeronautics and Astronautics Part 2 ppt
Bạn đang xem bản rút gọn của tài liệu. Xem và tải ngay bản đầy đủ của tài liệu tại đây (4.26 MB, 40 trang )
Plasma Flow Control
29
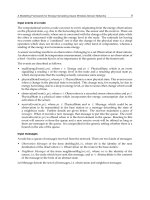
Fig. 10. Electrical characteristics of arc discharge
3. Subsonic plasma flow control
Surface dielectric barrier discharge was proved effective in subsonic plasma flow control. A
great number of papers devoted to subsonic plasma flow control have appeared in the past
ten years. The use of dielectric barrier discharge for flow control has been demonstrated in
many applications. Examples include boundary layer acceleration, transition delay, lift
augmentation on wings, separation control for low-pressure turbine blades, jet mixing
enhancement, plasma flaps and slats, leading-edge separation control on wing sections,
phased plasma arrays for unsteady flow control, and control of the dynamic stall vortex on
oscillating airfoils.
3.1 Airfoil flow separation control
More than 70% lift force of aircraft is produced by wings. The lift-to-drag ratio and stall
characteristic of the wing is of vital importance to the takeoff distance and climbing speed
and the flight quality of the aircrafts. In order to enhance the manoeuvrability and flexibility
of the aircrafts, large angle of attack is used frequently. New technology should be
employed into the development of aircrafts of the next generation. Active flow control
technologies are considered to be the most promising technology in the 21
th
century.
3.1.1 Flow separation control using microsecond and nanosecond discharge
Flow separation control by microsecond and nanosecond discharge plasma aerodynamic
actuation was presented. The control effects influenced by various actuation parameters
were investigated.
Aeronautics and Astronautics
30
The airfoil used was a NACA 0015. This shape was chosen because it exhibits well-known
and documented steady characteristics as well as leading-edge separation at large angles of
attack. The airfoil had a 12 cm chord and a 20 cm span. The airfoil was made of Plexiglas.
Twelve pressure ports were used to obtain the pressure distribution along the model
surface. Fig. 11 shows location of the pressure ports on the model's surface. Three pairs of
plasma aerodynamic actuators were mounted on the suction side of the airfoil. The
actuators were positioned 2% and 20% and 45% cord length of the airfoil. The plasma
aerodynamic actuators were made from two 0.018mm thick copper electrodes separated by
1mm thick Kapton film layer. The electrodes were 4mm in width and 120mm in length.
They were arranged just in the asymmetric arrangement. A 1mm recess was molded into the
model to secure the actuator flush to the surface. The pressure distribution along the airfoil
surface was obtained by a Scanivalve with 96 channels having a range of ±11 kPa. A pitot
static probe was mounted on the traversing mechanism. This was located at different
positions downstream of the airfoil, on its spanwise centerline. Discrete points were
sampled across the wake to determine the mean-velocity profile. The uncertainty of the
measurement was calculated to be less than 1.5%.
Fig. 11. A schematic of NACA 0015 airfoil with dielectric barrier discharge plasma
aerodynamic actuator
The power supply used for microsecond discharge is 0-40 kV and 6-40 kHz, respectively.
The output voltage and the frequency range of the power supply used for nanosecond
discharge are 5-80 kV and 0.1-2 kHz, respectively. The rise time and full width half
maximum (FWHM) are 190ns and 450ns, respectively.
The plasma aerodynamic actuation strength, which is related to the discharge voltage, is an
important parameter in plasma flow control experiments. The flow control effects
influenced by discharge voltage were investigated. Flow separates at the leading edge of the
airfoil without discharge. The pressure distribution has a plateau from leading edge to
trailing edge which corresponds to global separation from the leading edge. When the
microsecond discharge voltage is 13 kV and 14 kV, the flow separation can not be
suppressed. As the microsecond discharge voltage increases to 15 kV, the actuation intensity
increases and the flow separation is suppressed. There is a 34.0% lift force increase and a
25.3% drag force decrease when the discharge voltage is 15 kV. When the millisecond
discharge voltage increases to 16 kV, there is a 35.1% lift force increase and a 25.5% drag
force decrease. The control effects for discharge voltage of 15 kV and 16 kV are
approximately the same. Thus, a threshold voltage exists for plasma aerodynamic actuation
of different time scale. The flow separation can’t be suppressed if the discharge voltage is
Plasma Flow Control
31
less than the threshold voltage. When the flow separation is suppressed, the lift and drag
almost unchanged when the discharge voltage increases. The initial actuation strength is of
vital importance in plasma flow control. Once the flow separation is suppressed with a
initial discharge voltage higher than the threshold voltage, the flow reattachment can be
sustained even the discharge voltage was reduced to a value less than the threshold voltage,
that is to say, the voltage to sustain the flow reattachment is lower than the voltage to
suppress the flow separation in the same conditions. We can make use of the results by
managing the discharge voltage properly. A higher discharge voltage can be used to
suppress the separation in the beginning, and then we can use a much lower discharge
voltage to sustain the flow reattachment later. Not only the power consumption can be
reduced obviously, but also the life-span and the reliability of the actuator can be increased
greatly.
x/c
-Cp
0 0.2 0.4 0.6 0.8
-1
-0.5
0
0.5
1
1.5
2
2.5
3
plasma off
U=13kV
U=14kV
U=15kV
U=16kV
Fig. 12. Pressure distribution for microsecond discharge of different voltage
(α=20°, V
∞
=72 m/s, Re=5.8×10
5
)
The frequency of nanosecond discharge is believed to be optimum when the Strouhal
number
tr sep
S
f
cv
is near unity. The separation region length and inflow velocity are
100% chord length and 100m/s respectively. The Strouhal number is 1 when the pulse
frequency is 830 Hz. Experiments of different pulse frequency were made to determine if
such an optimum frequency exists for the unsteady actuation used in controlling the airfoil
flow separation.
The experimental results are shown in Fig. 13. It is found that there’s an optimum pulse
frequency in controlling the airfoil flow separation. The inflow velocity and the angle of
attack are 100 m/s and 25° respectively. The duty cycle is fixed at 50%. All three electrodes
are switched on. The threshold voltage for different discharge frequency was shown Fig. 14.
When the pulse frequency is 830 Hz, the threshold voltage to suppress the flow separation is
only 10 kV which is the lowest. When the pulse frequency is 200 Hz and 1500 Hz, the
threshold voltage is 13 kV and 12 kV respectively.
Aeronautics and Astronautics
32
x/c
-Cp
0 0.1 0.2 0.3 0.4 0.5 0.6 0.7 0.8
-1
-0.5
0
0.5
1
1.5
2
2.5
3
plasma off
f=200 Hz U=13kV
f=500 Hz U=12kV
f=833 Hz U=10kV
f=1500 Hz U=12kV
Fig. 13. Pressure distribution for nanosecond discharge of different frequency
(α=20°, V
∞
=100 m/s, Re=8.1×10
5
)
f/Hz
U/kV
500 1000 1500 2000
10
10.5
11
11.5
12
12.5
13
13.5
14
14.5
15
15.5
16
f=830 Hz Str=1
Fig. 14. The threshold voltage at different frequencies for nanosecond discharge
(V
∞
=100 m/s, α=22°, Re=8.1×10
5
)
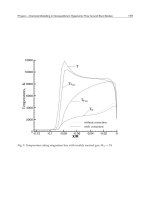
Plasma aerodynamic actuation of different time scales was used for flow separation control.
The flow control ability for microsecond discharge and nanosecond discharge were
analyzed. The pressure distribution along airfoil surface obtained in experiments for inflow
velocity of 150 m/s (Re=12.2×10
5
) are presented in Fig. 15. The angle of attack is 25°, which
is approximately 5° past the critical angle of attack at the inflow velocity of 150m/s
Plasma Flow Control
33
(Re=12.2×10
5
). The discharge frequency is fixed at 1600 Hz. The discharge voltage for
microsecond and nanosecond discharge is 17 kV and 12 kV respectively. When the
nanosecond discharge is on, the flow is fully attached at the leading edge. The lift force
increases by 22.1% and the drag force decreases by 17.4% with the actuation on. But the
microsecond discharge can not suppress the flow separation. The flow still separates at the
leading edge with microsecond plasma aerodynamic actuation. It indicates that the flow
control ability for nanosecond discharge is stronger than that of the microsecond discharge.
The nanosecond discharge is much more effective in leading edge separation control than
microsecond discharge.
x/c
-Cp
0 0.1 0.2 0.3 0.4 0.5 0.6 0.7 0.8
0
0.5
1
1.5
2
2.5
3
3.5
4
plasma off
microsecond discharge U=17kV
nanosecond discharge U=12kV
Fig. 15. Experimental results for microsecond and nanosecond discharge
(V
∞
=150 m/s , α=25°, Re=12.2×10
5
)
3.1.2 Flow separation control by spanwise nanosecond discharge
The model used in this study was a NACA 0015 airfoil. Fig. 16 shows the geometry of the
airfoil and the actuators. The actuator was made from two 0.018mm thick copper electrodes
separated by 1mm thick Kapton film layer. The electrodes were 4mm in width and 60mm in
length. They were arranged just in the asymmetric arrangement.
Experimental results for different angle of attacks (α) at the inflow velocity of 72 m/s
(Re=5.8×10
5
) are shown in Fig. 17. The discharge voltage and frequency of the nanosecond
power supply were fixed at 13 kV and 1000 Hz respectively. Experimental results show that
spanwise nanosecond discharge aerodynamic actuation can suppress the flow separation
effectively. The lift and drag coefficient are nearly unchanged with actuation when the angle
of attack is less than 18° or more than 24°. When the angle of attack is less than the critical
value, there is nearly no flow separation on the airfoil surface. The effect of spanwise
nanosecond discharge aerodynamic actuation can is not obvious. When the angle of attack is
more than 24°, the flow separation on the airfoil surface is so aggressive that spanwise
nanosecond discharge aerodynamic actuation can not suppress the flow separation on the
suction side of the airfoil. So the lift and drag coefficients nearly the same. There is an
Aeronautics and Astronautics
34
obvious lift augmentation and drag reduction after actuation when the angle of attack is
between 18° and 24°. The lift coefficient is increased from 0.814 to 1.099 and the drag
coefficient is decreased from 0.460 to 0.328 after actuation at the angle of attack 24°. The
critical stall angle of attack for NACA 0015 airfoil increased from 18° to 24°. When the angle
of attack is 24°, there is a lift force augmentation of 30.2% and a drag force reduction of
22.1% after actuation.
Fig. 16. Schematic drawing of the actuators on the airfoil
Angle of Attack
Cl
10 15 20 25
0.5
0.6
0.7
0.8
0.9
1
1.1
plasma off
plasma on
Angle of Attack
Cd
10 15 20 25
0
0.1
0.2
0.3
0.4
0.5
0.6
plasma off
plasma on
Cl
Cd
0.6 0.7 0.8 0.9 1 1.1
0
0.1
0.2
0.3
0.4
0.5
0.6
plasma off
plasma on
(a) Results of lift coefficient (b) Results of drag coefficient (c) Results of lift-to-drag ratio
Fig. 17. Experimental results at different angles of attack (V
∞
=72 m/s, Re=5.8×10
5
)
The discharge frequency for microsecond discharge is in the orders of kilo hertz.
Spanwise plasma aerodynamic actuation of different time scales was used for flow
separation control. The flow control ability for microsecond discharge and nanosecond
discharge were analyzed. The pressure distribution along airfoil surface obtained in
experiments for inflow velocity of 66 m/s (Re=5.3×10
5
) and 100 m/s (Re=8.1×10
5
) are
presented in Fig. 18 and Fig. 19. At the angle of attack 22° and inflow velocity of 66 m/s
(Fig. 18), there is initial separated flow on the suction surface of the airfoil without
discharge. The discharge voltage for microsecond and nanosecond discharge is 7 kV and
Plasma Flow Control
35
12 kV respectively. The discharge frequency is 1000 Hz. The flow separation on the
suction surface can be suppressed by both microsecond and nanosecond discharge
actuation. The control effects are nearly the same for microsecond and nanosecond
discharge. The spanwise plasma aerodynamic actuations result in a lift augmentation of
23.6% and a drag reduction of 25.6%.
In Fig. 19, the angle of attack is 24°, which is approximately 4° past the critical angle of
attack at the inflow velocity of 100m/s (Re=5.8×10
5
). The discharge frequency is fixed at
1000 Hz. The discharge voltage for microsecond and nanosecond discharge is 8.5 kV and 12
kV respectively. When the nanosecond discharge is on, the flow is fully attached at the
leading edge. The lift force increases by 25.3% and the drag force decreases by 20.1% with
the actuation on. But the microsecond discharge can not suppress the flow separation. The
flow still separates at the leading edge with microsecond plasma aerodynamic actuation. It
indicates that the flow control ability for nanosecond discharge is stronger than that of the
microsecond discharge. The nanosecond discharge actuation is much more effective in
leading edge separation control than microsecond discharge actuation.
The dielectric layer will be destroyed when the discharge voltage is strong enough. Kapton
is used as the dielectric in our experiments. The threshold voltage to destroy the Kapton
layer is 8.5kV for microsecond discharge in our experiments. The actuators will be destroyed
when the discharge voltage is more than 8.5kV for microsecond discharge. The threshold
voltage to destroy the Kapton layer is 17 kV for nanosecond discharge in our
experiments.The instantaneous actuation intensity for nanosecond discharge is much
stronger than microsecond discharge. So nanosecond discharge is more effective in flow
control than microsecond discharge.
x
/
c
Cp
0 0.2 0.4 0.6 0.8 1
-4
-3
-2
-1
0
no discharge
microsecond discharge U=7kV
nanosecond discharge U=12kV
Fig. 18. Experimental results for microsecond and nanosecond discharge
(V
∞
=66 m/s and α=22° Re=5.3×10
5
)
Aeronautics and Astronautics
36
x/c
Cp
0 0.2 0.4 0.6 0.8 1
-5
-4
-3
-2
-1
0
no discharge
microsecond discharge U=8.5kV
nanosecond discharge U=12kV
Fig. 19. Experimental results for microsecond and nanosecond discharge
(V
∞
=100 m/s, α=24°, Re=8.1×10
5
)
3.1.3 The mechanism of plasma shock flow control
Based on our works, the principle of “plasma-shock-based flow control” was proposed.
Energy should be released in extremely short time to intensify the instantaneous actuation
strength, such as nanosecond discharge. Nanosecond discharge yields strong turbulence even
shock waves which are act on the boundary layer. Shock wave produces stronger turbulent
mixing of the flow, which can enhance momentum and energy exchange between the
boundary layer and inflow greatly. High momentum fluid was brought into the boundary
layer intermittently, enabling the flow to withstand the adverse pressure gradient without
flow separation .The spirits of “plasma-shock-based flow control” lay in three aspects. Firstly,
“Shock Actuation”, nanosecond discharge should be used to increase the instantaneous
discharge power. Nanosecond discharge induces strong local pressure or temperature rise in
the boundary. Pressure or temperature rise result in strong pulse disturbance or shock waves
in the boundary. Secondly, “Vortex control”, shock wave disturbance induces vortex in the
process of propagation. Vortex enhances energy and momentum mixing between boundary
layer and inflow. The velocity of the boundary layer increase and the flow separation is
suppressed. Thirdly, “Frequency Coupling”, adjust the discharge frequency to the optimal
response frequency in flow control. The optimal response frequency is the one which makes
the Strouhal number equal to 1. The plasma aerodynamic actuation work best at the optimal
response frequency. Nanosecond discharge can increase the capability of plasma flow control
effectively while its energy consumption can be reduced greatly.
For microsecond plasma aerodynamic actuation, the momentum effect may be the dominant
mechanism. Microsecond plasma aerodynamic actuation induces near-surface boundary
layer acceleration. Energy and momentum is added into the boundary layer, which
enhances the ability to resist flow separation caused by adverse pressure gradient for
boundary. But the maximum induced velocity for microsecond discharge is less than 10m/s.
Plasma Flow Control
37
The actuators will be destroyed if the discharge voltage is too high. The momentum added
into the boundary layer by microsecond discharge is quite limited. The microsecond plasma
aerodynamic actuation can only work effectively when the inflow velocity is several tens of
meters per second.
The main mechanism for nanosecond discharge plasma flow control may be not momentum
effect, since the induced velocity is less than 1m/s. The velocity and vorticity measurements
by the Particle Image Velocimetry show that, the flow direction is vertical, not parallel to the
dielectric layer surface. The induce flow is likely to be formed by temperature and pressure
gradient caused by nanosecond discharge other than energy exchange between charged and
neutral particles. Thus, the main flow control mechanism for nanosecond plasma
aerodynamic actuation is local fast heating due to high reduced electric field, which then
induces shock wave and vortex near the electrode.
Experimental results indicate that nanosecond discharge is more effective in flow control
than microsecond discharge. The latest study showed that nanosecond discharges have
demonstrated an extremely high efficiency of operation for aerodynamic plasma actuators
over a very wide velocity range (Ma= 0.03-0.75). So shock effect is more important than
momentum effect in plasma flow control.
3.2 Corner separation control in a compressor cascade
Control of the corner separation is one of the important ways of improving axial compressor
stability and efficiency. Our approach to control the corner separation is based on the use of
plasma aerodynamic actuation. Experiments were carried out on a low speed compressor
cascade facility. Main cascade parameters are shown in Fig. 20. Only the middle blade was
laid with the plasma aerodynamic actuator.
Fig. 20. Compressor cascade parameters
Aeronautics and Astronautics
38
Total pressure distributions at 10mm, which is 15% of the chord length, downstream of the
blade trailing edge along the pitch direction at 50%, 60% and 70% blade spans were
measured with and without the plasma aerodynamic actuation. A three-hole probe
calibrated for pitch and yaw was used to measure the total pressure at the cascade exit. Two
parameters, total pressure recovery coefficient σ and the relative reduction of the total
pressure loss coefficient δ(ω), were used to quantify the performance improvement due to
the plasma aerodynamic actuation.
The plasma aerodynamic actuator used in the present experiments consists of four electrode
pairs, located at 5%, 25%, 50% and 75% of the chord length, respectively. The electrode pair
at 5% of chord length is named as the 1
st
electrode pair. A sketch of a blade with the actuator
on the surface is shown in Fig. 21. The electrode thickness is not to scale in the figure.
Fig. 21. A sketch of a blade with plasma aerodynamic actuator
The plasma aerodynamic actuator is driven by a high frequency high voltage power supply
(CTP-2000M+, Suman Electronics). The output waveform is sine wave. The output ranges of
the peak-to-peak voltage and the driving frequency of the power supply are V
p-p
= 0~40 kV
and F = 6~40 kHz, respectively. The driving frequency is fixed at 23 kHz in the experiments.
The plasma aerodynamic actuator works at steady or unsteady mode in the experiments. In
the steady mode, the actuator is operated at the ac frequency. In the unsteady mode of
operation, the ac voltage is cycled off and on. Fig. 22 shows a typical signal sent to the
plasma aerodynamic actuator during the unsteady actuation. Two important parameters of
the unsteady plasma aerodynamic actuation are the excitation frequency f, and the duty
cycle α, respectively.
Fig. 22. The signal sent to the plasma aerodynamic actuator during unsteady excitation
Plasma Flow Control
39
3.2.1 Steady plasma flow control experiment results
The mechanism of steady plasma aerodynamic actuation to control the corner separation
may be that the actuation induces a time-averaged body force on the flow due to that the
flow can’t respond to such high frequency (23 kHz in the experiments) disturbances. A wall
jet, which is oriented in the mean flow direction, is produced to add momentum to the near-
wall boundary layer near the flow separation location. The energized flow is able to
withstand the adverse pressure gradient without separation. The directed wall jet governs
the flow control effect of steady plasma aerodynamic actuation. When the electrode length is
enlarged, the consumed power increases nonlinearly.
The location of the plasma aerodynamic actuation is a key parameter in plasma flow control
experiments. Total pressure recovery coefficients with steady actuation at different locations
are shown in Fig. 23.
Fig. 23. Total pressure recovery coefficients with steady actuation at different locations
(ν
∞
= 50 m/s, i = 0 deg, V
p-p
= 10 kV, F = 23 kHz, 70% Span)
The applied peak-to-peak voltage and driving frequency are V
p-p
= 10 kV and F = 23 kHz,
respectively. δ(ω)
max
is 5.5%, 10.3%, 2.4% and 0.07% when the 1
st
, 2
nd
, 3
rd
and 4
th
electrode
pair is switched on, respectively. The 2
nd
electrode pair at 25% chord length is most effective
and the control effect is as the same as that obtained by all four electrode pairs. The power
dissipated by the 2
nd
electrode pair is just 18.4W, about half of the power dissipated by all
four electrode pairs. Therefore, the actuation location is vital to the control effect in corner
separation control. In corner separation control by tailored boundary layer suction, the
optimum slot should be long enough to be sure to remove the limiting streamline and the
suction upstream of the corner separation location at the suction surface is most important
for the control effect. Therefore, it can be inferred that the location of the 2
nd
electrode pair is
just upstream of the corner separation.
The plasma aerodynamic actuation strength is another important parameter in plasma flow
control experiments. The body force increases with the voltage amplitude in proportion to
Aeronautics and Astronautics
40
the volume of plasma (ionized air) and the strength of the electric field gradient. As the
applied peak to peak voltage increases from 8 kV to 12 kV, δ(ω)
max
increases from to 2.7% to
11.1%, as shown in Fig. 24. The 2
nd
electrode pair at 25% chord length is switched on and the
driving frequency is 23 kHz. The power dissipation increases from 8.4 W to 23.5 W when the
applied peak to peak voltage increases from 8 kV to 12 kV. When the applied voltage is less
than 9 kV, the control effect is very tiny. When the applied voltage is higher than 10 kV, the
control effect saturates and further increases in the voltage amplitude shows no evident
benefit. Furthermore, higher voltage may lead to earlier destruction of the dielectric
material, which is not desirable in the experiments.
Fig. 24. Control effect with steady actuation of different applied voltages
(ν
∞
= 50 m/s, i = 0 deg, F = 23 kHz, 70% Span)
3.2.2 Unsteady plasma flow control experiment results
Optimization of the excitation mode based on coupling between the plasma aerodynamic
actuation and the separated flow is one of the important ways of improving plasma flow
control effect. It has been shown in the literature that the introduction of unsteady
disturbances near the separation location can cause the generation of large coherent vortical
structures that could prevent or delay the onset of flow separation. These structures are
thought to intermittently bring high momentum fluid to the surface, enabling the flow to
withstand the adverse pressure gradient without separation.
A sensitive study is performed to determine if such an optimum frequency exists for the
unsteady actuation used in controlling the corner separation. Fig. 25 documents the relative
reductions of maximum total pressure loss coefficient at 70% blade span for a range of
excitation frequencies from 100 Hz to 1000 Hz when the duty cycle is fixed at 60%. All four
electrode pairs are switched on. The applied peak-to-peak voltage and driving frequency are
V
p-p
= 10 kV and F = 23 kHz, respectively.
Plasma Flow Control
41
Fig. 25. Maximum relative reductions of total pressure loss coefficient with unsteady
actuation of different duty cycles
(ν
∞
= 50 m/s, i = 0 deg, V
p-p
= 10 kV, F = 23 kHz, 70% Span)
When the excitation is 100 Hz, δ(ω)
max
is just 11.2%, which is almost as same as the steady
control effect that is 10.7%. Along with the excitation frequency increasing, the control effect
increases. When the excitation frequency is 400 Hz, δ(ω)
max
increases to 28%. Thus,
compared with the steady actuation, the unsteady actuation is much more effective and
requires less power. When the excitation frequency is higher than 400 Hz, the control effect
saturates and further increases in the excitation frequency shows no evident benefit. The
difference between steady and unsteady plasma aerodynamic actuation may be that, the
unsteady pulsed operation allows the continuously generation of vortical structures, while
the steady operation can’t. Vortical structures in the flow field promote momentum transfer
in the boundary layer in order to withstand separation. Under different duty cycles and
excitation frequencies, the coupling between actuation and flow field leads to different flow
control effects.
Each electrode pair is switched on to study the effect of the actuation location. The control
effect of all four electrode pairs is almost as same as that obtained by the 2
nd
electrode
pair. The saturation frequency is also 400 Hz. For the 2
nd
electrode pair, the characteristic
length is the remaining chord length downstream of the actuator, which is 75% chord
length. Thus, the Strouhal number Sr = f×C/ν
∞
is 0.4 when the frequency and freestream
velocity are f = 400 Hz and ν
∞
= 50 m/s, respectively. When the Strouhal number exceeds
0.4, the control effect saturates in the unsteady plasma flow control experiments. In the
separation control above a NACA 0015 airfoil with unsteady plasma aerodynamic
actuation (Benard et al. 2009), the most effective actuation was performed with a Strouhal
number of Sr ranging from 0.2 to 1.The optimum excitation frequency depends much on
the flow separation state. Under different flow conditions, the optimum excitation
frequency is also different.
Aeronautics and Astronautics
42
Fig. 26 documents the maximum relative reductions of total pressure loss coefficient for a
range of unsteady duty cycles from 5% to 100% when the excitation frequency is fixed at 400
Hz. All four electrode pairs are switched on. The applied peak-to-peak voltage and driving
frequency are V
p-p
= 10 kV and F = 23 kHz, respectively.
Fig. 26. Maximum relative reductions of total pressure loss coefficient with unsteady
actuation of different duty cycles
(ν
∞
= 50 m/s, i = 0 deg, V
p-p
= 10 kV, F = 23 kHz, 70% Span)
It is found that there’s also a duty cycle threshold in controlling the corner separation. When
the duty cycle is less than 60%, the control effect increases along with the duty cycle
increasing. δ(ω)
max
is 28% at the duty cycle of 60%. Even when the duty cycle is 5%, δ(ω)
max
is
15.7%, much more effective than the steady actuation. When the duty cycle is higher than
60%, the control effect saturates along with the duty cycle increasing. Thus it can be inferred
that when the duty cycle is less than 60%, the injected energy is not sufficient to control the
corner separation. In the separation control above a NACA 0015 airfoil with unsteady
plasma aerodynamic actuation, the most effective duty cycle values range from 10% to 60%.
In the separation control of low-pressure turbine blades with unsteady plasma aerodynamic
actuation, the lowest plasma duty cycle (10%) was as effective as the highest plasma duty
cycle (50%) at the same excitation frequency. Thus, the optimum duty cycle also depends
much on the flow separation state.
3.3 Low speed axial compressor stability extension
This series of tests were carried out using a low speed axial compressor test rig at Institute of
Engineering Thermophysics, Chinese Academy of Sciences. The tested compressor rotor
was isolated from the stator to avoid interaction effects generated by the presence of a
downstream stator blade row. The isolated compressor rotor selected for this investigation is
Plasma Flow Control
43
actually the rotor of the first stage of a low-speed three-stage axial compressor test rig,
which has been used for a number of research programs for the flow instability in
compression system. The blading is typical of high-pressure ratio compressor design.
Previous work indicates that the isolated rotor is prone to tip stall behavior, which is
suitable for flow control methods in the end wall flow regions.
The overall compressor performance in terms of pressure rise coefficient Ψ and mass flow
coefficient Φ was measured with eight static pressure taps on casing around the annulus in
both the inlet and the outlet of the compressor. The measurement uncertainties were: static
pressure, ±60N/m
2
. Errors in calculated Ψ and Φ were estimated at ±0.2% maximum, as far
as relative comparison between the results for a certain condition is concerned.
The basic principle of using plasma actuation reated caseing(PATC) to improve compressor
stability range is shown in Fig. 27. When the PATC is energized, plasma forms and induces
airflow along the direction of compressor inflow in the end wall flow region.
Axis of rotation
Inflow direction
Plasma
power s upply
Flexible plasma actuaor
Te f l on ca s in g
Ground e nd
High voltage end
1
st
electrode couple
Rotor blade
Accelerated direction
of induced flow
Fig. 27. Sketch map of using PATC to improve compressor stability range
The basic mechanism for plasma actuation to extend compressor’s stability can be classified
to three effects. The first is that plasma actuation induces air acceleration along with the
inflow direction in the blade tip end wall region. Energy is added to the low-energy flow in
the end wall region, which can increase mass flux at blade leading edge, inhibit
development of blade tip secondary flow and leakage flow, and enhance circulating ability
in the end wall region. Thus the accumulation of flow build up is minished. The second is
that due to the end wall flow acceleration induced by plasma actuation, velocity in flow
direction at blade tip channel is enhanced and inflow attack angle is reduced. Thus flow
separation at blade suction surface is inhibited. The last effect is that plasma actuation is
non-stationary and non-linear actuation, which can enhance mixture among flow with
different momentum in the end wall region. Thus flow separation due to low energy is
inhibited and compressor stability is extended. Since plasma actuation can minish flow
build up extent in the blade tip end wall region, inhibit secondary flow and leakage flow,
and enhance circulating ability, compressor pressure rise ability is improved.
PATC consists of a flexible plasma actuator and a casing. The plasma actuator, layout of
which is asymmetrical, consists of 5 electrode couples. The 4
th
electrode couple is located at
3mm away from the blade leading edge, while the 5
th
couple is located at the 40% blade tip
chord. The thickness of teflon layer, h, is 0.5mm. The electrode is 0.035×2mm copper layer.
Aeronautics and Astronautics
44
The horizontal displacement between upper and lower electrode for each couple, Δd, is 1
mm. The distance between adjacent electrode couples, D, is 10 mm. The casing is also made
of teflon. Fig. 28 and Fig. 29 show the PATC and the low speed axial compressor with
PATC, respectively. For the PATC and tested rotor, tip clearance is 0.6 mm, which is 1.65%
of the blade chord length.
Fig. 28. Plasma actuation treated casing
Fig. 29. Low speed axial compressor test rig with PATC
Plasma Flow Control
45
Plasma actuation casing is energized by a high voltage power supply. The output of the
power supply is sine wave. The amplitude and frequency range is 0-30 kV and 6-40 kHz,
respectively, which can be adjusted continuously.
The compressor throttling was throttled by the exit rotary cone valve mounted on the shaft
and regulated manually when stall was approached. Wall static pressure was collected to
calculate pressure rise coefficient Ψ and flow coefficient Φ, which are adopted as
representatives of compressor performance and stability with and without plasma actuation
at a constant rotor speed.
The effect of plasma actuation on the compressor performance and stability range is
displayed in Fig. 30 at the rotor speed of 900 rpm. The 4
th
electrode couple is actuated and
the actuation voltage is 9 kV.
0.35 0.40 0.45 0.50 0.55
0.10
0.15
0.20
0.25
0.30
0.35
0.40
Actuation off
Actuation on, 9 kV
Pressure rise coefficient
Mass flow coefficient
Fig. 30. Test results with and without plasma actuation(rotor speed: 900 rpm)
The changes of maximum pressure rise coefficient, Ψ
max
and mass flow coefficient near
stall, Φ
ns
are summarized in table 1. The Φ
ns
decreases by 5.2%, while the Ψ
max
increases
by 1.08%.
Ψ
max
ΔΨ
max
/Ψ
max
Φ
ns
ΔΦ
ns
/Φ
ns
0
0.3721 0.4426
1
0.3761 1.08% 0.4196 -5.2%
0: PATC off, 1: 4
th
electrode couple on, 9 kV.
Table 1. The effect of plasma actuation on compressor performance and stability range
Fig. 31 illustrates the test results with and without plasma actuation at the rotor speed of
1080 rpm. When the 2
nd
and 3
rd
electrode couples are switched on, Φ
ns
decreases by 1.42%
and 5.07% when the actuation voltage is 9 kV and 12 kV respectively. Ψ
max
decreases by
2.21% and 0.74% respectively.
Aeronautics and Astronautics
46
0.30 0.35 0.40 0.45 0.50 0.55
0.10
0.15
0.20
0.25
0.30
0.35
0.40
Actuation off
Actuation on, 9 kV
Actuation on, 12 kV
Pressure rise coefficient
Mass flow coefficient
Fig. 31. Test results with and without plasma actuation(rotor speed: 1080 rpm)
Along with the actuation voltage ascending, plasma actuation strength increases while
plasma actuator’s layout form and material remain same. Thus the velocity of induced flow
acceleration increases, which can better enhance the circulation ability in end wall region,
reduce inflow attack angle and promote flow mixture. As a result, the compressor stability
range is much wider. Therefore plasma actuation strength, which can be improved by
adjusting actuator layout form or increasing actuation voltage, is one key factor in plasma
based stability extension.
Fig. 32 represents the effect of plasma actuation location on the compressor performance
and stability range when the rotor speed equals 1080 rpm. When 3
rd
and 4
th
electrode
couples are switched on at 12 kV, Φ
ns
decreases by 1.42% and Ψ
max
decreases by 1.47%.
When the 2
nd
and 3
rd
electrode couples are switched on, Φ
ns
and Ψ
max
decrease by 5.07% and
0.74%, respectively. Therefore, different actuation location results in different stability range
extension effect. One possible reason is that the 4
th
electrode couple is just 3mm(8.3% of axial
chord) away from the rotor blade leading edge, where flow build up is very serious and
flow separation has well developed in blade tip end wall region at near stall state. Thus
plasma actuation at this location can’t control the flow field well and the stability extension
effect is limited. When the 2
nd
and 3
rd
electrode couple is on, because the 3
rd
electrode couple
is 18mm(49.5% of axial chord) away from the rotor blade leading edge, plasma actuation
can accelerate the flow boundary layer before flow separation and build up in well
development, which can inhibit the end all separation flow, secondary flow and leakage
vortex better. Therefore stability extension effect is much better.
The changes of Ψ
max
and Φ
ns
are summarized in table 2. Ψ
max
decreases at every case when
plasma actuation is on. The Ψ
max
decrease is least when the Φ
ns
decrease is most. So there is
no contradiction between stability range extension and pressure rise coefficient
improvement. When the ability for plasma actuation to control the blade tip end wall region
flow becomes stronger, the stability extension effect is better and the pressure rise ability
almost remains same.
Plasma Flow Control
47
0.30 0.35 0.40 0.45 0.50 0.55
0.10
0.15
0.20
0.25
0.30
0.35
0.40
Actuation off
Actuation on(3rd and 4th)
Actuation on(2nd and 3rd)
Pressure rise coefficient
Mass flow coefficient
Fig. 32. Test results with and without plasma actuation (rotor speed: 1080 rpm)
Ψ
max
ΔΨ
max
/Ψ
max
Φ
ns
ΔΦ
ns
/Φ
ns
0 0.3772 0.4438
1 0.3689 -2.21% 0.4375 -1.42%
2 0.3744 -0.74% 0.4213 -5.07%
3 0.3717 -1.47% 0.4375 -1.42%
0: PATC off.
1: 2
nd
and 3
rd
electrode couples on, 9kV.
2: 2
nd
and 3
rd
electrode couples on, 12kV.
3: 3
rd
and 4
th
electrode couples on, 12kV.
Table 2. The effect of plasma actuation on compressor performance and stability range
4. Supersonic plasma flow control
Based on plasma aerodynamic actuation, plasma flow control is a novel active flow control
technique and has important applications in the field of supersonic flow control. Shock waves
are typical aerodynamic phenomena in supersonic flow. If they are controlled effectively, the
aerodynamic performance of both flight vehicles and aeroengines will be greatly enhanced.
Conventional mechanical or gasdynamic control methods have disadvantages of complex
structure and slow response. Novel plasma flow control method has advantages of simple
structure, fast response and wide actuation frequency range. Therefore, plasma flow control
method has become a newly-rising focus in the field of shock wave control.
4.1 Experimental principle and arrangement
Fig. 33 shows the MHD flow control experimental principle. The high density plasma column
which primarily consists of ions and electrons was generated between a pair of electrodes
Aeronautics and Astronautics
48
through pulsed DC discharge. There were three pairs of electrodes and an oblique shock wave
appeared in front of the ramp in low-temperature supersonic flow. The alphabet “I” and “B”
represented the current and magnetic field. The arrows gave their directions.
Fig. 33. The experimental principle
When magnetic field, normal to the surface, was imposed on the plasma column created in
the boundary layer, it affected both the plasma and, through the Lorentz body force (j×B
body force), the flow. The direction of Lorentz body force was determined by the directions
of current and magnetic field. The alphabet “F” represented the Lorentz body force which
could accelerate the flow.
The plasma column was produced by pulsed DC discharge. Therefore the plasma would be
influenced by electric field force, magnetic field force and the airflow inertial force. The
magnetic field force and the airflow inertial force were dominant. When the direction of
magnetic field force was same as that of airflow inertial force and the velocity of plasma was
faster than that of the neutral gas molecules, the plasma would strike the neutral gas
molecules to transfer momentum and accelerate the flow in the boundary layer. Otherwise,
when the direction of magnetic field force was against with that of airflow inertial force, the
plasma would strike the neutral gas molecules to transfer momentum and decelerate the
flow in the boundary layer.
MHD flow control system consisted of low-temperature supersonic wind tunnel, plasma
actuation system, experimental ramp, magnetic field generator, parameter measurement
system and schlieren optical system. The inlet total pressure of low-temperature supersonic
wind tunnel was about 5-7atm. The stagnation conditions for the tunnel were atmospheric
pressure and room temperature. The run time could reach up to 60 seconds dependent on
the inlet total pressure. The experimental duct was 115mm(length)×80mm(width) and the
designed Mach number was 2.2. The static pressure was 0.5-0.7atm and the static
temperature was 152K.
The plasma actuation system included pulsed DC power source, plasma actuator, insulating
acrylic base. Pulsed DC power source was the critical equipment which consisted of high
voltage pulsed circuit, high voltage DC circuit and feedback circuit. It could provide 0-90kV
selected high voltage pulse and 0-3kV selected high voltage direct current. The electrodes
were made of plumbago, and were flush-mounted on the top wall of the insulating
Plasma Flow Control
49
dielectric. The diameter of the electrode was 10mm. The insulating dielectric was made of
BN ceramic. Two kinds of arrangements for the plasma actuator were adopted according to
the distance between a pair of electrodes (D=5mm or D=8mm).
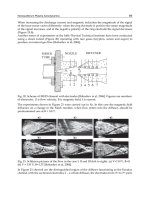
The experimental ramp was also constructed of insulating acrylic material. It was installed on
the insulating acrylic base. The dimension of the ramp was 34mm(length) ×25mm(width)
×6mm(height). One angle of ramp was A=15°and another was A=20°. As illustrated in Fig. 34,
10 static pressure measurement holes were drilled on the acrylic base, the plasma actuator and
the ramp. The holes were numbered with k1-k10 from upstream to downstream. Holes k2-k8
were drilled on the plasma actuator, and holes k9-k10 were drilled on the ramp. The diameter
of k1-k10 was 0.5mm. On the plasma actuator the distance between adjacent holes was 10mm
except that the distance between k2 and k3 was 7.5mm and the distance between k7 and k8
was also 7.5mm. On the ramp the distance between k9 and plasma actuator edge was 6mm
and the distance between k9 and k10 was 6mm.
Nd-Fe-B rare-earth permanent magnets were used as the magnetic field generator which
was located normal to experimental duct. The direction of magnetic field was perpendicular
to the flow direction and the electric field direction. The magnetic field strength was about
0.3T between two magnets.
Fig. 34. The dimensions of the plasma actuator and the ramp
Parameter measurement system consisted of electric parameter and flow characteristic
measurement systems. Electric parameter measurement system included oscillograph
(DPO4104, Tektronix Inc.), high voltage probe (P6015A, Tektronix Inc.) and current
probe(TCP312+TCPA300, Tektronix Inc.). Flow characteristic measurement system included
10 static pressure sensors and a data collection apparatus. Because the run time of the wind
tunnel was above 10 seconds in every experiment, the inlet total pressure decreased slowly
during the experimental time. Therefore, in this study the ratio of Pitot pressure after shock-
wave to that before shock-wave was adopted to compare the flow characteristic of the
airflow around the ramp that was illustrated as P
k10
/P
k7
.
Schlieren optical system consisted of a high-speed camera and a storage computer. The high-
speed camera was an Optronis
high-speed camera, and the maximum frame frequency was
200k frames per second(FPS). In this study, the schlieren pictures were taken at 8kFPS. The
exposure time was 100µs and the run time was 8s.
Aeronautics and Astronautics
50
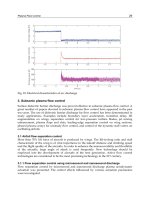
4.2 Experimental results
In terms of different magnetic field directions, distances between electrodes, ramp angles
and DC Voltage, the results of these four kinds of MHD flow control were compared and
analyzed.
Through changing the magnetic field direction, MHD acceleration and MHD deceleration
experiments were carried out. Fig. 35 represented two typical flow characteristics.
(a) D=5mm, A=20
° (b) D=8mm, A=15°
Fig. 35. Two typical flow characteristics
The time-averaged pressure ratio decreased by 6.04% and 5.09% with MHD acceleration and
MHD deceleration respectively. Thus, MHD flow control could drastically weaken the
oblique shock wave strength and change the flow characteristic of the airflow around the
ramp. MHD acceleration was more effective than MHD deceleration.
MHD acceleration experiments were carried out at ramp angle A=20°with D=8mm or 5mm.
Fig.36 showed the flow characteristics with different distances. At D=8mm the time-
averaged pressure ratio decreased by 19.66% with MHD acceleration. At D=5mm the time-
averaged pressure ratio decreased by 11.64% with MHD acceleration. Thus, MHD
acceleration was more effective to weaken the shock wave strength when D increased, but
there existed a maximum value D
max
exceeding which the airflow could not be ionized
restricted by power source.
Fig. 36. Flow characteristics with different distances
Plasma Flow Control
51
MHD acceleration experiments were carried out at D=8mm with different ramp angles
A=15°or 20°. Fig. 37 showed the flow characteristics with different ramp angles. At A=15°
the time-averaged pressure ratio decreased by 6.04% with MHD acceleration. At A=20° the
time-averaged pressure ratio decreased by 19.66% with MHD acceleration. Thus, MHD
acceleration was more effective to weaken the shock wave strength when A increased, but
there existed a maximum A
max
exceeding which oblique shock wave strength would be too
strong to be changed.
Fig. 37. Flow characteristics with different ramp angles
Through changing DC voltage V
DC
(2kV, 2.5kV, 3kV), MHD acceleration and MHD
deceleration experiments were carried out at ramp angle D=8mm, A=15°. Fig. 38 showed
the flow characteristics with different V
DC
. Fig. 38(a) showed the static pressure ratio
varying with MHD acceleration. The time-averaged pressure ratio decreased by 3.95%,
5.19% and 6.04% with V
DC
=2kV, 2.5kV and 3kV respectively. Fig. 38(b) showed the static
pressure ratio varying with MHD deceleration. The time-averaged pressure ratio
decreased by 3.44%, 4.26% and 5.09% with V
DC
=2kV, 2.5kV and 3kV respectively. Thus,
MHD flow control could drastically weaken the oblique shock wave strength and change
the flow characteristic of the airflow around the ramp. MHD interaction was more
effective when V
DC
increased.
(a) MHD acceleration (b) MHD deceleration
Fig. 38. Flow characteristics with different V
DC
Aeronautics and Astronautics
52
The schlieren pictures were captured during the time of flow characteristic measurement at
all conditions. The typical schieren pictures were illustrated in Fig. 39 at D=8mm, A=20°
with MHD acceleration. Fig. 39(a) showed the benchmark flow with no electric field and no
magnetic field while Fig. 39(b) showed the flow with electric field and magnetic field in the
case of MHD acceleration. Four shock waves before the ramp were shown in the benchmark
picture, three of which were produced by the coarse interface between electrodes and
ceramic and the last shock wave was produced by the ramp. Without MHD acceleration the
shock wave angle near the ramp was about 37.5°, and the distance between the shock wave
location and the ramp was about 7.1mm. With MHD acceleration the shock wave angle near
the ramp was reduced to 35°, and the distance was increased to 10mm which meant the
shock wave was moved upstream by 2.9mm. Therefore, MHD flow control could change
shock wave location, convert a strong shock wave into many weak shock waves, weaken the
shock wave strength and change the flow characteristic near the ramp.
(a) Benchmark flow (b) MHD acceleration flow
Fig. 39. Benchmark and MHD acceleration flow at a typical condition
5. Conclusion
The principle of plasma aerodynamic actuation and its application in subsonic and
supersonic flow control was summarized. The mechanism for plasma flow control can be
summarized as momentum effect, shock effect, and chemical effect. Both the plasma and
flow characteristics of the plasma aerodynamic actuation were investigated. Plasma flow
control used in airfoil separation control, corner separation control, axial compressor
stability extension and shock wave control were studied.
6. Acknowledgment
The authors thank Yikang Pu, Shouguo Wang, Junqiang Zhu and Chaoqun Nie for the help
in the experiment and analysis. Support for this work was received from the National
Natural Science Foundation of China (50906100, 10972236, 51007095) is gratefully
acknowledged.
7. References
Corke, T., Post, M. & Orlov, D. Dielectric Barrier Discharge Plasma Actuators for Flow
Control, Progress in Aerospace Sciences, Vol.43, (January 2010), pp. 505-529, ISSN
0376-0421
Plasma Flow Control
53
Moreau, E. Airflow Control by Non-thermal Plasma Actuators, Journal of Physics D: Applied
Physics, Vol.40, No.3, (January 2007), pp. 605-636, ISSN 0022-3727
Roth, J. Aerodynamic Flow Acceleration Using Paraelectric and Peristaltic
Electrohydrodynamic Effects of a One Atmosphere Uniform Glow Discharge
Plasma, Physics of Plasmas, Vol.10, No.5, (May 2003), pp. 2117-2126, ISSN 1070-
664X
Bletzinger, P., Ganguly, B. & VanWie, D. (2005). Plasmas in High Speed Aerodynamics,
Journal of Physics D: Applied Physics, Vol.38, No.4, (April 2005), pp. R33–57, ISSN
0022-3727
Wu, Y., Li, Y., Jia, M., Song, H., Guo, Z. G., Zhu, X. & Pu, Y. Influence of Operating Pressure
on Surface Dielectric Barrier Discharge Plasma Aerodynamic Actuation
Characteristics, Applied Physics Letters, Vol.93, No.3, (July 2008), pp. 031503(3p),
ISSN 0003-6951
Li, Y., Wu, Y., Zhou, M., Su, C., Zhang, X. & Zhu, J. Control of the Corner Separation in a
Compressor Cascade by Steady and Unsteady Plasma Aerodynamic Actuation,
Experiments in Fluids, Vol.48, No.6, (June 2010), pp. 1015-1023, ISSN 0723-4864
Li, Y., Wu, Y., Jia, M., Zhou, Z., Guo, Z., & Pu, Y. Optical Emission Spectroscopy
Investigation of a Surface Dielectric Barrier Discharge Plasma Aerodynamic
Actuator, Chinese Physics Letters, Vol.25, No.11, (November 2008), pp. 4068-4071,
ISSN 0256-307X
Wu, Y., Li, Y., Jia, M., Song, H., Su, C. & Pu, Y. Experimental Investigation into
Characteristics of Plasma Aerodynamic Actuation Generated by Dielectric Barrier
Discharge, Chinese Journal of Aeronautics, Vol.23, No.1, (January 2010), pp. 39-45,
ISSN 1000-9361
Li, Y., Wang, J., Wang, C., An, Z., Hou, S. & Xing, F. Properties of Surface Arc Discharge in a
Supersonic Airflow, Plasma Sources Science and Technology, Vol.19, No.2, (March
2010), pp.025016(9p), ISSN 0963-0252
Wang, J., Li, Y. & Xing, F. Investigation on Oblique Shock Wave Control by Arc Discharge
Plasma in Supersonic Airflow, Journal of Applied Physics, Vol.106, No.7, (October
2009), pp.073307(7p) , ISSN 0021-8979
Wang, J., Li, Y., Cheng, B., Su, C., Song, H. & Wu, Y. Effects of Plasma Aerodynamic
Actuation on Oblique Shock Wave in a Cold Supersonic Flow, Journal of Physics D:
Applied Physics, Vol.42, No.16, (June 2009), pp. 165503(8p), ISSN 0022-3727
Su, C., Li, Y., Cheng, B., Wang, J., Cao, J. & Li, Y. Experimental Investigation of MHD Flow
Control for the Oblique Shock Wave Around the Ramp in Low-temperature
Supersonic Flow, Chinese Journal of Aeronautics, Vol.23, No.1, (January 2010), pp. 22-
32, ISSN 1000-9361
Wu, Y., Li, Y., Zhu, J., Su, C., Liang, H. & Li, G. (2007). Experimental Investigation of a
Subsonic Compressor with Plasma Actuation Treated Casing, 37th AIAA Fluid
Dynamics Conference and Exhibit, pp. 1-8, Miami, FL, USA, June 25-28, 2007
Li, Y., Wu, Y., Liang, H., Song, H. & Jia, M. (2010), The mechanism of plasma shock flow
control for enhancing flow separation control capability, Chinese Sci Bull (Chinese
Ver), vol. 55, No. 31, (November 2010), pp. 3060- 3068, ISSN 0023-074X