Biomass and Remote Sensing of Biomass Part 4 ppt
Bạn đang xem bản rút gọn của tài liệu. Xem và tải ngay bản đầy đủ của tài liệu tại đây (356.28 KB, 20 trang )
Invasive Plant Species and Biomass Production in Savannas
51
soil. These are some of traits found in invasive species such as Prosopis juliflora (Pasiecznik,
2001). Furthermore many of the woody species found in the savanna have ligno-tubers and
deep roots, enhancing the root : shoot ratio while tropical grasses generally have a high
capacity to accumulate below-ground carbon(Scholes & Hall, 1996).
Losses mainly through burning and soil erosion also determine the amount of carbon
sequestered. As discussed above fire is an integral driver and determinant of tropical
savanna function and structure with large areas seasonally burnt resulting in an efflux of
carbon in the range of 2.4–4.2 Gt C year
-1
or 42% of global burned phytomass and as high as
5–8 Gt C year
-1
if other losses such as management for grazing and land-use change are
taken into account (Hall & Scurlock, 1991) may influence the regional and possibly global
energy. Plant traits that reduce carbon loss include fire resistance manifested by thick bark,
dense wood and high lignin concentration others include fire resilience traits such as fire
tolerant seeds and resprouting.
From the foregoing invasive species will significantly alter carbon pools depending on
whether they have large enough effects on flux variables such as above-ground net primary
production and litter decomposition, fire regimes, resources such as water and nutrients,
this will depend on their traits of the invader. By alteration of the components of the
Carbon (C) and nitrogen (N) cycles which are fundamental ecosystem functioning and
processes invasive plants influence sequestration. Do introduced plant species that turn
invasive have traits that augment carbon sequestration?
Many studies have shown that ecosystem net primary production (NPP) to have increased
and C and N stocks to be higher in the invaded ecosystems relative to the native ecosystems
(Ehrenfeld et al., 2001). However due to the wide range of effects of invasive plants on C
and N processes and stocks the overall direction and magnitude of such alterations are
poorly quantified. Liao et al (2007) using a meta-analysis approach of 94 experimental
studies to quantify the changes found that plant invasion enhanced C and N pool sizes in
plants, soils and soil microbes and stimulated ANPP by 83% in invaded ecosystems
compared with native ecosystems grouped into forests, grasslands and wetlands. This
attributed to ecophysiological differences between native and invasive species that lead to
greater ANPP, plant and litter biomass, higher plant N concentration, and higher litter N
concentration and lower litter C : N ratio.
In savannas Archer et al. (2002) reported that in southern Texas bush encroachment by
mainly the leguminous tree Prosopis glandulosa resulted n higher root biomass, increased
SOC and total N with a linear increase in SOC storage rate with tree age. Similarly in sodic
soils Kaur et al (2002) found trees planted in silvopastoral systems the total net productivity
was highest in those consisting of the invader Prosopis juliflora even though grass
productivity was lowest in such mixtures. Increased ANPP leading to higher C
sequestration has been attributed to differences in ecophysiological traits such as specific
leaf area and net photosynthetic rate between native and invasive species. In addition
invaded ecosystems in general have 117% higher litter decomposition rate in comparison
with native ecosystems, explained by higher plant and litter N concentration, lower litter C :
N and lignin : N ratio than the native species (Liao et al., 2007). Where woody plants invade
grass dominated savannas they tend be more productive above- and belowground and
hence deliver more organic matter into soils, are seldom browsed by livestock or wildlife,
suggesting high concentrations of secondary compounds hence a large fraction of the foliar
biomass goes into the soil pool directly as litter, more lignified roots of shrubs also promote
C and N accumulation compared to that of grass roots and shoots (Archer et al., 2000)
Biomass and Remote Sensing of Biomass
52
However not all studies have noted increased C and N sequestering, some have shown
plant invasion can have negative effects. For example Jackson et al. (2002) observed a C loss
from a grassland ecosystem invaded by woody plants. In a Kenyan savanna Mworia et al
(2008b) found N mineralization was significantly lower under the canopy of the invasive
herb Ipomoea hildebrandtii as compared to locally dominant grass Chloris roxburghiana even
though it was higher than bare ground/eroded areas. Ipomoea hildebrandtii is non-legume
that is unpalatable and generally compounds that reduce plant palatability also reduce litter
decomposition rate which may explain the reduced nitrification.
In conclusion plant invasions have led to increased C and N pools with responses attributed
to differences in ecophysiological traits between invasive and native species related to
ANPP, plant N concentration and litter biomass. Also sequestering is higher for invasive N-
fixing than for nonN-fixing plants and invasive woody than for herbaceous species.
6. Conclusions
Savannas are an important biome given their high total NPP which is second only to forests,
3
rd
highest sequestered carbon pool, highest ungulate herbivore populations and habitation
of pastoral peoples. Savannas consist of mixtures of trees and grasses with the ratio largely
determined by factors precipitation, herbivory, fire and soil nutrients however the
mechanisms by which they operate is still debated with some ecologists emphasizing the
role of competition for resources and others the effect disturbances regulating tree
populations. There is need for continued research in savanna dynamics incorporating
aspects of changing climate and land use patterns.
Over the history of human development large numbers of plant species have been moved
across physical barriers for a wide range of reasons such as food, forage and ornamental,
many have been naturalized and only a small proportion have become invasive. Ecologists
have put great effort in trying to understand factors that make plant communities
susceptible to invasion. Important factors identified are the characteristics of the invader
mainly traits that allow greater resource use efficiency, ease of propagation and faster
growth, secondly the vulnerability of communities to invasion largely ecological
disturbances leading to resource fluctuations. There are still several gaps and grey areas in
our understanding of invasive species in savannas. Firstly the implications of the current
rapid land use changes in savannas and their interaction with the climate change effects
such as increased frequency of ENSO induced drought on invasive species proliferation and
impacts is poorly understood. Secondly given the importance of plant characteristics on
successful invasion of a non-native species there is inadequate information on the
distribution of non-native species in savannas, their autoecology and to the dynamics of
host savannas in relation to variation of disturbances in time and space. In some savannas
such as in Africa with an exception of South Africa few comprehensive surveys and studies
on invasive species have been conducted.
The productivity of savannas is mainly regulated by rainfall and soil nutrients whose
variability leads gradients of production and compositional change in savannas while soil
attributes such as texture have larger effects on functional group composition rather than
production. The spatial and temporal comparison and monitoring of productivity in
savannas has been hampered by the wide array of methods historically used with many
underestimating NPP or focusing on single species or life-form. In general savannas have
been accorded far less attention in research, monitoring and database development as
Invasive Plant Species and Biomass Production in Savannas
53
compared to forests which are regularly censured using ground and satellite imagery
methods which is a conundrum given their almost equal total NPP.
7. References
Adger, W.N.; Huq, S.; Brown, K.; Conway, D. & Hulme M. (2003). Adaptation to climate
change in the developing world. Progress in Development Studies, Vol. 3, No.3, pp.
179-195
Archer, S.; Boutton T.W. & Hibbard K.A 2002. Trees in grasslands: biogeochemical
consequences of woody plant expansion, In: Global Biogeochemical Cycles in the
Climate System, S.P. Schulze; Harrison, M.H.; Holland, E.A.; Lloyd, J.; Prentice, I.C.
& D. Schimel, (Eds) . Academic Press, San Diego
Barger, N.N.; D’Antonio, C.M.; Ghneim, T. & Cuevas. E. (2003). .Constraints to colonization
and growth of the African grass, Melinis minutiflora, in a Venezuelan savanna. Plant
Ecology, Vol.167, pp.31–43.
Baruch, Z. & Jackson RB.(2005). Responses of tropical native and invader C
4
grasses to
water stress, clipping and increased atmospheric CO
2
concentration. Oecologia,
Vol.145. pp.522–532.
Binggeli, P.; John B.H. & Healey, J.R (1998). An overview of invasive woody plants in the
tropics. School of Agricultural and Forest Sciences. Publication Number
13,University of Wales, Bangor
Brooks, M ; D’Antonio, CM.; Richardson, D.M.; Grace, J.B.; Keeley, J.E.; Di Tomaso, J.M.;
Hobbs, R.J. & Pyke, P.M. D.(2004) Effects of invasive alien plants on fire regimes.
Bioscience, Vol. 54, pp.677–688
Churkina, G. & Running, S.W. (1998). Contrasting Climatic Controls on the Estimated
Productivity of Global Terrestrial Biomes. Ecosystems , Vol. 1, pp.206–215
D’Antonio M. C. & Vitousek, P.M.(1992). Biological invasions by exotic grasses, the
grass/fire cycle and global change. Annu. Rev. Ecol. Syst, Vol. 23, pp.63-87
Davis, M.A.; Grime, J.P. & Thompson, K.(2000). Fluctuating resources in plant communities:
a general theory of invasibility. Journal of Ecology, Vol. 88 pp. 528–534.
Deans, J.D.; Diagne, O.; Nizinski, J.;. Lindley, D. K.; Seck M.; Ingleby. K. & Munro, R. C.
(2003). Comparative growth, biomass production, nutrient use and soil
amelioration by nitrogen-fixing tree species in semi-arid Senegal. Forest Ecology and
Management Vol. 176, Issues 1-3, 17 pp. 253-264
De Deyn, G.B.; Cornelissen,.JH.C. & .Bardgett, R.D. (2008). Plant functional traits and soil
carbon sequestration in contrasting biomes. Ecology Letters Vol.11, pp. 516–531
Ehrenfeld, J.G.; Kourtev, P. & Huang, W.Z. (2001). Changes in soil functions following
invasions of exotic understory plants in deciduous forests. Ecological Applications
Vol.11, pp. 1287–1300.
Ellis, J.E. & Swift, D.M. (1988). Stability of African pastoral ecosystems: alternative
paradigms and implications for development. Journal of Range Management, 41, 450–
459
Foxcroft, LC.; Richardson, D.M.; Rejmanek. M. & Pysek, P. (2010). Alien plant invasions in
tropical and sub-tropical savannas: patterns, processes and prospects. Biol Invasion,
Vol. 12 pp.3913–3933
Frank, D.A.; McNaughton, S.J. & Tracy B F.(1998). The Ecology of the Earth's Grazing
Ecosystems. BioScience, Vol. 48, No. 7, pp.513-521
Biomass and Remote Sensing of Biomass
54
Grace J.; Jose, J.S.; Meir, P.; Miranda, H.S. & Montes, R.A.(2006). Productivity and carbon
fluxes of tropical savannas. Journal of Biogeography, Vol.33, pp. 387–400
Grantz, M. (2000). Currents of change: Impacts of El Nino and La Nina on society (2
nd
Edition).
Cambridge, UK Cambridge University Press.
Hall, D.O. & Scurlock, J.M. (1991). Climatic change and productivity of natural grasslands.
Annals of Botany, Vol.67, pp.49–55.
Higgins, S.I.; Bond, W.J. & Trollope, W.S.W. (2000). Fire, resprouting and variability: a recipe
for grass–tree coexistence in savanna. Journal of Ecology, Vol.88, pp.213–229.
Holdo, R.M.; Holt, R.D.; Coughenour, M.B. & Ritchie, M.E. (2007). Plant productivity and
soil nitrogen as a function of grazing, migration and fire in an African savanna.
Journal of Ecology, Vol. 95, pp. 115–128
House, J.I. & Hall, D.O. (2001). Productivity of tropical savannas and grasslands. Terrestrial
global productivity: past
Huntley, B.J. & Walker BH (eds) .(1982). Ecology of tropical savannas. Ecological studies 42.
Springer, Berlin
Jama, B.; Nair, P.K.R & Kurira, P.W. (1989). Comparative growth performance of some
multipurpose trees and shrubs grown in Machakos, Kenya. Agroforestry Systems,
Vol. 9, No.1, pp. 17-29
Jeltsch, F.; Weber, G.E. & Grimm V. (2000). Ecological buffering mechanisms in savannas: a
unifying theory of long-term tree-grass coexistence. Plant Ecology. Vol.161, pp.161-
171.
Kaur, B.S.; Gupta, R. & Singh, G. (2002). Carbon storage and nitrogen cycling in
silvopastoral systems on a sodic soil in northwestern India. Agroforestry Systems,
Vol.54, pp. 21–29.
Ker, A. (1995). Farming systems of the African savanna A Continent in Crisis. IDRC .
Kinyamario, J.I. & Imamba, S.K.( 1992). Savanna at Nairobi National Park. In: Primary
Productivity of Grass Ecosystems of the Tropics and Sub-tropics. Long, S.P.; Jones, M.B.
& Roberts, M.J. (Eds) pp 25–69 Chapman & Hall, London, UK
Klink, C.A. (1994). Effects of clipping on size and tillering on native and African grasses of
the Brazilians savannas ( the cerrado). Oikos, Vol. 70, pp. 365-376.
Lane, D.R.; Coffin, D.P. & Lauenroth, W.K. (1998). Effects of soil texture and precipitation
on above-ground net primary productivity and vegetation structure across the
Central Grassland region of the United States. Journal of Vegetation Science, Vol.9,
pp.239–250.
Liao, C.; Peng, R.; Luo, Y.; Zhou, X.; Wu, X.; Fang, Chen, C. J. & Li B. (2008). Altered
ecosystem carbon and nitrogen cycles by plant invasion: a meta-analysis. New
Phytologist, Vol.177, pp.706–714
Lloyd, J.; Bird, M.I.; Vellen, L.; Miranda, A.C.; Veenendaal, E.M.; Djagbletey, G.; Miranda,
H.S.; Cook, G &. Farquhar, G.D. (2008). Contributions of woody and herbaceous
vegetation to tropical savanna ecosystem productivity: a quasi-global estimate. Tree
Physiology, Vol. 28, pp.451–468
Lockwood, J.L.; Hoopes, M.F. & Marchetti, M.P. (2007). Invasion Ecology. Malden: Blackwell
Publishing.
Long, S.P.; Garcia, M.E.;, Imbamba, S.K.; Kamnalrut, A.; Piedade, M.T.; Scurlock, J.M.; Shen,
Y.K. & Hall, D.O. (1989). Primary productivity of natural grass ecosystems of the
tropics, a reappraisal. Plant and Soil,
Vol.115, pp.155–166.
Invasive Plant Species and Biomass Production in Savannas
55
Lonsdale, W. M. (1994), Inviting trouble: Introduced pasture species in northern Australia.
Australian Journal of Ecology, 19: 345–354.
Lovejoy, T.E. & Hannah L (eds). 2006. Climate change and biodiversity. Yale University Press
Masocha, M.A.; Skidmore, K.; Poshiwa, X & Prins, H.H.T. (2010). Frequent burning
promotes invasions of alien plants into a mesic African savanna. Biological Invasions.
DOI 10.1007/s10530-010-9921-6, open access at Springerlink.com
Muturi, G.M.; Mohren, G.M.J. & Kimani, J.N. (2009). Prediction of Prosopisspecies invasion
in Kenya using geographical information system techniques. African Journal of
Ecology, Vol. 48, pp. 628–636.
Mworia, J.K.; Kinyamario, J.I. & Githaiga, J.M. (2008a). Influence of cultivation, settlements
and water resources on wildlife distribution and habitat selection in south-east
Kajiado, Kenya. Environmental Conservation, Vol. 35, No. 2, pp. 117-124
Mworia J.K.; Wambua, J.K.; Omari, J. K. & J.I. Kinyamario. (2011). Patterns of seed dispersal
and establishment of the invader Prosopis juliflora in the upper floodplain of Tana
river, Kenya. African Journal of Range and Forage Science, Vol. 28, No. 1, pp.35-41.
Mworia, J.K.; Kinyamario, J.I.; & John, E.A. (2008b). Impact of the invader Ipomoea
hildebrandtii on grass biomass, nitrogen mineralization and determinants of its
seedling establishment in Kajiado, Kenya. African Journal of Range and Forage Science,
Vol.25, pp. 11–16.
Myers, J.H. & Bazely, D.R. (2003). Ecology and Control of Introduced Plants. Cambridge:
Cambridge University Press.
Nair, P.K.R .(ed). (1989). Agroforestry systems in the tropics. Kluwer Academic Publishers
Oba, G.; Stenseth, N.C. & Weldaji, R.B. (2002). Impacts of shifting agriculture on a floodplain
woodland regeneration in dryland, Kenya. Agriculture, Ecosystems & Environment,
Vol. 90, pp.211-216.
Pasiecznik, N.M.; Felker, P.; Harris, P.J.C.; Harsh, LN.; Cruz, G.; Tewari, J.C.; Cadoret, K. &
Maldonado, LJ. (2001). The Prosopis juliflora - Prosopis pallida Complex: A Monograph.
HDRA, Coventry, UK. Academic Press, San Diego, CA.
Richardson, D.M.; Pysek, P.; Rejmanek, M.; Barbour, M.I.G.; Panetta, F.D. & West, C.J.
(2000). Naturalization and invasion of alien plants: concepts and definition.
Diversity and Distributions, Vol.6, pp. 93- 107
Rossiter, N.A.; Setterfield, S.A.; Douglas, M.M. & Hutley, L.B. (2003). Testing the grass-fire
cycle: exotic grass invasion in the tropical savannas of northern Australia. Diversity
and Distributions, Vol. 9, pp. 169–176.
Sala, O.E.; Chapin, F.S.; Armesto, J.J.; Berlow, E.; Bloomfield, J.; Dirzo, R; Huber-Sanwald, E.;
Huenneke. L.F.; Jackson, R.B.; Kinzig, A.; Leemans, R.; Lodge, D.M.; Mooney, H.A.;
Oesterheld, M.; Poff, N.L; Sykes, M.T.; Walker, B.H.; Walker, M. & Wall, D.H.
(2000). Global biodiversity scenarios for the year 2100. Science, Vol. 287, pp.1770–
1774
Sankaran M. (2005).Determinants of woody cover in African savannas. Nature Vol. 438, No.
8, pp. 846-849
Sankaran, M.; Ratnam, J. & Hanan, N.P. (2004). Tree grass coexistence in savannas
revisited—insights from an examination of assumptions and mechanisms invoked
in existing models.
Ecol. Letters, Vol. 7
, pp.480–-490.
Scholes, R.J. & Archer, S.R.(1997). Tree–-grass interactions in savannas. Annu. Rev. Ecol. Syst.
Vol.28, pp.517–-544.
Biomass and Remote Sensing of Biomass
56
Scholes, R.J. & Hall, D. (1996). The carbon budget of tropical savannas, woodlands and
grasslands. In: Global change, effects on coniferous forest and grasslands. SCOPE (Eds)
Breymeyer A.I., I.D. Hall, J.M. Melillo and G.I. Agren, pp. 69–100. John Wiley, New
York.
Scholes, R.J.; Dowty, P.R.; Caylor, K.; Parsons, D.A.B.; Frost, P.G.H. & Shugart, H.H. (2002).
Trends in savanna structure and composition along an aridity gradient in the
Kalahari. Journal of Vegetation Science, Vol.13, pp.419–428.
Scurlock, J.M.O. & Hall, D.O. (1998) The global carbon sink, a grassland perspective. Global
Change Biology, Vol.4, pp.229–233.
Setterfield, S.A. (2002). Seedling establishment in an Australian tropical savanna: effects of
seed supply, soil disturbance and fire. Journal of Applied Ecology Vol.39, pp.949–959
Singh, J.S. & Joshi, M.C. (1979). Tropical grasslands primary production, In: Grassland
Ecosystems of the World, IBP Vol. 18, . RT. Coupland (ed) .Cambridge University
Press, Cambridge.
Smith, S.D.; Huxman, T.E.; Zitzer, S.F; Charlet, T.N.; Housman, D.C.; Coleman, J.S.;.
Fenstermakerk, L.K.; Seemann, J.R. & Nowak, R.S. (2000). Elevated CO
2
increases
productivity and invasive species success in an arid ecosystem. Nature, Vol. 408, pp.
79-82
Stave, J.; Oba, G.; Bjora, C.S.; Mengistu, Z.; Nordal, I. & Stenseth, N.C. (2003). Spatial and
temporal woodland patterns along the lower Turkwel River, Kenya. African Journal
of Ecology, Vol. 41, pp.224-236.
Walter, H. (1971) Ecology of tropical and subtropical vegetation. Oliver and Boyd, Edinburgh.
Williams, D.G. & Baruch, Z. (2000). African grass invasion in the Americas: ecosystem
consequence and the role of ecophysiology. Biological Invasions, Vol. 2, pp.123–140
Williams, R ; Gill, A.M. & Moore, P.H.R. (1998). Seasonal changes in fire behavior in a
tropical savanna in northern Australia. International Journal of Wildland Fire, Vol.8,
pp.227–239.
World Wildlife Fund. (2007). Llanos, In: Encyclopedia of Earth, Retrieved January 23, 2011,
Available from
4
Zooplankton Abundance, Biomass and
Trophic State in Some Venezuelan Reservoirs
Ernesto J. González, María L. Matos,
Carlos Peñaherrera and Sandra Merayo
Universidad Central de Venezuela, Instituto de Biología Experimental, Caracas,
Venezuela
1. Introduction
The zooplankton community in freshwater bodies is composed principally of protozoa
(flagellates and ciliates; from just a few to hundreds of micrometres), rotifers (from 30µm to
1mm) and crustaceans (copepods and cladocerans, some hundreds of µm up to 1cm), as well
as insect larvae (such as Chaoborus), freshwater jellyfish (Craspedacusta), ostracods (Cypria),
aquatic mites (Hydracarina), fish larvae and even trematode cercariae (Infante, 1988;
Lampert & Sommer, 1997; Rocha et al., 1999; Conde-Porcuna et al., 2004). This community
represents a vital component in the food web of aquatic ecosystems (López et al., 2001).
Especially in dammed rivers, information on the zooplankton community is important for
the analysis of the functioning of these ecosystems and for the establishment of management
policies for water use.
The density of zooplankton, expressed as the number of organisms per unit of area or
volumen, does not necessarily provide exact information about the actual biomass of this
community, since this consists of a huge variety of taxa with a wide size range (Matsumura-
Tundisi et al., 1989). Zooplankton biomass is also an important and necessary parameter for
calculating the secondary production of this community (Melão & Rocha, 2004). Thus, the
estimation of the dry weight of zooplankton species is a more useful variable for the study
of trophic structure in aquatic ecosystems than density, especially considering its
relationship with the trophic states of the water bodies (Rocha et al., 1995).
In Venezuela, there is little data on the dry weight of zooplankton or their biomass (González
et al., 2008). Although this country has over 100 operating reservoirs (MINAMB, 2007),
information on the ecological aspects of zooplankton is only available for about 20% (López et
al., 2001). In this study we aimed to establish the relationships between the abundance and
biomass of the zooplankton with phytoplankton biomass (estimated as chlorophyll a) and the
trophic states of reservoirs, using data collected from 13 of these water bodies.
2. Study areas
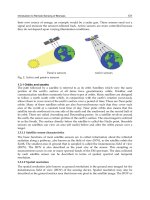
We collected plankton samples from the following reservoirs, distributed in the
northeastern and north central regions of Venezuela: 1) Agua Fría, 2) Taguaza, 3) Lagartijo,
4) Clavellinos, 5) Tierra Blanca, 6) El Pueblito, 7) El Cigarrón, 8) El Cují, 9) El Andino, 10) La
Mariposa, 11) La Pereza, 12) Quebrada Seca and 13) Suata (Figure 1).
Biomass and Remote Sensing of Biomass
58
Fig. 1. Map of Venezuela, showing the relative locations of the reservoirs studied. For
reservoir names, see numbers in text.
Some of the main morphometric features of the reservoirs surveyed are shown in Table 1.
Reservoir
Mean depth
(m)
Area
(m
2
)
Volume
(m
3
)
Residence time
(d)
Location
Agua Fría 13.2 440,000 5,800,000 38 10º23’ N - 67º10’ W
Taguaza 20.6 6,490,000 134,000,000 40 10º10’ N - 66º26’ W
Lagartijo 17.7 4,510,000 80,000,000 243 10º11’ N - 66º43’ W
Clavellinos 12.5 10,500,000 131,000,000 106 10°21’ N - 63°36’ W
Tierra Blanca 12.5 400,000 5,000,000 144 9º58' N - 67º25' W
El Pueblito 6.4 49,500,000 315,000,000 152 9º12’ N - 65º34’ W
El Cigarrón 4.9 50,500,000 246,000,000 158 9º12’ N - 65º40’ W
El Cují 3.9 12,720,000 49,310,000 375 9º37’ N - 65º14’ W
El Andino 7.9 1,780,000 14,000,000 167 9º32’ N - 65º09’ W
La Mariposa 13.0 540,000 7,000,000 12 10º24’ N - 66º33’ W
La Pereza 14.2 562,500 8,000,000 12 10º27’ N - 66º46’ W
Quebrada Seca 7.9 950,000 7,500,000 17 10º13’ N - 66º43’ W
Suata 5.1 8,498,00 43,540,000 84 10°12’ N - 67°23’ W
Table 1. Mean morphometric features of the studied reservoirs.
Zooplankton Abundance, Biomass and Trophic State in Some Venezuelan Reservoirs
59
3. Methods
The data analyzed was taken from the results of 6-12 monthly sampling periods at each
reservoir. Samples for estimating phytoplankton biomass (as chlorophyll a) were collected
using an opaque van Dorn bottle (3 – 5 liters) from the euphotic layer of reservoirs and
preserved in cold and dark conditions until their analysis in the laboratory. Chlorophyll a
concentration was estimated by extraction of the photosynthetic pigments with ethanol after
filtering with Whatman glass-fiber filters (Nusch & Palme, 1975). Zooplankton samples were
obtained from the limnetic zone of the water bodies using vertical trawls in the oxygenated
strata with a plankton tow net (77µm mesh). Samples were preserved in 4% formaldehyde
(final concentration). Abundance was determined by counting animals in Sedgwick-Rafter
chambers (1ml), according to Wetzel & Likens (2000) and biomass was estimated as dry
weight (d.w.) after desiccation at 60°C for about 20-24 h, according to Edmondson &
Winberg (1971). Parametric correlations were determined using the PAST program
(Hammer et al., 2001).
4. Results
4.1 Description of reservoirs and phytoplankton biomass
Agua Fría (AFR): Located within a protected area (Macarao National Park, Miranda
State). Used to supply drinking water to the city of Los Teques (population
approximately 172,000). This reservoir shows low nutrient concentrations, but the water
level has declined over the years due to the increase in the demand for drinking water.
Meromictic with a tendency to warm monomictic, following Lewis’ (1983) criteria;
shows hypolimnetic anoxia during the rainy season (González et al., 2004).
Taguaza (TAG): Located within a protected area (Guatopo National Park, Miranda
State). Used to supply drinking water to areas surrounding the city of Caracas
(population approximately 4 million). Shows low nutrient concentrations. Meromictic
with a tendency to warm monomictic and with permanent hypolimnetic anoxia
(González et al., 2002).
Lagartijo (LAG): Located within a protected area (Guatopo National Park, Miranda
State). Used to supply drinking water to the city of Caracas (population approximately
4 million). Shows low nutrient concentrations, but due to the increasing demand for
water by the metropolitan area of Caracas, water is pumped to the reservoir from the
Tuy river (a highly contaminated river) after sedimentation and chlorination, although
this pumped water only affects a small part of the water body. Meromictic with a
tendency to warm monomictic and with nearly permanent hypolimnetic anoxia (Infante
et al., 1992; Infante & O. Infante, 1994; Ortaz et al., 1999).
Clavellinos (CLA): Located in Sucre State and used to supply drinking water to the
town of Carúpano and Nueva Esparta State (population 512,366) as well as for
irrigation. High nitrate concentrations were detected in its waters, possibly from the use
of fertilizers on the surrounding land. Warm monomictic; shows anoxic conditions in
the hypolimnion during the rainy season (Merayo & González, 2010).
Tierra Blanca (TBL): Situated in Guárico State and used to supply drinking water to the
city of San Juan de Los Morros (population 85,000); it is also used for recreational
purposes. Its drainage basin is partially protected, although this is limited by free public
Biomass and Remote Sensing of Biomass
60
access. Its water level fluctuates strongly due to demand. Meromictic with a tendency to
warm monomictic and with nearly permanent hypolimnetic anoxia (González, 2006).
El Pueblito (EPU): Located in Guárico State and used for flood control, subsistence
agriculture, irrigation and recreation. Shows moderate nutrient concentrations.
Classified as warm monomictic according to the criteria of Hutchinson (1957) and Lewis
(1983), with hypolimnetic anoxia during the rainy season (González, 2000a).
El Cigarrón (ECI): Located in Guárico State and used for flood control, subsistence
agriculture and irrigation. Shows high nutrient concentrations due to the use of
fertilizers in the surrounding areas. Warm monomictic; with hypolimnetic anoxia
during the rainy season (Unpublished data).
El Andino (EAN): Located in Anzoátegui State. Used for subsistence agriculture and
irrigation. Shows moderate nutrient concentrations due to the use of fertilizers in the
surrounding areas. Warm monomictic; with hypolimnetic anoxia during the rainy
season (Infante et al., 1995; González, 2000b).
El Cují (ECU): Situated in Anzoátegui State and used for the supply of drinking water
to the towns of Onoto and Zaraza, as well as for flood control and irrigation. Warm
monomictic; with hypolimnetic hypoxia and anoxia during the rainy season (Infante et
al., 1995).
La Mariposa (LMA): This is an urban reservoir, located 8 km from the city of Caracas
(population approximately 4 million) and used to supply drinking water as well as for
recreation. The catchment area is highly intervened and its waters show high nutrient
concentrations, which has recently produced excessive growth of the macrophyte
Eichhornia crassipes. In spite of low residence time, its waters show thermal stratification
during the rainy season, when hypoxic conditions may also be detected in the
hypolimnion (Ortaz et al., 1999).
La Pereza (LPE): Located in Miranda State and used for recreational purposes and the
supply of drinking water to areas surrounding Caracas (population approximately 4
million). Its waters show high nutrient concentrations, which come from nearby pig and
chicken farms, as well as waste waters from a galvanized steel factory. Warm
monomictic; with anoxic conditions in the hypolimnion during the rainy season (Ortaz
et al., 1999).
Quebrada Seca (QSE): Located in Miranda State and used for purifying untreated water
from the Tuy river before pre treating and pumping it to the Lagartijo reservoir, from
which it is used to supply drinking water to Caracas. Its catchment area is highly
intervened, with surrounding rural communities that discharge their wastewaters
directly into the reservoir. It mixes only once a year (warm monomictic) and shows
hypolimnetic anoxia during the rainy season (Ortaz et al., 1999).
Suata (SUA): Located in Aragua State and used to supply water for subsistence
agriculture and cattle ranching. This reservoir is fed by the Aragua river which collects
the wastewaters of several populations along its course that are then deposited into the
reservoir without prior treatment. It is polymictic, due to the shallowness of its waters
(González et al., 2009).
The reservoirs represent a gradient of different trophic states, from ultra-oligotrophic (Agua
Fría and Taguaza) to hypertrophic (Quebrada Seca, La Mariposa and Suata), according to
their total phosphorus concentration following Salas & Martinó (1991), and determined by
the authors cited for each reservoir description. Phytoplankton biomass, estimated as the
Zooplankton Abundance, Biomass and Trophic State in Some Venezuelan Reservoirs
61
concentration of chlorophyll a in the euphotic zone of each water body, also reflects the
trophic state of the reservoirs (Table 2). The mean values of both total phosphorus and
chlorophyll a for the euphotic zone of these reservoirs varied between 4 and more than 1500
µg/l and between 2.16 and 92.89 µg/l, respectively, for Agua Fría (the most oligotrophic)
and Suata (the most eutrophicated) reservoirs.
4.2 Zooplankton abundance and biomass
The variation intervals of the abundance and biomass of the zooplankton for each of the
reservoirs surveyed are shown in Table 3. The dominant zooplankton taxa for each water
body are also specified.
Copepods were the dominant group in 8 of the 13 reservoirs sampled (Agua Fría, Taguaza,
Lagartijo, Clavellinos, El Pueblito, El Cigarrón, El Cují and La Mariposa) and second in
numeric abundance in the El Andino reservoir, where rotifers were the most dominant.
Ostracods dominated in the Tierra Blanca and Suata reservoirs and protozoa showed the
highest relative abundances in La Pereza and Quebrada Seca. The relative proportions of the
different zooplankton taxa are shown in Figure 2. It can be appreciated that copepods were
the dominant group in all of the ultra-oligotrophic and oligotrophic reservoirs, but as the
trophic state of the water bodies increased other taxa became more abundant.
Reservoir
Total P
(µg/l)
Chlorophyll a
(µg/l)
Trophic state
Agua Fría 6.57 2.27 Ultra-oligotrophic
Taguaza 8.63 4.67 Ultra-oligotrophic
Lagartijo 17.08 5.78 Oligotrophic
Clavellinos 9.60 15.41 Oligotrophic
Tierra Blanca 23.11 11.66 Oligo-mesotrophic
El Pueblito 21.31 8.46 Oligotrophic
El Cigarrón 37.21 6.71 Mesotrophic
El Cují 23.58 11.05 Oligo-mesotrophic
El Andino 25.60 26.10 Mesotrophic
La Mariposa 136.83 41.92 Hypertrophic
La Pereza 94.64 44.36 Eutrophic
Quebrada Seca 121.25 62.71 Hypertrophic
Suata 1616,43 92.89 Hypertrophic
Table 2. Mean values of total P, chlorophyll a and trophic state in the studied reservoirs.
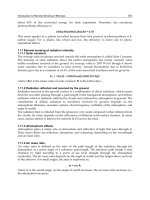
It can be observed that in general, as the trophic state of the reservoir increases, the mean
abundances of the zooplankton also seem to increase. This can be seen from Figure 3, where
the abundance and biomass of the zooplankton were ordered according to the mean
concentrations of chlorophyll a in the water bodies. Thus, the lowest phytoplankton biomass
values (as chlorophyll a) and the lowest abundance and biomass values of the zooplankton
are found in the ultra-oligotrophic reservoirs (24 individuals/l and 48.51 µg d.w./l in Agua
Fría, and 86 individuals/l and 28.71 µg d.w./l in Taguaza), whilst the highest
Biomass and Remote Sensing of Biomass
62
Fig. 2. Relative proportion of zooplankton groups in the studied reservoirs. AFR: Agua Fría,
TAG: Taguaza, LAG: Lagartijo, CLA: Clavellinos, TBL: Tierra Blanca, EPU: El Pueblito, ECI:
El Cigarrón, ECU: El Cují, EAN: El Andino, LMA: La Mariposa, LPE: La Pereza, QSE:
Quebrada Seca, SUA: Suata.
phytoplankton biomass values and the highest mean abundance and biomass values of the
zooplankton are found in the hypertrophic reservoirs (1130 individuals/l and 1127.26 µg
d.w./l in Quebrada Seca, and 753 individuals/l and 2026.14 µg d.w./l in Suata).
Given the associations found between the phytoplankton and zooplankton, we explored the
relationships between phytoplankton biomass, zooplankton abundance and zooplankton
biomass in greater detail using a further set of graphs: 1) Chlorophyll a vs zooplankton
abundance (Figure 4), 2) chlorophyll a vs zooplankton biomass (Figure 5) and 3)
zooplankton abundance vs zooplankton biomass (Figure 6). The relationships between these
parameters are presented using both the raw and logarithmically transformed data, in order
to see which gives a better fit.
From Figure 4 we can see that there is a good fit between the mean chlorophyll a values of
the water bodies and the mean abundance of the zooplankton, either when the raw data
were used (Figure 4a) or after logarithmic transformation (Figure 4b). In both cases the
relationship best fitted to a straight line, and the linear regression coefficients were higher
than 0.60 and statistically significant (p<0.05).
Figure 5 shows another good fit, this time between the mean chlorophyll a values and mean
zooplankton biomass, either when using the raw (Figure 5a) or logarithmically transformed
(Figure 5b) data. In both cases, as for the relationship between phytoplankton biomass and
zooplankton abundance, the association was linear; although the linear regression
coefficients were lower, they remained statistically significant (p<0.05).
Figure 6 shows that the relationship between the abundance and biomass of the
zooplankton can also be described linearly, both with the raw (Figure 6a) and
logarithmically transformed (Figure 6b) data.
Zooplankton Abundance, Biomass and Trophic State in Some Venezuelan Reservoirs
63
Reservoir
Abundance (Ind./l)
Min. – Max.
(Mean ± S.D.)
Biomass (µg/l)
Min. – Max.
(Mean ± S.D.)
Dominant zooplankton
group
Agua Fría
9.68 – 39.41
(23.91 ± 8.98)
11.56 – 123.44
(48.51 ± 32.08)
Copepods
Taguaza
43.86 – 150.00
(85.58 ± 29.79)
3.82 – 55.03
(28.71 ± 15.91)
Copepods
Lagartijo
34.00 – 373.00
(155.64 ± 128.34)
82.43 – 863.78
(251.31 ± 218.53)
Copepods + Rotifers
Clavellinos
30.48 – 99.94
(61.84 ± 22.33)
97.40 – 1406.29
(504.28 ± 351.84)
Copepods
Tierra Blanca
131.80 – 688.67
(309.16 ± 187.14)
100.08 – 2307.10
(607.21 ± 571.54)
Ostracods
El Pueblito
73.00 – 218.00
(123.17 ± 41.17)
69.80 – 228.10
(127.25 ± 49.77)
Copepods
El Cigarrón
35.00 – 272.00
130.00 ± 69.66)
40.00 – 360.00
(164.67 ± 103.86)
Copepods
El Cují
125.50 – 330.60
(228.05 ± 145.03)
141.37 – 1643.14
(1092.40 ± 546.93)
Copepods
El Andino
8.80 – 616.40
(287.89 ± 201.36)
402.98 – 634.67
(381.72 ± 169.46)
Rotifers + Copepods
La Mariposa
111.00 – 669.00
(423.33 ± 182.13)
154.83 – 1297.77
(787.42 ± 355.74)
Copepods
La Pereza
32.00 – 643.00
(278.40 ± 262.17)
20.09 – 184.18
(121.77 ± 79.50)
Protozoans
Quebrada Seca
98.00 – 2472.00
(1129.80 ± 871.30)
259.46 – 1833.49
(1127.26 ± 710.50)
Protozoans
Suata
133.76 – 2518.47
(752.93 ± 678.60)
305.73 – 13853.50
(2026.14 ± 3757.81)
Ostracods
Table 3. Zooplankton abundance, biomass and dominant groups in the studied reservoirs.
Biomass and Remote Sensing of Biomass
64
Fig. 3. Mean values of chlorophyll a, zooplankton abundance and biomass in the studied
reservoirs. AFR: Agua Fría, TAG: Taguaza, LAG: Lagartijo, CLA: Clavellinos, TBL: Tierra
Blanca, EPU: El Pueblito, ECI: El Cigarrón, ECU: El Cují, EAN: El Andino, LMA: La
Mariposa, LPE: La Pereza, QSE: Quebrada Seca, SUA: Suata.
Zooplankton Abundance, Biomass and Trophic State in Some Venezuelan Reservoirs
65
Fig. 4. Relationship between chlorophyll a and zooplankton abundance: a) Raw data, b)
logarithmically transformed data. For reservoir names, see Figures 2 & 3.
Biomass and Remote Sensing of Biomass
66
Fig. 5. Relationship between chlorophyll a and zooplankton biomass: a) Raw data, b)
logarithmically transformed data. For reservoir names, see Figures 2 & 3.
Zooplankton Abundance, Biomass and Trophic State in Some Venezuelan Reservoirs
67
Fig. 6. Relationship between zooplankton abundance and biomass: a) Raw data, b)
logarithmically transformed data. For reservoir names, see Figures 2 & 3.
Biomass and Remote Sensing of Biomass
68
As for the associations shown in Figures 4 and 5, the linear regression coefficients for
zooplankton abundance vs biomass were also statistically significant (p<0.05) and higher
than 0.51.
The linear correlation coefficients (r) between these variables were also calculated and were
also statistically significant (p<0.05), as was to be expected from the linear regressions
obtained:
- Chlorophyll a vs. zooplankton abundance; r= 0.778.
- Chlorophyll a vs. zooplankton biomass; r= 0.718.
- Zooplankton abundance vs. zooplankton biomass; r= 0.751.
5. Discussion and final considerations
The majority of the reservoirs included in this study show a tight linear relationship
between total phosphorus and the concentration of chlorophyll a; thus these variables are
good predictors of their trophic state (González, 2008; González & Quirós, submitted).
Reservoirs whose drainage basins are protected or in areas with low anthropogenic impact
show the lowest total phosphorus and chlorophyll values, whilst those found in degraded
catchment areas give the highest values.
As regards the zooplankton, Matsumura-Tundisi (1997) suggests that an understanding of
the population dynamics of the different groups constitutes a useful tool for the
management of reservoirs, since the composition, abundance and spatial distribution of the
zooplankton communities are strongly related to their trophic state and the degree of
biological interactions that occur within them, and that furthermore, the prevalence of
certain species could indicate of the trophic state of the ecosystem.
According to Esteves (1998), an increase in phytoplankton primary production due to
eutrophication has immediate effects on heterotrophic organisms, considerably increasing
their production. As for phytoplankton, the specific composition of zooplankton and the
relative density of each species changes with eutrophication (Esteves, 1998; Pinto-Coelho et
al., 2005; Leitão et al., 2006; Landa et al., 2007; Tundisi et al., 2008). Thus many species either
reduce in abundance or disappear completely, and are substituted by others that take over
as the dominant zooplankton taxa. For example, Infante & Riehl (1984) suggested that
pelagic cladocerans, such as Ceriodaphnia cornuta, Diaphanosoma sp. and Moina micrura, may
be more susceptible to the proliferation of cyanobacteria than copepods and rotifers in
highly eutrophicated systems. In most cases, cyanobacteria negatively affect zooplankton
(Zhao et al., 2008).
As far as we are aware this is the first comparative analysis of the relationships between the
abundance and biomass of the zooplankton and phytoplankton biomass in reservoirs with
different trophic states in Venezuela that takes into account the mean annual cycles of these
three variables. Several previous studies only consider fluctuations in the abundance and
biomass of zooplankton with respect to physicochemical changes and phytoplankton
abundance and biomass (Infante, 1993; Infante et al., 1995; Mendoza, 1999; Carrillo, 2001;
González et al., 2002; Gavidia, 2004; González, 2006; Cabrera, 2009; Merayo & González,
2010). In some of these investigations, statistically significant correlations between
phytoplankton and zooplankton were not found, especially in eutrophic systems, where
links between the two communities may be weakened by the proliferation of microalgae
that are not the preferred food of zooplankton (McQueen et al., 1986). In these cases,
zooplankton dynamics were registered as being principally determined by environmental
Zooplankton Abundance, Biomass and Trophic State in Some Venezuelan Reservoirs
69
fluctuations, although some of the abundance and biomass peaks coincided with peaks of
chlorophyll a concentrations. In contrast, in several oligotrophic systems, such as the Agua
Fría and Taguaza reservoirs in this study (González et al., 2002; González, 2006) and the
Jucazinho reservoir in Brazil (Mélo-Júnior et al. 2007), significant correlations between
phyto- and zooplankton have been reported.
From the analyses done in this study, it seems common that in water bodies with a higher
degree of eutrophication, zooplankton abundance and biomass are higher compared to
oligotrophic reservoirs. This relationship has been reported in other comparative studies of
these variables in water bodies with contrasting trophic states in both Venezuela and Brazil
(González et al., 2002; González, 2006; Sendacz et al., 2006; Blettler & Bonecker, 2007), the
only countries in which these types of investigations have been done within the South
American tropics (González et al., 2008).
From this study it can be observed that the association between phytoplankton biomass and
the abundance and biomass of the zooplankton is not perfect (see Fig. 3). The explanation
for this is indicated by Fig. 2, however, which gives the relative proportions of the different
zooplankton groups, as well as the information given in Tables 2 and 3.
As has already been mentioned, copepods dominate in the oligotrophic environments
considered in this study, but as the trophic state increases, the relative abundances of other
groups also increase. Thus, the lack of association between the variables could be due to the
dominance of zooplankton taxa with small sized species, which contribute little in terms of
weight to the total zooplankton biomass. In contrast, copepods contribute more to total
zooplankton biomass in many fresh water bodies due to their larger sizes and heavier dry
weights (Infante, 1993; Infante et al., 1995; Castilho-Noll & Arcifa, 2007; González et al, 2008;
Merayo & González, 2010).
Sendacz et al. (2006) affirm that rotifers tend to dominate zooplankton communities in
tropical and sub-tropical lakes and reservoirs, independently of their trophic state, but due
to their small size and light weight, often contribute little to total zooplankton biomass. This
could explain the lack of a perfect association between zooplankton abundance and biomass
in the Venezuelan reservoirs studied.
In contrast to that indicated by Sendacz et al. (2006), the zooplankton community in most
Venezuelan reservoirs seems to be dominated by copepods (López et al., 2001). This agrees
with our results where copepods were the dominant group in 8 out of the 13 Venezuelan
reservoirs studied. This could be promoted by high water residence times that favor species
with relatively long development cycles (Santos-Wisniewski & Rocha, 2007). The dominance
by groups other than copepods in Venezuelan systems could be related to factors such as
temperature, the quantity and quality of available food, species genotypes, climatic periods
and differences in habitat conditions, among others (Gavidia, 2004; Sendacz et al., 2006;
Mustapha, 2009; Merayo & González, 2010).
In spite of the lack of a perfect fit between phytoplankton biomass and the abundance and
biomass of zooplankton, strong linear relationships between the annual means were found.
Thus, in the same way as for the strong linear relationships found between nutrients and
phytoplankton biomass in Venezuelan reservoirs (González, 2008; González & Quirós,
submitted), a strong linear association was also found between zooplankton abundance and
biomass, between each of these and phytoplankton biomass (estimated as chlorophyll a),
and between all these variables and the trophic state of the reservoirs.
Biomass and Remote Sensing of Biomass
70
Due to the fact that zooplankton dynamics are associated with the effects of anthropogenic
activities in the drainage basins of these fresh water bodies (Infante, 1993), the identification
of the dominant taxa (composition), and estimates of their abundance and biomass provide
us with valuable tools for the determination of the trophic state, and thus should be taken
into account when designing policies for the adequate management of reservoirs in
Venezuela.
6. Acknowledgments
The authors would like to thank the Organization of American States, Fondo Nacional de
Ciencia y Tecnología (Project S1-98-1361), Consejo de Desarrollo Científico y Humanístico –
UCV (Projects 03.33.4728.2000 and 03.00.6495.2006), Hydrological Companies HIDROVEN,
HIDROCAPITAL, HIDROCARIBE and HIDROPAEZ, Ministerio del Ambiente for logistic
and financial support. We also thank Mario Ortaz for field and laboratory assistance and
discussions on zooplankton. We would also like to thank the Coordinación de Investigación,
Ciencias – UCV and Frances Osborn who helped with the translation of the manuscript into
English.
7. References
Blettler, M.C.M. & Bonecker, C.C. (2007). Longitudinal distributions of microcrustacean
biomass in three tropical reservoirs (Paraná State, Brazil). Acta Scientiarum -
Biological Sciences, Vol. 29, No. 3 (September 2007), pp. 293-304. ISSN 1679-9283.
Cabrera, A. (2009). Variaciones espaciales y temporales de la comunidad zooplanctónica en
dos localidades del embalse Suata (Estado Aragua, Venezuela). Universidad
Central de Venezuela, Thesis, Caracas.
Carrillo, V. (2001). Distribución espacial del zooplancton en el embalse La Mariposa (Distrito
Capital) de julio a diciembre de 2000. Universidad Central de Venezuela, Thesis,
Caracas.
Castilho-Noll, M.S.M. & Arcifa, M.S. (2007). Length-weight relationships for zooplanktonic
species of a tropical Brazilian lake: Lake Monte Alegre. Acta Limnologica Brasiliensia,
Vol. 19, No.1 (June, 2007), pp. 93-100. ISSN 0102-6712.
Conde-Porcuna, J.M., Ramos-Rodríguez, E., & Morales-Baquero, R. (2004). El zooplancton
como integrante en la estructura trófica de los sistemas acuáticos lénticos.
Ecosistemas, Vol. 13, No. 2 (May 2004), pp. 23-29. ISSN 1697-2473.
Edmondson, W.T. & Winberg, G.G. (1971). A manual of methods for the measurement of
secondary productivity in fresh waters. International Biological Programme Handbook
Nº 17, ISBN 0-632-00610-1, Oxford.
Esteves, F.A. (1998). Fundamentos de Limnologia (2
nd
edition), Editorial Interciencia, ISBN 85-
7193-008-2, Rio de Janeiro.
Gavidia, J. (2004). Variaciones de abundancia y biomasa del zooplancton en dos localidades
del embalse Tierra Blanca (Edo. Guárico, Venezuela). Universidad Central de
Venezuela, Thesis, Caracas.
González, E.J. (2000a). Caracterización limnológica del embalse El Pueblito (Estado Guárico,
Venezuela). Trabajo de Ascenso a la Categoría de Profesor Agregado. Universidad
Central de Venezuela, Monograph, Caracas.