Biomass and Remote Sensing of Biomass Part 8 pot
Bạn đang xem bản rút gọn của tài liệu. Xem và tải ngay bản đầy đủ của tài liệu tại đây (2.18 MB, 20 trang )
Introduction to Remote Sensing of Biomass
131
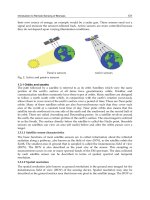
their own source of energy; an example would be a radar gun. These sensors send out a
signal and measure the amount reflected back. Active sensors are more controlled because
they do not depend upon varying illumination conditions.
Passive sensors Active sensors
Fig. 2. Active and passive sensors
1.3.1 Orbits and swaths
The path followed by a satellite is referred to as its orbit. Satellites which view the same
portion of the earth’s surface at all times have geostationary orbits. Weather and
communication satellites commonly have these types of orbits. Many satellites are designed
to follow a north south orbit which, in conjunction with the earth’s rotation (west-east),
allows them to cover most of the earth’s surface over a period of time. These are Near-polar
orbits. Many of these satellites orbits are also Sun-synchronous such that they cover each
area of the world at a constant local time of day. Near polar orbits also means that the
satellite travels northward on one side of the earth and the southward on the second half of
its orbit. These are called Ascending and Descending passes. As a satellite revolves around
the earth, the sensor sees a certain portion of the earth’s surface. The area imaged is referred
to as the Swath. The surface directly below the satellite is called the Nadir point. Steerable
sensors on satellites can view an area (off nadir) before and after the orbits passes over a
target.
1.3.1.1 Satellite sensor characteristics
The basic functions of most satellite sensors are to collect information about the reflected
radiation along a pathway, also known as the field of view (FOV), as the satellite orbits the
Earth. The smallest area of ground that is sampled is called the instantaneous field of view
(IFOV). The IFOV is also described as the pixel size of the sensor. This sampling or
measurement occurs in one or many spectral bands of the EM spectrum. The data collected
by each satellite sensor can be described in terms of spatial, spectral and temporal
resolution.
1.3.1.2 Spatial resolution
The spatial resolution (also known as ground resolution) is the ground area imaged for the
instantaneous field of view (IFOV) of the sensing device. Spatial resolution may also be
described as the ground surface area that forms one pixel in the satellite image. The IFOV or
Biomass and Remote Sensing of Biomass
132
ground resolution of the Landsat Thematic Mapper (TM) sensor, for example, is 30 m. The
ground resolution of weather satellite sensors is often larger than a square kilometre. There
are satellites that collect data at less than one meter ground resolution but these are
classified military satellites or very expensive commercial systems.
1.3.1.3 Temporal resolution
Temporal resolution is a measure of the repeat cycle or frequency with which a sensor
revisits the same part of the Earth’s surf ace. The frequency will vary from several times per
day, for a typical weather satellite, to 8—20 times a year for a moderate ground resolution
satellite, such as Landsat TM. The frequency characteristics will be determined by the design
of the satellite sensor and its orbit pattern
1.3.1.4 Spectral resolution
The spectral resolution of a sensor system is the number and width of spectral bands in the
sensing device. The simplest form of spectral resolution is a sensor with one band only,
which senses visible light. An image from this sensor would be similar in appearance to a
black and white photograph from an aircraft. A sensor with three spectral bands in the
visible region of the EM spectrum would collect similar information to that of the human
vision system. The Landsat TM sensor has seven spectral bands located in the visible and
near to mid infrared parts of the spectrum.
A panchromatic image consists of only one band. It is usually displayed as a grey scale
image, i.e. the displayed brightness of a particular pixel is proportional to the pixel digital
number which is related to the intensity of solar radiation reflected by the targets in the
Fig. 3. Electromagnetic radiation spectrum with different resolution bands
Introduction to Remote Sensing of Biomass
133
pixel and detected by the detector. Thus, a panchromatic image may be similarly interpreted
as a black-and-white aerial photograph of the area, though at a lower resolution.
Multispectral and hyperspectral images consist of several bands of data. For visual display,
each band of the image may be displayed one band at a time as a grey scale image, or in
combination of three bands at a time as a color composite image. Interpretation of a
multispectral color composite image will require the knowledge of the spectral reflectance
signature of the targets in the scene.
1.3.2 Platforms
Aerial photography has been used in agricultural and natural resource management for
many years. These photographs can be black and white, colour, or colour infrared.
Depending on the camera, lens, and flying height these images can have a variety of
scales. Photographs can be used to determine spatial arrangement of fields, irrigation
ditches, roads, and other features or they can be used to view individual features within a
field.
Infrared images can detect stress in crops before it is visible with the naked eye. Healthy
canopies reflect strongly in the infrared spectral range, whereas plants that are stressed will
reflect a dull colour. These images can tell a farmer that there is a problem but does not tell
him what is causing the problem. The stress might be from lack of water, insect damage,
improper nutrition or soil problems, such as compaction, salinity or inefficient drainage. The
farmer must assess the cause of the stress from other information. If the dull areas disappear
on subsequent pictures, the stress could have been lack of water that was eased with
irrigation. If the stress continues it could be a sign of insect infestation. The farmer still has
to conduct in-field assessment to identify the causes of the problem. The development of
cameras that measure reflectance in a wider range of wavelengths may lead to better
quantify plant stress. The uses of these multi-spectral cameras are increasing and will
become an important tool in precision agriculture.
Satellite remote sensing is becoming more readily available for use in precision agriculture.
The Landsat and the NOAA polar-orbiting satellites carry instruments that can be used to
determine crop types and conditions, and to measure crop acreage. The Advanced Very
High Resolution Radiometer (AVHRR) carried onboard NOAA polar orbiting satellites
measure reflectance from the earth’s surface in the visible, near infrared, and thermal
infrared portions of the electromagnetic spectrum.
This spectral sensitivity makes it suitable for measuring vegetative condition and because
the satellite passes overhead twice a day, it can be used to detect rapidly changing
conditions. Unfortunately, its use as a precision agriculture tool is limited because the
spatial resolution of the sensor is nominally 1.1km. A possible application of this scanner
would be to use the thermal infrared sensor to estimate daily maximum and minimum
temperatures. These temperature estimates could then be used to determine degree-days
that will drive pest development models.
Degree-day models are an essential part of IPM programs and the enhanced spatial
coverage provided by satellites would allow for assessment of spatial variability in
predicted events that is not possible with data from sparsely spaced weather stations
currently used for these models. Remotely sensed data can also be used to determine
irrigation scheduling and adequacy of irrigation systems for uniformly wetting an entire
field. The sensors aboard the Landsat satellite measures reflected radiation in seven
Biomass and Remote Sensing of Biomass
134
spectral bands from the visible through the thermal infrared. The sensors high spatial
resolution (approximately 30m) makes it useful in precision agriculture. The spectral
response and higher spatial resolution make it suitable for assessing vegetative condition
for individual fields but the overpass frequency is only once every 16 days. The less
frequent overpass makes it difficult to use these data for assessing rapidly changing
events such as insect outbreaks or water stress. New satellites with enhanced capabilities
are planned and remotely sensed data will become more widely used in management
support systems.
Fig. 4. Figure Advanced Very High Resolution Radiometer (AVHRR) image of the
southwest Untied States. Image is centred on the Las Cruces, New Mexico.
1.3.3 Common satellites
1.3.3.1 GOES
5 spectral bands 1 - 41 km spatial resolution Geostationary
1.3.3.2 NOAA AVHRR
5 spectral bands 1.1 km spatial resolution 1 day repeat cycle
1.3.3.3 Landsat TM
7 spectral bands 30m spatial resolution 16 day repeat cycle
1.3.3.4 MODIS
Multi- spectral bands 250-1000m spatial resolution (band dependent) 1day repeat cycle
1.3.3.5 IKONOS
4 spectral Bands 4m spatial resolution 5 day repeat cycle
Introduction to Remote Sensing of Biomass
135
1.4 Spectral signatures of natural and human-made materials
Remote sensing makes use of visible, near infrared and short-wave infrared sensors to form
images of the earth's surface by detecting the solar radiation reflected from targets on the
ground. Different materials reflect and absorb differently at different wavelengths. Thus, the
targets can be differentiated by their spectral reflectance signatures in the remotely sensed
images.
Fig. 5. Refraction and diffraction of radiations by different objects
1.5 Spectral reflectance signature
When solar radiation hits a target surface, it may be transmitted, absorbed or reflected.
Different materials reflect and absorb differently at different wavelengths. The reflectance
spectrum of a material is a plot of the fraction of radiation reflected as a fun tion of the
incident wavelength and serves as a unique signature for the material. In principle, a
material can be identified from its spectral reflectance signature if the sensing system has
sufficient spectral resolution to distinguish its spectrum from those of other materials. This
premise provides the basis for multispectral remote sensing. The following graph shows the
typical reflectance spectra of water, bare soil and two types of vegetation.
Fig. 6. Spectral resolution of different materials
Biomass and Remote Sensing of Biomass
136
The reflectance of clear water is generally low. However, the reflectance is maximum at the
blue end of the spectrum and decreases as wavelength increases. Hence, water appears dark
bluish to the visible eye. Turbid water has some sediment suspension that increases the
reflectance in the red end of the spectrum and would be brownish in appearance. The
reflectance of bare soil generally depends on its composition. In the example shown, the
reflectance increases monotonically with increasing wavelength. Hence, it should appear
yellowish-red to the eye.
Vegetation has a unique spectral signature that enables it to be distinguished readily from
other types of land cover in an optical/near-infrared image. The reflectance is low in both
the blue and red regions of the spectrum, due to absorption by chlorophyll for
photosynthesis. It has a peak at the green region. In the near infrared (NIR) region, the
reflectance is much higher than that in the visible band due to the cellular structure in the
leaves. Hence, vegetation can be identified by the high NIR but generally low visible
reflectance. This property has been used in early reconnaissance missions during war times
for "camouflage detection".
The shape of the reflectance spectrum can be used for identification of vegetation type. For
example, the reflectance spectra of dry grass and green grass in the previous figures can be
distinguished although they exhibit the generally characteristics of high NIR but low visible
reflectance. Dry grass has higher reflectance in the visible region but lower reflectance in the
NIR region. For the same vegetation type, the reflectance spectrum also depends on other
factors such as the leaf moisture content and health of the plants. These properties enable
vegetation condition to be monitored using remotely sensed images.
Fig. 7. Reflectance spectrum of different materials
1.6 Geodesy, geodetic datums and map projections
Geodesy is the branch of science concerned with the determination of the size and shape of
the Earth. Geodesy involves the processing of survey measurements on the curved surface
of the Earth, as well as the analysis of gravity measurements. Knowing the exact location of
a pixel on the Earth’s surface (its spatial location) is an essential component of remote
sensing. It requires a detailed knowledge of the size and the shape of the Earth. The Earth is
Introduction to Remote Sensing of Biomass
137
not a simple sphere. Topographic features such as mountain ranges and deep oceans disturb
the surface of the Earth. The ideal reference model for the Earth’s shape is one that can
represent these irregularities and identify the position of features through a co-ordinate
system. It should also be easy to use.
1.6.1 Flat Earth vs curved Earth
The “flat Earth” model is not appropriate when mapping larger areas. It does not take into
account the curvature of the Earth. A “curved Earth” model more closely represents the
shape of the Earth. A spheroid best represents the shape of the Earth because it is
significantly wider at the equator than around the poles (Unlike a simple sphere). A
spheroid, (also known as an ellipsoid) represents the equator as an elliptical shape, rather
than a round circle. Surveying and navigation calculations can he performed over a large
area when a spheroid is used as a curved Earth reference model.
1.6.2 Sea level and the composition of the Earth’s interior
The surface of the sea is not uniform. The Earth’s gravitational field shapes it. The rocks that
make up the Earth’s interior vary in density and distribution, causing anomalies in the
gravitational field. These, in turn, cause irregularities in the sea surface. A mathematical
model of the sea surface can be formulated; however, it is very complex and not useful for
finding geographic positions on a spheroid reference model.
1.6.3 Types of geodetic datum
Based on these ideas, models can be established from which spatial position can be
calculated. These models are known as geodetic datums and are normally classified into two
types geocentric datum and local geodetic datum
A geocentric datum is one which best approximates the size and shape of the Earth as a
whole. The center of its spheroid coincides with the Earth’s center of mass. A geocentric
datum does not seek to be a good approximation to any particular part of the Earth. A local
geodetic datum is used to approximate the size and shape of the Earth’s sea surface in a
smaller area.
Datums and GIS
Having a standard accurate datum set becomes increasingly important as multiple layers of
information about the same area are collected and analyzed. The layers are developed into
geographic information systems (GIS), which enable the relationships between layers of
data to be examined. In order to function effectively, a GIS must possess one essential
attribute. It must have the ability to geographically relate data within and across layers. For
example, if a dataset about vegetation is being examined against the data sets for
topography and soils, the accurate spatial compatibility of the two datasets is critical.
1.6.4 Map projection coordinates
A map projection is a systematic representation of all or part of the Earth on a two
dimensional surface, such as a flat sheet of paper. During this process some distortion of
distances, directions, scale, and area is inevitable. There are several different types of map
Biomass and Remote Sensing of Biomass
138
projections. No projection is free from all distortions, but each minimizes distortions in some
of the above properties, at the expense of leaving errors in others. For example, the
commonly used Transverse Mercator projection represents direction accurately, but distorts
distance and area, especially those farthest from the equator. Greenland, for example,
appears to be much larger than it really is. The Transverse Mercator projection is useful for
navigation charts.
1.6.4.1 Universal Transverse Mercator (UTM)
Universal Transverse Mercator (UTM) is a global spatial system based on the Transverse
Mercator projection. UTM divides the Earth into 60 equal zones, each being 6 degrees wide.
Each zone is bounded by lines of longitude extending from the North Pole to the South Pole.
Imagine an orange consisting of 60 segments. Each segment would be equivalent to a UTM
zone. A rectangular grid coordinate system is used in most map projections. These
coordinates are referred to as Eastings and Northings, being distances East and North of an
origin. They are usually expressed in metres. Under the UTM system, each East and North
coordinate pair could refer to one of sixty points on Earth — one point in each of the sixty
zones. Because of this, the zone number needs to be quoted to ensure the correct point on
Earth is being identified.
1.6.4.2 Global Positioning System
The Global Positioning System (GPS) is a satellite based system that gives real time three
dimensional (3D) latitude, longitude, and height information at sub-meter accuracy. The
system was developed by the United States military in the late 1970’s to give troops
accurate position and navigational information. A GPS receiver calculates its position on
earth from radio signals broadcast by satellites orbiting the earth. There are currently
twenty-four GPS satellites in this system. GPS equipment is capable of measuring a
position to within centimetres but the accuracy suffers due to errors in the satellite
signals. Errors in the signal can be caused by atmospheric interference, proximity of
mountains, trees, or tall buildings. The government can also introduce errors in the signal
for security purposes. This intentional degradation of the satellite signals is known as
selective availability. The accuracy of the position information can be improved by using
differential GPS. In differential GPS, one receiver is mounted in a stationary position,
usually at the farm office, while the other is on the tractor or harvesting equipment. The
stationary receiver calculates the error and transmits the necessary correction to the
mobile receiver. GPS equipment suitable for precision agricultural cost several thousand
dollars. Less expensive equipment is becoming available but the accuracy and capability
is reduced.
1.6.4.3 Geographic Information System (GIS)
A Geographic Information System (GIS) is a computer-assisted system for handling spatial
information. GIS software can be considered as a collection of software programs to acquire,
store, analyze, and display information. The input data can be maps, charts, spreadsheets, or
pictures. The GIS software can analyze these data using image processing and statistical
procedures. Data can be grouped together and displayed as overlays. Overlays could be
information such as soil type, topography, crop type, crop yield, pest levels, irrigation, and
management information as shown.
Introduction to Remote Sensing of Biomass
139
Fig. 8. Topographic GIS map of the forest area
Relationships can be examined and new data sets produced by combining a number of
overlays. These data sets can be combined with models and decision support systems to
construct a powerful management tool. For example, we could assess how far a field was from
roads or non-agricultural crops. This information could be important in pest infestation or in
planning chemical application. We could also examine crop yield relationship to soil type or
other factors as show in the following figure. A number of GIS software packages are now
commercially available. Spatial data for the GIS is often collected using GPS equipment but
another source of spatial information is aerial and satellite imagery.
1.6.4.4 Pixels, images and colours
1.6.4.4.1 Colour composite images
In displaying a colour composite image, three primary colors (red, green and blue) are used
when these three colours are combined in various proportions, they produce different colors
in the visible spectrum. Associating each spectral band (not necessarily a visible band) to a
separate primary colour results in a colour composite image.
Fig. 9. Primary colour composite
Biomass and Remote Sensing of Biomass
140
Many colours can be formed by combining the three primary colours (Red, Green, Blue) in
various proportions.
1.6.4.4.2 False colour composite
The display colour assignment for any band of a multispectral image can be done in an
entirely arbitrary manner. In this case, the colour of a target in the displayed image does not
have any resemblance to its actual colour. The resulting product is known as a false color
composite image. There are many possible schemes of producing false color composite
images. However, some scheme may be more suitable for detecting certain objects in the
image.
1.6.4.4.3 Natural colour composite
When displaying a natural colour composite image, the spectral bands (some of which may
not be in the visible region) are combined in such a way that the appearance of the
displayed image resembles a visible colour photograph, i.e. vegetation in green, water in
blue, soil in brown or grey, etc. Many people refer to this composite as a "true colour"
composite. However, this term may be misleading since in many instances the colours are
only simulated to look similar to the "true" colours of the targets. For example, the bands 3
(red band), 2 (green band) and 1 (blue band) of a AVHRR image can be assigned
respectively to the R, G, and B colours for display. In this way, the colour of the resulting
colour composite image resembles closely what the human eyes would observe.
Fig. 10. Development of natural colour composite
1.7 Image processing and analysis
Many image processing and analysis techniques have been developed to aid the
interpretation of remote sensing images and to extract as much information as possible from
the images. The choice of specific techniques or algorithms to use depends on the goals of
each individual project. The key steps in processing remotely sensed data are Digitizing of
Images, Image Calibration, Geo-Registration, and Spectral Analysis. Prior to data analysis,
initial processing on the raw data is usually carried out to correct for any distortion due to
the characteristics of the imaging system and imaging conditions. Depending on the user's
requirement, some standard correction procedures may be carried out by the ground station
Introduction to Remote Sensing of Biomass
141
operators before the data is delivered to the end-user. These procedures include radiometric
correction to correct for uneven sensor response over the whole image and geometric
correction to correct for geometric distortion due to Earth's rotation and other imaging
conditions (such as oblique viewing). The image may also be transformed to conform to a
specific map projection system. Furthermore, if accurate geographical location of an area on
the image needs to be known, ground control points (GCP's) are used to register the image
to a precise map (geo-referencing).
Fig. 11. Georeferencing of a map
1.7.1 Digitizing of images
Image digitization is the conversion of an analogue image, such as a photograph, into a
series of grid cells. The value of each cell is related to the brightness, colour or reflectance at
that point. A scanner is a simple way to digitize images. Many modern sensors now produce
raw data in digital format.
1.7.2 Image enhancement
In order to aid visual interpretation, visual appearance of the objects in the image can be
improved by image enhancement techniques such as grey level stretching to improve the
contrast and spatial filtering for enhancing the edges. An example of an enhancement
procedure is shown here.
1.7.3 Image classification
Different land cover types in an image can be discriminated using some image
classification algorithms using spectral features, i.e. the brightness and "colour" information
contained in each pixel. The classification procedures can be "supervised" or "unsupervised".
In supervised classification, the spectral features of some areas of known land cover types
are extracted from the image. These areas are known as the "training areas". Every pixel in
the whole image is then classified as belonging to one of the classes depending on how close
Biomass and Remote Sensing of Biomass
142
its spectral features are to the spectral features of the training areas. In unsupervised
classification, the computer program automatically groups the pixels in the image into
separate clusters, depending on their spectral features. Each cluster will then be assigned a
landcover type by the analyst. Each class of land cover is referred to as a "theme" and the
product of classification is known as a "thematic map". The information derived from
remote sensing images are often combined with other auxiliary data to form the basis for a
Geographic Information System (GIS). A GIS is a database of different layers, where each
layer contains information about a specific aspect of the same area which is used for analysis
by the resource scientists.
1.8 Image interpretation
1.8.1 Vegetation indices
Different bands of a multispectral image may be combined to accentuate the vegetated
areas.
One such combination is the ratio of the near-infrared band to the red band. This ratio is
known as the Ratio Vegetation Index (RVI)
RVI = NIR/Red
Since vegetation has high NIR reflectance but low red reflectance, vegetated areas will have
higher RVI values compared to non-vegetated aeras. Another commonly used vegetation
index is the Normalised Difference Vegetation Index (NDVI) computed by
NDVI = (NIR - Red)/(NIR + Red)
Table shows equations and references for several indices that can be use in vegetation
monitoring.
PARAMETER EQUATION REFERENCE
Normalized Difference
Vegetation Index (NDVI)
(NIR-Red)/(NIR+Red) Rouse et al (1974)
Water Band Index (WBI) 900/970 nm Pefluelas et al. (1997)
Water Moisture Index (WMI) 1600/820 nm Hunt and Rock (1989)
Photosynthesis Index (531-570)/531+570) Gamon et al. (1990)
Nitrogen Index (RN) (550-600)/(800-(900) Blackmer et al. (1996)
Chlorophyll based Difference Index
(CI)
(850-710)/850-680) Datt (1999)
Table 1. Equation and references for different parameters
Vegetation maps are produced by generating a normalized difference vegetation index from
a infrared image and then doing a vegetation classification. Colour infrared photographs
collect information in the green, red and near infrared light reflectance spectrum. Green
vegetation reflects very strongly in the near infrared light range and therefore infrared
images can detect stress in many crops before it is visible with the naked eye.
The Normalized Difference Vegetation Index (NDVI) is used to separate green vegetation
from the background soil brightness. It is the difference between the near infrared and red
reflectance normalized over the sum of these bands.
Introduction to Remote Sensing of Biomass
143
Fig. 12. Example of image processing of aerial infrared photographs to produce a vegetation
map for a chile field.
Fig. 13. Example of image processing of aerial infrared photographs to produce a vegetation
map for a peddy field.
NDVI = (IR-Red)/(IR+Red)
These NDVI maps can then be classified into vegetation categories and displayed as a
vegetation maps with different colours representing different levels of vegetation. In the
map on the left browns and yellow represent bare soil and shades of green represent
vegetation, darker greens are stronger vegetation.
1.9 Background on remote sensing
1.9.1 Remote sensing
Remote sensing is the science and art of obtaining information about an object, area or
phenomenon through the analysis of data acquired by a device that is not in contact with the
object, area, or phenomenon under investigation. As the term indicates, it applies to any
Biomass and Remote Sensing of Biomass
144
information gathering device or method where the object of observation is remote from the
device.
Out of a number of devices involved in remote sensing, the most common platforms are
aircraft and satellites. The sensors associated with these devices are of two types, namely
passive and active sensors. In a passive system, the instrument gathers information from the
radiation that happens to arrive. The main sources of radiation for such systems are either
solar radiation or thermal emissions. In the active system, it is the instrument itself on board
the device that is the source of radiation. It sends signals to target under investigation, and
receives the return signal, having the unique characteristics of the target features. As far as
satellite remote sensing is concerned, systems operating in the visible and infrared part of
the electromagnetic spectrum are passive while microwave instruments are either active or
passive.
Currently, satellites are the main devices in remote sensing. And the two main types of
satellites are the Polar or Near-polar Orbiting and Geostationary satellites. The Polar or
Near Polar orbiting satellites are Sun-synchronous i.e. the satellites keep a precise pace with
the Sun's westward progress as the earth rotates so that they always cross the equator at
precisely the same solar time. Examples can be Landsat and NOAA satellites. Geostationary
satellites are satellites which travel with an angular velocity that matches the earth's
rotation. As a result, they remain at the same point above the earth at all times. An example
is Meteosat. These satellites are helpful in obtaining constant and persistent image of a
particular area at fixed interval which is a great advantage in monitoring a location with
high temporal resolution to capture the transient behavior of objects such as rain clouds.
Estimation of biomass production will provide guidance to energy development polices
including:
The impact of improved stoves on fuel wood and dung energy consumption.
The potential of increasing the supply of fuel wood through the establishment of small
scale "forest plantations"
The potential of dung and other fuels for biomass energy supply.
1.9.2 Principles involved
1.9.2.1 The photon and radiometric quantities
Most remote sensing texts begin by giving a survey of the main principles, to build a
theoretical background, mainly in the physics of radiation. While it is important to have
such a framework to pursue many aspects of remote sensing, we do not delve into this
complex subject in much detail at this point. Instead, we offer on this and the next several
pages an outline survey of the basics of relevant electromagnetic concepts. On this page, the
nature of the photon is the prime topic. Photons of different energy values are distributed
through what is called the Electromagnetic Spectrum.
Hereafter in this Introduction and in the Sections that follow, we limit the discussion and
scenes examined to remote sensing products obtained almost exclusively by measurements
within the Electromagnetic Spectrum (force field and acoustic remote sensing are briefly
covered elsewhere in the Tutorial). Our emphasis is on pictures (photos) and images (either
TV-like displays on screens or "photos" made from data initially acquired as electronic
signals, rather than recorded directly on film). We concentrate mainly on images produced
by sensors operating in the visible and near-IR segments of the electromagnetic spectrum
but also inspect a fair number of images obtained by radar and thermal sensors.
Introduction to Remote Sensing of Biomass
145
The underlying basis for most remote sensing methods and systems is simply that of
measuring the varying energy levels of a single entity, the fundamental unit in the
electromagnetic (which may be abbreviated "EM") force field known as the photon. As you
will see later on this page, variations in photon energies (expressed in Joules or ergs) are tied
to the parameter wavelength or its inverse, frequency. EM radiation that varies from high to
low energy levels comprises the ElectroMagnetic spectrum (EMS). Radiation from specific
parts of the EM spectrum contain photons of different wavelengths whose energy levels fall
within a discrete range of values. When any target material is excited by internal processes
or by interaction with incoming EM radiation, it will emit or reflect photons of varying
wavelengths whose radiometric quantities differ at different wavelengths in a way
diagnostic of the material. Photon energy received at detectors is commonly stated in power
units such as Watts per square meter per wavelength unit. The plot of variation of power
with wavelength gives rise to a specific pattern or curve that is the spectral signature for the
substance or feature being sensed.
Now, in more detail: The photon is the physical form of a quantum, the basic particle of
energy studied in quantum mechanics (which deals with the physics of the very small, that
is, particles and their behavior at atomic and subatomic levels). The photon is also described
as the messenger particle for EM force or as the smallest bundle of light. This subatomic
massless particle, which also does not carry an electric charge, comprises radiation emitted
by matter when it is excited thermally, or by nuclear processes (fusion, fission), or by
bombardment with other radiation (as well as by particle collisions). It also can become
involved as reflected or absorbed radiation. Photons move at the speed of light: 299,792.46
km/sec (commonly rounded off to 300,000 km/sec or ~186,000 miles/sec).
Photon particles also move as waves and hence, have a "dual" nature. These waves follow a
pattern that can be described in terms of a sine (trigonometric) function, as shown in two
dimensions in the figure below.
(NOTE: Frequency refers to number of crests of waves of same wavelength that pass by a
point in one second.)
Fig. 14. Movement of photon particles as sine waves
The distance between two adjacent peaks on a wave is its wavelength. The total number of
peaks (top of the individual up-down curve) that pass by a reference lookpoint in a second
is that wave's frequency (in units of cycles per second, whose SI version [SI stands for
System International] is known as a Hertz [1 Hertz = 1/s
-1]
).
Biomass and Remote Sensing of Biomass
146
A photon travels as an EM wave having two components, oscillating as sine waves mutually
at right angles, one consisting of the varying electric field, the other the varying magnetic
field. Both have the same amplitudes (strengths) which reach their maxima-minima at the
same time. Unlike other wave types which require a carrier (e.g., water waves), photon
waves can transmit through a vacuum (such as in space). When photons pass from one
medium to another, e.g., air to glass, their wave pathways are bent (follow new directions)
and thus experience refraction.
Fig. 15. Dual nature (electric and magnetic field) of photon particles
A photon is said to be quantized, in that any given one possesses a certain quantity of
energy. Some other photon can have a different energy value. Photons as quanta thus show
a wide range of discrete energies. The amount of energy characterizing a photon is
determined using Planck's general equation:
E = hv
where h is Planck's constant (6.6260 x 10
-34
Joules-sec)
*
and v is the Greek letter, nu,
representing frequency (the letter "f" is sometimes used instead of v). Photons traveling at
higher frequencies are therefore more energetic. If a material under excitation experiences a
change in energy level from a higher level E
2
to a lower level E
1
, we restate the above
formula as:
ΔE = E
2
– E
1
= hv
where v has some discrete value determined by (v
2
- v
1
). In other words, a particular energy
change is characterized by producing emitted radiation (photons) at a specific frequency v
and a corresponding wavelength at a value dependent on the magnitude of the change.
1.9.3 Sources of electromagnetic (EM)- radiation
EM radiation is the energy resulting from the acceleration of electric charges and the
associated electric and magnetic fields (this study is restricted to radiation emitted from the
Sun and earth's surface). EM radiation is governed by the equations:
2
2
2
0
E
E
t
Introduction to Remote Sensing of Biomass
147
2
2
2
0
H
H
t
where the speed of light c²=1/(µ ɛ )
The energy associated with EM waves can be regarded as stream of photons travelling at
speed of light, each photon having an energy hv, where h is Plank's constant and v is the
frequency of the light. The EM spectrum, which is the range of wavelengths over which
electromagnetic radiation extend, constitute of radio waves, micro waves, thermal infrared,
infrared, visible, ultraviolet, x-ray, and gamma rays in decreasing order of wavelengths.
The ultimate source of energy for remote sensing is the Sun. Besides, all matter above
absolute zero temperature emit radiation. Thus terrestrial objects are also sources of
radiation, though it is considerably different in magnitude and spectral composition than
that of the Sun. The emitted radiation from terrestrial objects is a function of temperature.
From the principle of Black Body Radiation, the density of radiant energy U(v) emitted from
a black body in the frequency range v+dv and v is:
3
3
8
exp 1
vdv
Uvd
v
C
kT
which is the
Planck distribution law. The total energy density overall frequencies is :
54
44
33
8
15
o
k
UUvdv TaT
ch
where
a is a universal constant.
The intensity emitted from an object is therefore:
I =
ɛσT
4
This is the Stefan - Boltzman Law
The spectral distribution of emitted energy varies with temperature as shown in
Figure 1.
Meanwhile, the wavelength at which greatest energy density occurs varies inversely with
temperature and is given by Wein's displacement law:
3
max
2.898 10 .
4.965
hc
Txmk
K
1.9.4 Energy interaction in the atmosphere
Atmosphere can have a profound effect on the intensity and spectral composition available
to any sensing system as the radiation which reaches the sensed object passes through a
certain optical path length of atmospheric air. These effects are caused principally through
the mechanism of atmospheric
scattering and absorption.
1.9.4.1 Scattering
As stated above, the atmosphere can have a significant effect on the incoming and
outgoing radiation by scattering. There are three types of scattering depending on the size
of particle involved. And these are
Rayleigh scattering, Mie scattering and Non-selective
Biomass and Remote Sensing of Biomass
148
scattering where Rayleigh and Non-selective scattering are the limiting cases of Mie
scattering.
For Rayleigh scattering to occur, the particle size must not be larger than about 1/10
th
of the
wavelength of the light. In a gas with N molecules per unit volume and refractive index n,
the Rayleigh extinction coefficient α for a wavelength is approximately:
3
2
32
1
3†
n
N
Rayleigh Sc atter i
∝
1
†
The extinction coefficient decreases as a wavelength increases. Specifically, the amount of
scattering is inversely proportional to the fourth power of wavelength.
Mie scatter occurs for particles whose diameter is approximately equal to the wavelength. In
a gas containing N spherical particles of radius R, the effective cross-section is given by:
σ = NAds Ŗ†
where Ads - is the volume in which the gas is contained, provided that no one particle lies
in the shadow of another particle. If no absorption takes place, the extinction coefficient
equals to scattering extinction co-efficient. Mie extinction coefficient is given by
α =NKπR²
where K = the extinction factor
The ratio of scattered to incident light can be expressed as:
o
i
ds
I
In this type of scattering, as the particles are of the order of wavelength, the light scattered
from one part of the surface can be out of phase with coming from another part, unlike
Rayleigh scattering were there is no phase difference between the light source and the
scattered light. For Mie scattering, phase difference will be small for small scattering angle
which gives rise to a large intensity in the forward direction and less in the reverse.
Non-selective scattering occurs when the diameter of the scattering particles is much larger
than the wavelength. Water droplets, for example, cause such a scattering. They commonly
have diameter in the range 5 to 100m and scatter all visible wavelengths, equal quantities of
blue, green, and red light are scattered, making fog and clouds appear white.
1.9.4.2 Absorption
When light pass through a certain optical path in the atmosphere, it experiences absorption
in addition to scattering by the existing particles. The intensity of the light diminishes
according
To the equation :
I = I
o
exp (-α
1
)
where α is the absorption coefficient
Introduction to Remote Sensing of Biomass
149
In the atmosphere, the most efficient absorbers of radiation are water vapour, carbon
dioxide, and ozone.
The effect of this absorption is to leave only few regions known as atmospheric windows, in
which the atmosphere transmits a substantial proportion of electromagnetic radiation. These
are the only regions that can be used in remote sensing of the earth's surface.
Both scattering and absorption increase with increase in path length or with an increase in
air mass.
1.9.5 Energy interaction with the earth's surface
When a light wave is incident on a surface, it will be reflected, transmitted, or absorbed.
Furthermore, the energy of the absorbed radiation can be re-emitted as other forms of
radiation. For an incident wave of intensity
I
o
the intensity of the reflected wave is rI
o
and
the amplitude of the rest is
(1 - r)I
o
, where r is the coefficient of reflection.
When EM radiation is incident on a given surface feature, out of the three fundamental
processes the reflected part is often of interest in remote sensing. (thermal emission are also
often of interest). The reflected part
(rI
o
) will be different for different earth features
depending on the type of material and the condition of the material (e.g. dry or wet).
Reflectivity is also dependent on the wavelength or frequency of the incoming radiation.
The function which describes the dependence of reflectivity on wavelength is called the
spectral reflectance function, and is given by:
2
Ener
gy
o
f
re
f
lected
Ener
gy
o
f
incident
Different objects have very distinct spectral reflectance curves. It is the differences in
spectral reflectance that allows one to distinguish different materials and objects using
remotely sensed reflected radiation.
For thermal infrared wavelengths, the reflected radiation is outweighed by the emitted
energy of the surface features. Hence in the thermal infrared, the radiation received from an
object depends on its emissivity and temperature. Meanwhile, the temperature of an object
will depend on its absorptivity (how much radiation it absorbs), its thermal conductivity
(rate at which heat pass through a material), thermal capacity (ability of a material to store
heat), and thermal inertia (thermal response of material to temperature change). Since our
investigation focuses on non-thermal images, we will not discuss thermal remote sensing
methods in detail.
1.9.6 Data acquisition and interpretation
Detection of EM energy can be performed either photographically or electronically. The
process of photography uses chemical reactions on the surface of a light sensitive film to
detect energy variation within a scene while electronic sensors generate in electrical signals
that corresponds to the energy or intensity of the detected radiation. The advantage of visual
(photographic) is that it is simple, it provides high good spatial detail (because of the high
resolution of chemical films) and geometric integrity (geometry is not distorted). On the
other hand, electronics have the advantage of broader spectral sensitivity and easier
conversion of the image to digital form.
Biomass and Remote Sensing of Biomass
150
Photographic images are interpreted visually (or scanned to convert them into digital
images) whereas electronic images are interpreted digitally. The electronic image constitutes
an array of pixels which vary in the level of brightness in accordance with the radiation
received from the surface feature they represent. Pixel brightness is converted to a binary
number. In our case pixel values are 8-bit binary numbers representing integer values from
0 to 255. These are positive integers that result from quantizing of the original electrical
signal from the sensor.
1.10 Remote sensing of biomass production
1.10.1 Reflectance characteristics of green plants
Green plants have a unique spectral reflectance curve. In the visible part of the spectrum,
plants strongly absorb light in the blue (0.45µ m) and red (0.67nm) regions and reflect
strongly in the green portion of the spectrum due to the presence of chlorophyll. In cases
where the plant is subjected to stress or to a condition which hinders growth, the
chlorophyll production will decrease. And this in turn leads to less absorption in the blue
and red bands.
In the near infrared portion of the spectrum (0.7 - 1.3µm), green plant reflectance increases to
40 - 50% of incident light. Beyond 1.3µm, there are dips in the reflectance curve due to
absorption by water in the leaves.
1.10.2 Principles of detection
The differential reflection of green plants in the visible and infrared portion of the spectrum
makes possible the detection of green plants from satellites. Other features on the earth
surface don't have such a unique step-like character in the 0.65 - 0.75µm range of the
reflectance curve. NDVI is commonly used to represent this character. It is calculated from
Advanced Very High Resolution Radiometer (AVHRR) data from NOAA-8 and NOAA-9
polar orbiting satellite and is defined as:
21
21
CHN CHN
NDVI
CHN CHN
where
CHN1 and CHN2 are reflectance in the visible (red) (0.58 - 0.68 µm) and near
infrared channels (0.725 - 1.10 µm) respectively. NDVI is determined by the degree of
absorption by chlorophyll in the red wavelengths, which is proportional to green leaf
density. Therefore, NDVI correlates well with green leaf biomass, leaf area index, and
other related parameters.
1.10.3 Estimation of radiation use efficiency in plants
Plants make use of specific energy wavelengths (0.4 - 0.7 µm) for the process of
photosynthesis. The photo-synthetically active radiation constitutes about 50% of the energy
that is emitted from the sun. Out of this phot-synthetically active radiation (PAR), about
80% of the radiation incident on a plant leaf is captured by photo-synthetically active
compounds. The rest is lost by reflection and absorption by non-photosynthesizing
materials. A minimum of eight photons are required to produce a glucose from a single
carbon-dioxide and glucose stores 28% of the captured energy in the form of chemical
energy of the molecules. And finally, as the plant produces the glucose molecule it will use