Biomass and Remote Sensing of Biomass Part 13 doc
Bạn đang xem bản rút gọn của tài liệu. Xem và tải ngay bản đầy đủ của tài liệu tại đây (2.42 MB, 20 trang )
Long-Term UVR Effects Upon Phytoplankton
Natural Communities of Patagonian Coastal Waters
231
carried out by Keller et al. (1997) with communities off Narragansett Bay. At the community
level, UVR impact is frequently translated onto changes in the taxonomic composition
towards more tolerant species or changes in size distribution. For example, studies carried
out by Wängberg et al. (1999; 2008) found that small phytoplankton were favored by UV-B
exposure, and Mousseau et al. (2000) reported a shift from diatoms to small naked
flagellates that occurred more rapidly under enhanced UV-B than under its natural levels.
UVR-mediated community structure shifts may result in an important impact for the whole
aquatic system, either by altering the food web structure due to the differential sensitivity to
UVR, or by affecting carbon allocation into different biomolecules which in turn is
translated into changes of carbon and nutrient cycling in the ecosystem (Mostajir et al. 1999;
Sommaruga 2003).
3. Why studying UVR effects upon phytoplankton communities of Patagonia?
The ecological effects of UVR were documented more intensively in the Antarctic region at
beginning of the awareness of the Antarctic ozone ‘hole’. Later studies pointed out that the
influence of the Antarctic ozone depletion extends to mid latitudes (Atkinson et al. 1989)
and that Southern mid latitudes may be even more affected (Seckmeyer and McKenzie
1992). Still, while many studies about the effects and impact of UVR on phytoplankton have
been carried out in polar areas, relatively less is known about temperate regions (see review
by Gonçalves et al. 2010) such as Patagonia. The Patagonia region is located at the southern
tip of South America, includes part of Argentina and Chile (Fig. 1) and has unique
characteristics that would warrant UVR studies for several reasons. First, the area is
occasionally under the influence of ozone-depleted air masses from the Antarctic polar
vortex, thus experiencing periods of enhanced UV-B (Villafañe et al. 2001; Helbling et al.
2005). Second, its great variability in cloudiness, from high cover over the Andes and sub-
Antarctic regions to the relatively clear skies on the mid-latitude Atlantic coast, creates a
range of environments with variable UVR climatology. Third, it presents a high variability
in the nature and bio-optical characteristics of its water bodies (e.g. the upwelling deep
waters in the Pacific and the shallow and very productive Atlantic waters). Finally, high
wind speed and frequency, especially during spring and summer (Villafañe et al. 2004a;
Helbling et al. 2005) strongly condition the depth of the upper mixed layer (UML) and hence
the underwater radiation field to which organisms are exposed. In addition the assessment
of the UVR impact on phytoplankton from Argentinean Patagonia is essential since these
organisms are responsible for an important share of primary productivity in the
Argentinean Sea (Lutz et al. 2010) and they constitute the base of a very rich food web that
includes fishes (e.g. hake, anchovy) (Skewgar et al. 2007) and invertebrate species (e.g.
shrimp and mussels) of great commercial value (Caille et al. 1997).
Taking into consideration these facts, in the next section we present our study case and a
review of the current knowledge about UVR effects on phytoplankton communities mainly
from Patagonia, and especially focusing on effects observed in a days/weeks timeframe.
4. Study case: Long-term UVR effects on phytoplankton from Bahía Engaño,
Patagonia, Argentina
The study site (Bahía Engaño, Chubut, Argentina) is located at Northern coastal Patagonia
(Fig. 1). Our research group had previously conducted several UVR studies with
Biomass and Remote Sensing of Biomass
232
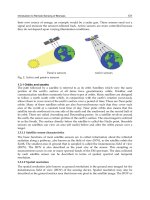
Fig. 1. Location of the study site, showing Patagonia (shaded area) and the relative position
of the Chubut Province (Argentina) in South America. The inset shows the study area where
microcosms experiments were done.
phytoplankton communities from this area, mostly determining short-term responses,
particularly those related to inhibition of carbon fixation and photoinhibition (e.g., see
Barbieri et al. 2002; Villafañe et al. 2004a; Villafañe et al. 2004b; Villafañe et al. 2008; Helbling
et al. 2010), and relatively less studies to determine long-term responses to UVR in
combination with nutrient addition (Helbling et al. 2005, Marcoval et al. 2008). Therefore,
the results presented here aim to further elucidate aspects of UVR sensitivity and
photoacclimation of phytoplankton from Patagonia occurring over longer periods of time,
especially focusing on community properties such as global growth, abundance, taxonomic
composition and size distribution.
An experimental approach was taken, in which natural phytoplankton samples were
collected, and incubated under solar radiation during the austral summer of 2010. The
experiments consisted in two microcosm incubations (hereafter MI and MII) which lasted
between February 5 - 11 (MI) and February 15 - 21 (MII). The experimental setup consisted
in exposing natural phytoplankton samples in 25-l, UVR-transparent bags (microcosms)
under three different radiation conditions: a) PAB, 280-700 nm (samples receiving PAR+UV-
A+UV-B); b) PA, 320-700 nm (samples receiving PAR+UV-A) and c) P, 400-700 nm (samples
receiving only PAR). The microcosms (duplicates per radiation treatment) were placed in a
Long-Term UVR Effects Upon Phytoplankton
Natural Communities of Patagonian Coastal Waters
233
tank (3 m diameter, 1 m depth) with running water as temperature control and exposed to
solar radiation at the surface for ca. 7 days. During the experiments, water samples from
each microcosm bag was collected daily (early in the morning) for analyses of Chl a and UV-
absorbing compounds whereas samples for taxonomic composition and size distribution
were taken every other day.
During the experiments, PAR and UVR irradiance conditions (Fig. 2) presented a typical
pattern of relatively high values at noon and low ones during the morning and late
Fig. 2. Solar radiation reaching the Earth’s surface at the study site during experiments
carried out during February 5-11 (Julian days 36-42) (MI), and February 15-21 (Julian days
46-52), 2010 (MII). Irradiance is shown for: A) PAR, 400– 700 nm, B) UV-A, 315–400 nm and,
C) UV-B, 280-315 nm. Solar radiation was continuously monitored using a broad-band filter
radiometer (ELDONET, Real Time Computers, Möhrendorf, Germany, Häder et al. 2007)
permanently installed on the roof of the Estación de Fotobiología Playa Unión.
Biomass and Remote Sensing of Biomass
234
afternoon; also, the presence of clouds that resulted in high daily variability in solar
irradiance is characteristic for the area during summer (Helbling et al. 2005). During our
experiments, maximum PAR irradiance levels were rather similar (~440 – 460 W m
-2
) (Fig.
2A) as also were UV-A (~60 W m
-2
)
and UV-B (~2 W m
-2
) – except for the second day during
MII where PAR and UVR values were very low (i.e., ~100, 17, and 0.6 W m
-2
for PAR, UV-A
and UV-B, respectively; Figs. 2A-C). The high irradiance values in combination with long
daylight periods result in high daily doses (Helbling et al. 2005) which are similar to those
registered in tropical environments (Gao et al. 2007). Since phytoplankton in our
experiments were exposed to these high irradiance conditions of solar radiation under a thin
layer of water under, our results represent the ‘worst-case scenario’, i.e., as if cells were at
the water surface, not allowed to move downward towards lower radiation levels.
Because the timing of our sampling (summer) that is considered a post-bloom condition for
our study area (Villafañe et al. 2008), we added nutrients to each incubation bag (f/2
concentration (Guillard and Ryther 1962)) at the beginning of each experiment to avoid
nutrient constraints while phytoplankton was growing. In both experiments, the
phytoplankton assemblage showed an increase, as assessed by measurements of Chl a (Fig.
3A), cellular abundance (Fig. 3B) and autotrophic carbon (Fig. 3C). Some general features
were observed: Firstly, during both experiments the variables used to calculate growth had
a typical exponential increase, similar to those occurring at bloom conditions, and thus an
optimum cellular response. Secondly, the observed increase was similar for both
experiments, although some differences appeared for some variables; and thirdly, no
general UVR effects were observed (except in a few cases) within any experiment / variable
measured.
As an overview of the increase of phytoplankton assemblages, Table 1 resumes the
calculated growth rates (µ) during both experiments. The fast growth observed during the
experiments were probably due to the addition of nutrients and the low turbulence inside
the incubation bags, as previously observed in long-term studies with phytoplankton
communities from the area (Helbling et al. 2005; Marcoval et al. 2008). As mentioned before,
a common result of long-term incubations is the lack of UVR effects on growth and biomass,
as also observed in our study (i.e., no-significant differences between radiation treatments as
observed in Table 1 and Fig. 3). In fact, this lack of UVR effects on growth was also observed
in other studies carried out in Patagonian waters: For example, Roy et al. (2006) working
with phytoplankton communities from the Beagle Channel (Tierra del Fuego) observed
minor changes in biomass due to UV-B (both normal and enhanced levels), even though the
UV-B enhancement imposed to the samples was important (i.e., simulating 60 % of ozone
depletion). However, Hernando et al. (2006) found a significant effect of UVR on growth on
these phytoplankton assemblages only when samples were exposed to solar radiation at
fixed depths, in contrast to the mixed conditions imposed in the mesocosms described by
Roy et al. (2006). In addition, Helbling et al. (2005) and Marcoval et al. (2008) determined
variable UVR-induced inhibition of growth in natural communities off the Chubut coast
under different conditions of nutrients availability, with nutrient-depleted samples being
more sensitive to UVR than those in which nutrients had been added. Therefore, UVR alone
is not an evident inhibitor of growth for phytoplankton off Patagonia waters, but it can have
important effects when acting together with other stressors (e.g., nutrient availability,
mixing conditions).
Long-Term UVR Effects Upon Phytoplankton
Natural Communities of Patagonian Coastal Waters
235
Fig. 3. Growth of the phytoplankton communities during MI and MII experiments evaluated
as: A) Chlorophyll a (Chl a) content (measured by fluorometric and spectrophotometric
techniques, Holm-Hansen and Riemann 1978; Porra 2002); B) Cell concentration (obtained
by microscopy; Villafañe and Reid 1995); and C) Autotrophic biomass (considering
biovolumes according to Hillebrand et al. 1999 and posterior transformation to carbon
content following Strathmann 1967). The different radiation treatments are shown in
different colors. The vertical lines on the symbols indicate the half mean range. Note the
different log scales for the variables presented.
Another observed pattern in the growth response was, at first sight, a similar trend among
experiments which was due not only to the similar radiation conditions (Fig. 2) but also to
the initial assemblages used in both experiments (i.e., similar starting taxonomic
composition). In fact, at the beginning of experiments, the communities were numerically
dominated by flagellates (e.g., chlorophytes and cryptophytes) and to a less extent by
Biomass and Remote Sensing of Biomass
236
Growth rates (µ; d
-1
)
Chl a Cellular abundance Autotrophic carbon
PAB P PAB P PAB P
Microcosm
I
0.76 ± 0.01
0.76 ± 0.06
0.88 ± 0.09
0.79 ± 0.04
0.84 ± 0.14 0.75 ± 0.15
Microcosm
II
0.94 ± 0.02
0.90 ± 0.03
0.73 ± 0.08
0.73 ± 0.11
0.70 ± 0.07 0.76 ± 0.03
Table 1. Growth rates (µ, in d
-1
) during MI and MII experiments, determined from
measurements of Chl a, cellular abundance and estimations of autotrophic carbon.
diatoms (Thalassiosira spp., Nitzschia longissima); on the other hand, the abundance of
dinoflagellates (e.g., Prorocentrum micans, unidentified naked species) was very low. This is
in agreement with previous studies carried out in the area that demonstrated the
conspicuous presence of flagellates during the summer (Villafañe et al. 2004a; Villafañe et al.
2008). However, it was also evident that there were some differences in the growth rates
calculated from different variables as well as when comparing experiments. For example,
during MI, Chl a-based µ were lower than those from cellular abundance and autotrophic
carbon, while the opposite occurred in MII. The fact that Chl a concentration showed a
slower (during MI) or faster (during MII) increase than the other two variables, suggests a
differential acclimation of the assemblages as the experiments progressed. This could be due
to different reasons: On the one hand, as the community grew the self-shading effect might
become important and thus the Chl a concentration per cell would increase to keep
efficiently capturing photons and maintain the exponential growth. This could be mediated
by cell size, as smaller cells (i.e., higher surface-to-volume ratio) needs comparatively less
Chl a per cell as compared to larger cells (Falkowski 1981). On the other hand, an increase in
cell size, with larger cells towards the end of the exponential growth phase, means a smaller
surface-to-volume ratio and thus the need of higher Chl a content per cell. Indeed, a
combination of both factors were observed in our experiments, as the C to Chl a ratio – an
indicator of “light acclimation” - increased in MI and decreased in MII, while the Chl a
content per cell decreased in MI and increased in MII towards the end of the exponential
phase (Table 2). In the following paragraphs we will discuss how changes in cell size,
together with differential changes in species composition might have accounted for the
observed patterns and variability among our experiments.
C / Chl a Chl a content per cell
PAB P PAB P
MI - T
0
35 ± 5 35 ± 5 1.87 ± 0.45 1.87 ± 0.45
MI - T
f
58.8 ± 3.1 33.2 0.88 ± 0.33 1.48
MII - T
0
94.6 ± 0.9 94.6 ± 0.9 0.65 ± 0.18 0.65 ± 0.18
MII - T
f
37 ± 13 53.8 ± 15.7 1.49 ± 0.07 1.33 ± 0.02
Table 2. Mean (and half mean range) carbon to Chl a ratio (in µg C µg Chl a
-1
) and Chl a
content per cell (in pg) at the beginning (T
0
) and at the end (T
f
) of the experiments.
Long-Term UVR Effects Upon Phytoplankton
Natural Communities of Patagonian Coastal Waters
237
To study changes in the size spectra of each treatment, we recorded digital images of each
sample and analyzed them to obtain the size (area) distribution of cells at the beginning of
the incubation as well as at the end of the exponential growth. The size spectra data (Fig. 4)
indicates that in both experiments most of the phytoplankton assemblages (> 60 %) were
dominated by small cells with an area < 100 µm
2
(Figs. 4A and C). A shift in the cumulative
frequency of cell size in the range of 65-395 µm
2
was observed in all radiation treatments of
MI (Fig 4B), being the P treatment the one with the higher change. On the other hand,
during MII (Fig 4D) a slightly different response was observed, as the P treatment showed
virtually no changes but the size distribution in the PAB treatment was slightly shifted
towards larger areas in the range 85-395 µm
2
. It has been usually found in other studies that
smaller cells tend to dominate the community after UVR-exposure (Mostajir et al. 1999), but
in our results this might be strongly affected by the initial conditions of each microcosm.
Also we can not rule out the effects of co-occurring predators (i.e., heterotrophic
microplankton). Similarly to what we expressed about the lack of UVR-only effects on
growth, we could speculate that UVR alone might not always show evident effects on size
distribution, but depending on the starting taxonomic composition of the community, both
PAR and UVR may have implications in the structure of the plankton community.
Fig. 4. Cumulative frequency of size (in µm
2
) at the beginning (T
0
) and at the end of the
exponential growth phase for MI (A) MII (C). In B) and C) a detailed view within the size
ranges of differences is shown. The radiation treatments are shown in different colors: P
(green), and PAB (red). Size distribution was evaluated in formalin-fixed samples from
pictures taken under an inverted microscope; images were analyzed using Image J software
(Abramoff et al. 2004).
Biomass and Remote Sensing of Biomass
238
Microscopical analyses of the communities also supported changes in cell size throughout
the experiments. For example, carbon allocated in the nanoplankton fraction (cells < 20 µm
in effective diameter) increased more rapidly than that of microplankton (> 20 µm) in MI
(Fig. 5A), but the opposite occurred in MII (Fig. 5 B). Also, there was a general decrease in
the microplankton biomass from T
0
towards the end of the experiments (Fig 5C) as was also
expected from the shift towards smaller cells in MI (Fig 4B). However, the decrease was more
pronounced in MI than in MII, therefore the overall result was that the relative contribution of
microplankton to the total biomass in MII was higher than during MI (Fig 5C).
Fig. 5. Autotrophic carbon (in μg C l
-1
) of the phytoplankton size classes: A) Nanoplankton
(<20 µm) and, B) Microplankton (≥20 µm). C) Relative contribution of nanoplankton and
microplankton (%) to the total autotrophic carbon at the beginning (T
0
) and at the end of the
MI and MII experiments. The radiation treatments / size fractions are shown in different
colors: P (green) and PAB (red) / microplankton (green) and nanoplankton (orange). The
vertical lines on the symbols indicate the half mean range.
Long-Term UVR Effects Upon Phytoplankton
Natural Communities of Patagonian Coastal Waters
239
Any change in cell size and biomass allocation might occur within a particular species
however they normally are associated to change in taxonomic composition towards the
most resistant or acclimated groups. In fact, the most evident effect of UVR exposure (as
compared to samples in which UVR was excluded) over long periods of time are the
taxonomic changes produced in the community, which act as a photoacclimation
mechanism. There are many studies that have reported this effect in long-term experiments
(see review by Villafañe et al. 2003) but in particular, and for the Patagonia area, Hernando
et al. (2006) working with the communities off the Beagle Channel observed changes from
an assemblage co-dominated by phytoflagellates and diatoms at the beginning of the
experiments to a progressive increase of euglenophytes, especially under static conditions of
Fig. 6. Autotrophic carbon (in μg C l
-1
) of: A) Diatoms, B): Flagellates and, C) Dinoflagellates
during the experiments MI and MII. The radiation treatments are shown in different colors:
P (green), and PAB (red); different lines in panel A indicate the contribution to the total of
centric (solid lines) and of pennate diatoms (dotted lines). The vertical lines on the symbols
indicate the half mean range.
Biomass and Remote Sensing of Biomass
240
the water column. In studies carried out with communities off the Chubut coast, Helbling et
al. (2005) and Marcoval et al. (2008) also found that solar radiation played a fundamental
role in shaping phytoplankton communities. In order to further explore these changes in
species composition in our experiments, in Fig. 6 we show the contribution of the three main
taxonomic groups - diatoms (centric and pennates), flagellates and dinoflagellates.
Overall, no UVR effects were observed in the diatoms in both experiments (Fig. 6A) while
significant differences among radiation treatments became evident in flagellates (Fig. 6B)
and in dinoflagellates (Fig. 6C). For example, autotrophic carbon in flagellates was
negatively affected by UVR, resulting in significantly lower values in samples receiving
UVR (PAB treatment) as compared to those that received only PAR (P treatment). On the
contrary, autotrophic carbon in dinoflagellates was higher in samples receiving UVR.
Previous studies (Hernando and San Román 1999; Hernando et al. 2005) have shown similar
results about the sensitivity of flagellates. In the case of dinoflagellates, their response seems
to be more related to the size as shown by Helbling et al. (2008) where larger species (i.e.,
Prorocentrum micans, 50 μm mean diameter) were less sensitive than small ones such as
Gymnodinium chlorophorum (5 μm) and Heterocapsa triquetra (20 μm).
However, the overall picture in our experiments shows a significantly higher increase of
autotrophic carbon in diatoms (both centric and pennates) (Fig. 6A) with centric diatoms
always accounting for the higher share at the end of the experiments, as compared to
flagellates (Fig. 6B) and dinoflagellates (Fig. 6C). This differential increase in autotrophic
carbon caused a shift in the community dominance from a flagellate-dominated community
towards a diatom-dominated one (Fig. 7).
Fig. 7. Autotrophic carbon in diatoms, flagellates and dinoflagellates during the MI and MII
experiments. The radiation treatments are shown in different colors: P (green), and PAB
(red); filled lines: diatoms, dotted lines with squares: flagellates and dotted lines with
diamonds: dinoflagellates. The vertical lines on the symbols indicate the half mean range.
Long-Term UVR Effects Upon Phytoplankton
Natural Communities of Patagonian Coastal Waters
241
It should be noted that at the beginning of the experiments, the contribution of diatoms to
the total abundance and biomass was very small (Figs. 6 and 7) and they were represented
by Thalassiosira spp., Niztschia longissima, Skeletonema costatum, Asterionellopsis glacialis and
unidentified pennates, among some others. However, by the end of the experiment, centric
diatoms accounted for ca. 75% and 66% of the total autotrophic carbon for MI and MII,
respectively. By the end of MI, and in both radiation treatments Thalassiossira spp. with a
size range of 10-20 µm almost completely dominated the assemblages (Fig. 8). On the other
hand, in MII there was a co- dominance of Thalassiossira spp. of 10-20 µm size and larger
ones (> 20 µm).
Fig. 8. Relative contribution of diatoms to the total autotrophic carbon at the beginning (T
0
)
and at the end of experiments. The size classes of Thalassiosira (Th.) are shown in different
colors: > 20 µm (yellow), 10-20 µm (red); other diatoms are represented in green.
So far, two main outcomes can be suggested from our data, one is related to changes in cell
size (and consequently those on biomass, Chl a content per cell, etc.) and the other is that in
species composition towards a diatom-dominated (mainly centric) assemblages. Although
these are important acclimation mechanisms occurring over longer periods of time, there are
also alternative ones to cope with UVR and excess of irradiance. One of such mechanism is,
as previously mentioned, the synthesis of UV-absorbing compounds (mainly mycosporine
like amino acids, MAAs). It has been found that even MAAs are generally very low in
natural communities of Patagonia (Barbieri et al. 2002; Villafañe et al. 2004a; Villafañe et al.
2004c; Marcoval et al. 2008) but some species i.e., dinoflagellates such as Prorocentrum micans
are able to synthesize them in high amounts after prolonged UVR exposure (Marcoval et al.
2007; Helbling et al. 2008); diatoms are also known to produce relatively high amounts
(Lagunas et al., unpubl. data). It has also been shown that the synthesis of UV-absorbing
compounds is more effective in large cells whereas in small species their synthesis would be
too costly and osmotically disadvantageous (Garcia-Pichel 1994). In addition, previous
Biomass and Remote Sensing of Biomass
242
studies (Helbling et al. 1996) showed that centric diatoms were able to synthesize significant
amounts of UV-absorbing compounds after long-term exposure to UVR, whereas pennates
did not. In our study case it is interesting to note that no significant changes in the
concentration of UV-absorbing compounds were observed during MI (data not shown)
probably due to the dominance of small diatom species during the experiment (Fig. 8). On
the contrary, during MII there was a significant increase of UV-absorbing compounds (Fig
9). This increase, relative to the Chl a content, was significant (Fig 9B) but there were no
differences among radiation treatments, suggesting that all wavelengths of solar radiation
triggered the synthesis of these compounds, as also observed for Antarctic diatoms
(Helbling et al. 1996). A possible explanation is that high solar radiation in their natural
environment will include PAR and UVR, therefore PAR as well as UVR may be capable of
triggering the synthesis of MAAs so Thalassiossira spp. can obtain protection against solar
UVR (Helbling et al. 1996). The presence of UV-absorbing compounds in MII probably
reflects the higher proportion of large Thalassiossira species during this experiment (Fig 8)
and also of dinoflagellates, although in lesser extent (Fig 6 C).
Fig. 9. A) Absorption spectra at the beginning (T
0
) and at the end of the MII experiment: B)
UV-absorbing compounds relative to Chl a content (OD
337
per µg Chl a
-1
) throughout the
experiment. UV-absorbing compounds were estimated as described in Dunlap et al. (1995)
using the peak height at 337 nm. The radiation treatments are shown in different colors: P
(green), PA (blue) and PAB (red); dotted lines represent T
0
.
Long-Term UVR Effects Upon Phytoplankton
Natural Communities of Patagonian Coastal Waters
243
5. Ecological implications
All together, this study indicates that within the experimental time frame, UVR effects are
more evident in the taxonomic composition of the community than on algal growth /
biomass. As stated above, the “starting point” of the studied community was very important
in our incubations, therefore stressing the role of combined factors and preventing simple
extrapolations. Also it suggests that it is not possible to generalize the solar radiation effects
on diverse phytoplankton assemblages: Other factors such as previous light history,
gradients of temperature and nutrient availability, in turn related to water turbulence and /
or UML depth are very important to understand the observed responses. For example, even
when both microcosms showed a sustained growth during several days, the final
distribution of the autotrophic carbon was very different in each case. This may have
important consequences for the available energy sources in the pelagic food web, as species
and size distribution are two of the main factors affecting the chances of a phytoplankton
cell being ingested by a predator. A community with a different carbon source will function
and respond in a different way when exposed to UVR and other factors. It may be difficult
to evaluate these scenarios with Chl a estimations obtained from remote sensing techniques,
but additional in-situ research in this topic would help us to validate those estimations
which proved to be useful for regional-global comparisons.
6. Acknowledgments
We thank V. Fiorda and E. Heimsch for their help during experiments. We are also grateful
with personnel at Estación Marítima Comersonii at Puerto Rawson for sampling collection
for our experiments. This work was supported by Agencia Nacional de Promoción
Científica y Tecnológica (PICT2007-01651, Argentina), Consejo Nacional de Investigaciones
Científicas y Técnicas (CONICET, Argentina) – Deutsche Forschungsgemeinschaft (DFG,
Germany) (CONICET-DFG-2009), Ministerio de Ciencia, Tecnología e Innovación
Productiva (MINCyT, Argentina) – Consejo Nacional de Ciencia y Tecnología (CONACYT,
Mexico) (Project N° MX/09/13) and Fundación Playa Unión. This work is in partial
fulfillment of the Ph.D. thesis of SRH, supported by a scholarship from Agencia Nacional de
Ciencia and Instituto Nacional del Agua (Argentina). This is Contribution N° 124 of Estación
de Fotobiología Playa Unión.
7. References
Abramoff MD, Magelhaes PJ, Ram SJ (2004). Image processing with ImageJ. Biophotonics
International, 11, 36-42
Andersson B, Barber J (1996). Mechanisms of photodamage and protein degradation during
photoinhibition of photosystem II. In: Photosynthesis and the environment, Baker NJ
(ed) pp 101-121, Kluwer Academic Publishers, Boston
Atkinson RJ, Matthews WA, Newman PA, Plumb RA (1989). Evidence of the mid-latitude
impact of Antarctic ozone depletion. Nature, 340, 290-294
Banaszak AT (2003). Photoprotective physiological and biochemical responses of aquatic
organisms. In: UV effects in aquatic organisms and ecosystems, Helbling EW, Zagarese
HE (eds), pp 329-356, The Royal Society of Chemistry, Cambridge
Biomass and Remote Sensing of Biomass
244
Barbieri ES, Villafañe VE, Helbling EW (2002). Experimental assessment of UV effects upon
temperate marine phytoplankton when exposed to variable radiation regimes.
Limnology and Oceanography, 47, 1648-1655
Beardall J, Sobrino C, Stojkovic S (2009). Interactions between the impacts of ultraviolet
radiation, elevated CO
2
, and nutrient limitation on marine primary producers.
Photochemical and Photobiological Sciences, 8, 1257–1265
Belzile C, Demers S, Ferreyra GA, Schloss I, Nozais C, Lacoste K, Mostajir B, Roy S, Gosselin
M, Pelletier E, Gianesella SMF, Vernet M (2006). UV Effects on marine planktonic
food webs: A synthesis of results from mesocosm studies. Photochemistry and
Photobiology, 82, 850-856
Buma AGJ, Boelen P, Jeffrey WH (2003). UVR-induced DNA damage in aquatic organisms.
In: UV effects in aquatic organisms and ecosystems, Helbling EW, Zagarese HE (eds),
pp 291-327, The Royal Society of Chemistry, Cambridge
Caille G, Gonzalez R, Gostonyi A, Ciocco NF (1997) Especies capturadas por las flotas de
pesca costera en Patagonia, Informes Técnicos. Plan Manejo Integrado Zona
Costera Patagónica, 27, 1–21.
Cooke SL, Williamson CE, Hargreaves BR, Morris DP (2006). Beneficial and detrimental
interactive effects of dissolved organic matter and ultraviolet radiation on
zooplankton in a transparent lake. Hydrobiologia, 568, 15-28
Dunlap WC, Rae GA, Helbling EW, Villafañe VE, Holm-Hansen O (1995). Ultraviolet-
absorbing compounds in natural assemblages of Antarctic phytoplankton. Antarctic
Journal of the United States, 30, 323-326
Dunne RP (2010). Synergy or antagonism—interactions between stressors on coral reefs.
Coral Reefs, 29, 145-152
Falkowski PG (1981). Light shade adaptation and assimilation numbers. Journal of Plankton
Research, 3, 203-216
Fiorda Giordanino MV, Strauch SM, Villafañe VE, Helbling EW (2011). Influence of
temperature and UVR on photosynthesis and morphology of four species of
cyanobacteria. Journal of Photochemistry and Photobiology B: Biology, 103, 68-77
Forster R, Schubert H (2001). The effects of ultraviolet radiation on the planktonic
community of a shallow, eutrophic estuary: Results of mesocosm experiments.
Helgoland Marine Research, 55, 23-34
Furgal JA, Smith REH (1997). Ultraviolet radiation and photosynthesis by Georgian Bay
phytoplankton of varying nutrient and photoadaptive status. Canadian Journal of
Fisheries and Aquatic Sciences, 54, 1659-1667
Gao K, Li G, Helbling EW, Villafañe VE (2007). Variability of UVR effects on photosynthesis
of summer phytoplankton assemblages from a tropical coastal area of the South
China Sea. Photochemistry and Photobiology, 83, 802-809
Garcia-Pichel F (1994). A model for internal self-shading in planktonic organisms and its
implications for the usefulness of ultraviolet sunscreens. Limnology and
Oceanography, 39, 1704-1717
Gonçalves RJ, Souza MS, Aigo J, Modenutti B, Balseiro E, Villafañe VE, Cussac V, Helbling
EW (2010). Responses of plankton and fish from temperate zones to UVR and
temperature in a context of gobal change. Ecología Austral, 20, 129-153
Long-Term UVR Effects Upon Phytoplankton
Natural Communities of Patagonian Coastal Waters
245
Guillard RRL, Ryther JH (1962). Studies of marine planktonic diatoms. I. Cyclotella nana
Hustedt, and Detonula confervacea (Cleve) Gran. Canadian Journal of Microbiology, 8,
229-239
Häder D-P, Helbling EW, Williamson CE, Worrest RC (2011). Effects of UV radiation on
aquatic ecosystems and interactions with climate change. Photochemical and
Photobiological Sciences, 10, 242-260
Häder D-P, Lebert M, Schuster M, del Ciampo L, Helbling EW, McKenzie R (2007).
ELDONET - A decade of monitoring solar radiation on five continents.
Photochemistry and Photobiology, 83, 1384-1357
Halac SR, Felip M, Camarero L, Sommaruga-Wögrath S, Psenner R, Catalan J, Sommaruga R
(1997). An in situ enclosure experiment to test the solar UVB impact on plankton in
a high-altitude mountain lake. I. Lack of effect on phytoplankton species
composition and growth. Journal of Plankton Research, 19, 1671-1686
Halac SR, García-Mendoza E, Banaszak AT (2009). Ultraviolet radiation reduces the
photoprotective capacity of the marine diatom Phaeodactylum tricornutum
(Bacillariophyceae, Heterokontophyta). Photochemistry and Photobiology, 85, 807-815
Halac SR, Villafañe VE, Helbling EW (2010). Temperature benefits the photosynthetic
performance of the diatoms Chaetoceros gracilis and Thalassiosira weissflogii when
exposed to UVR. Journal of Photochemistry and Photobiology, B: Biology, 101, 196-205
Helbling EW, Barbieri ES, Marcoval MA, Gonçalves RJ, Villafañe VE (2005). Impact of solar
ultraviolet radiation on marine phytoplankton of Patagonia, Argentina.
Photochemistry and Photobiology, 81, 807-818
Helbling EW, Buma AGJ, Van de Poll W, Fernández Zenoff MV, Villafañe VE (2008). UVR-
induced photosynthetic inhibition dominates over DNA damage in marine
dinoflagellates exposed to fluctuating solar radiation regimes. Journal of
Experimental Marine Biology and Ecology, 365, 96-102
Helbling EW, Chalker BE, Dunlap WC, Holm-Hansen O, Villafañe VE (1996).
Photoacclimation of antarctic marine diatoms to solar ultraviolet radiation. Journal
of Experimental Marine Biology and Ecology, 204, 85-101
Helbling EW, Gao K, Gonçalves RJ, Wu H, Villafañe VE (2003). Utilization of solar UV
radiation by coastal phytoplankton assemblages off SE China when exposed to fast
mixing. Marine Ecology Progress Series, 259, 59-66
Helbling EW, Pérez DE, Medina CD, Lagunas MG, Villafañe VE (2010). Phytoplankton
distribution and photosynthesis dynamics in the Chubut River estuary (Patagonia,
Argentina) throughout tidal cycles Limnology and Oceanography, 55, 55-65
Helbling EW, Zagarese HE (2003). UV effects in aquatic organisms and ecosystems. The Royal
Society of Chemistry, Cambridge
Hernando MP, Schloss I, Roy S, Ferreyra G (2006). Photoacclimation to long-term ultraviolet
radiation exposure of natural sub-Antarctic phytoplankton communities: Fixed
surface incubations versus mixed mesocosms. Photochemistry and Photobiology, 82,
923-935
Hernando MP, Malanga G, Ferreyra GA (2005). Oxidative stress and antioxidant defenses
generated by solar UV in a sub-Antarctic marine phytoflagellate. Scientia Marina,
68, 287-295
Biomass and Remote Sensing of Biomass
246
Hernando MP, San Román N (1999). Preliminary data on chronic effects of ultraviolet
radiation on the growth of some phytoplankton species of the Beagle Channel,
Argentina. Scientia Marina, 63, 81-88
Hillebrand H, Dürselen CD, Kirschtel D, Pollingher U, Zohary T (1999). Biovolume
calculation for pelagic and benthic microalgae. Journal of Phycology, 35, 403-424
Holm-Hansen O, Riemann B (1978). Chlorophyll a determination: improvements in
methodology. Oikos, 30, 438-447
Keller AA, Hargraves P, Jeon H, Klein-Macphee G, Klos E, Oviatt C, Zhang J (1997).
Ultraviolet-B radiation enhancement does not affect marine trophic levels during a
winter-spring bloom. Ecoscience, 4, 129-139
Korbee N, Figueroa FL, Aguilera J (2006). Acumulación de aminoácidos tipo micosporina
(MAAs): Biosíntesis, fotocontrol y funciones ecofisiológicas. Revista Chilena de
Historia Natural, 79, 119-132
Lutz VA, Segura V, Dogliotti AI, Gagliardini DA, Bianchi AA, Balestrini CF (2010). Primary
production in the Argentine Sea during spring estimated by field and satellite
models. Journal of Plankton Research, 32, 181-195
Marcoval MA, Villafañe VE, Helbling EW (2007). Interactive effects of ultraviolet radiation
and nutrient addition on growth and photosynthesis performance of four species of
marine phytoplankton. Journal of Photochemistry and Photobiology, B: Biology, 89, 78-
87
Marcoval MA, Villafañe VE, Helbling EW (2008). Combined effects of solar ultraviolet
radiation and nutrients addition on growth, biomass and taxonomic composition of
coastal marine phytoplankton communities of Patagonia. Journal of Photochemistry
and Photobiology, B: Biology, 91, 157-166
Montecino V, Molina X, Martínez G, Olmedo MI, Retamal L, Hannach G, Orellana MV
(2001). Ecophysiological strategies in response to UV-B radiation stress in cultures
of temperate microalgae isolated from the Pacific coast of South America. Revista
Chilena de Historia Natural, 74, 293-311
Mostajir B, Demers S, de Mora S, Belzile C, Chanut J-P, Gosselin M, Roy S, Villegas PZ,
Fauchot J, Bouchard JN, Bird D, Monfort P, Levasseur M (1999). Experimental test
of the effect of ultraviolet-B radiation in a planktonic community. Limnology and
Oceanography, 44, 586-596
Mousseau L, Gosselin M, Levasseur M, Demers S, Fauchot J, Roy S, Villegas PZ, Mostajir B
(2000). Effects of ultraviolet-B radiation on simultaneous carbon and nitrogen
transport rates by estuarine phytoplankton during a week-long mesocosm study.
Marine Ecology Progress Series, 199, 69-81
Müller P, Li X-P, Niyogi KK (2001). Non-photochemical quenching. A response to excess
light energy. Plant Physiology, 125, 1558-1566
Neale PJ, Helbling EW, Zagarese HE (2003). Modulation of UVR exposure and effects by
vertical mixing and advection. In: UV effects in aquatic organisms and ecosystems,
Helbling EW, Zagarese HE (eds), pp 108-134, Royal Society of Chemistry
Nilawati J, Greenberg BM, Smith REH (1997). Influence of ultraviolet radiation on growth
and photosynthesis of two cold ocean diatoms. Journal of Phycology, 33, 215-224
Osburn CL, Morris DP (2003). Photochemistry of chromophoric dissolved organic matter in
natural waters. In: UV effects in aquatic organisms and ecosystems, Helbling EW,
Zagarese H (eds), pp 185-217, The Royal Society of Chemistry, Cambridge
Long-Term UVR Effects Upon Phytoplankton
Natural Communities of Patagonian Coastal Waters
247
Porra RJ (2002). The chequered history of the development and use of simultaneous
equations for the accurate determination of chlorophylls a and b. Photosynthesis
Research, 73, 149-156
Richter PR, Häder D-P, Goncalves RJ, Marcoval MA, Villafañe VE, Helbling EW (2007).
Vertical migration and motility responses in three marine phytoplankton species
exposed to solar radiation. Photochemistry and Photobiology, 83, 810-817
Roy S, Mohovic B, Gianesella SMF, Schloss IR, Ferrario ME, Demers S (2006). Effects of
enhanced UV-B on pigment-based phytoplankton biomass and composition of
mesocosm-enclosed natural marine communities from three latitudes.
Photochemistry and Photobiology, 82, 909-922
Seckmeyer G, McKenzie RL (1992). Increased ultraviolet radiation in New Zealand (45 ºS)
relative to Germany (48 ºN). Nature, 359, 135-137
Skewgar E, Boersma PD, Harris G, Caille G (2007). Sustainability: Anchovy fishery threat to
Patagonian ecosystem. Science, 315, 45
Sobrino C, Neale PJ (2007). Short-term and long-term effects of temperature on
photosynthesis in the diatom Thalassiosira pseudonana under UVR exposures. Journal
of Phycology, 43, 426-436
Sommaruga R (2003). UVR and its effects on species interactions. In: UV effects in aquatic
organisms and ecosystems, Helbling EW, Zagarese H (eds), pp 485-508, The Royal
Society of Chemistry, Cambridge
Strathmann RR (1967). Estimating the organic carbon content of phytoplankton from cell
volume or plasma volume. Limnology and Oceanography, 12, 411-418
Vernet M (2000). Effects of UV radiation on the physiology and ecology of marine
phytoplankton. In: The effects of UV radiation in the marine environment, de Mora S,
Demers S, Vernet M (eds), pp 237-278, Cambridge University Press, Cambridge
Villafañe VE, Barbieri ES, Helbling EW (2004a). Annual patterns of ultraviolet radiation
effects on temperate marine phytoplankton off Patagonia, Argentina. Journal of
Plankton Research, 26, 167-174
Villafañe VE, Buma AGJ, Boelen P, Helbling EW (2004b). Solar UVR-induced DNA damage
and inhibition of photosynthesis in phytoplankton from Andean lakes of
Argentina. Archiv für Hydrobiologie, 161, 245-266
Villafañe VE, Helbling EW, Zagarese HE (2001). Solar ultraviolet radiation and its impact on
aquatic systems of Patagonia, South America. Ambio, 30, 112-117
Villafañe VE, Janknegt PJ, de Graaff M, Visser RJW, van de Poll WH, Buma AGJ, Helbling
EW (2008). UVR-induced photoinhibition of summer marine phytoplankton
communities from Patagonia. Marine Biology, 154, 1021-1029
Villafañe VE, Marcoval MA, Helbling EW (2004c). Photosynthesis versus irradiance
characteristics in phytoplankton assemblages off Patagonia (Argentina): Temporal
variability and solar UVR effects. Marine Ecology Progress Series, 284, 23-34
Villafañe VE, Reid FMH (1995). Métodos de microscopía para la cuantificación del
fitoplancton. In: Manual de Métodos Ficológicos, Alveal K, Ferrario ME, Oliveira EC,
Sar E (eds), pp 169-185, Universidad de Concepción, Concepción, Chile
Villafañe VE, Sundbäck K, Figueroa FL, Helbling EW (2003). Photosynthesis in the aquatic
environment as affected by UVR. In: UV effects in aquatic organisms and ecosystems,
Helbling EW, Zagarese HE (eds), pp 357-397, Royal Society of Chemistry
Biomass and Remote Sensing of Biomass
248
Wängberg S-A, Andreasson KIM, Gustavson K, Reinthaler T, Henriksen P (2008). UV-B
effects on microplankton communities in Kongsfjord, Svalbard – A mesocosm
experiment. Journal of Experimental Marine Biology and Ecology, 365, 156-163
Wängberg S-Å, Garde K, Gustavson K, Selmer J-S (1999). Effects of UVB radiation on marine
phytoplankton communities. Journal of Plankton Research, 21, 147-166
Wängberg SA, Selmer JA, Gustavson K (1996). Effects of UV-B radiation on biomass and
composition in marine phytoplankton communities. Scientia Marina, 60, 81-88
Whitehead RF, de Mora S, Demers S, Gosselin M, Monfort P, Mostajir B (2000). Interactions
of ultraviolet-B radiation, mixing, and biological activity on photobleaching of
natural chromophoric dissolved organic matter: A mesocosm study. Limnology and
Oceanography, 45, 278-291
14
In Situ Primary Production Measurements
as an Analytical Support to Remote Sensing
- An Experimental Approach to Standardize
the
14
C Incorporation Technique
Tamara Cibic and Damiano Virgilio*
Dipartimento di Oceanografia Biologica,
Istituto Nazionale di Oceanografia e Geofisica Sperimentale (OGS), Trieste,
*Current address: Regional Environmental Protection Agency-FVG, Palmanova,
Italy
1. Introduction
Primary production measurement in marine waters is one of the most important tools to
understand the ecosystem functioning and the transport of inorganic/organic matter
through the food web. Direct measurement of the driving process, that is photosynthesis, in
this dynamic system was first achieved using the Winkler technique for estimating
dissolved oxygen concentrations, introduced by Gaarder and Gran in 1927 (Williams et al.,
2002). Nowadays the light-dark bottle oxygen technique is considered not sensitive enough
and the rate had poor accuracy and precision (Marra, 2002).
The introduction of the
14
C technique changed the study of productivity (Marra, 2002). The
year 1952 marked the end of a century-long struggle to develop a method to determine oceanic
primary productivity with precision, accuracy and efficiency (Barber & Hilting, 2002).
Thousands of measurements of marine phytoplankton productivity have been made at
discrete locations throughout the world’s oceans since the introduction of the radiolabelled
carbon uptake method in 1952 (Steemann-Nielsen, 1952). Although numerous, these discrete
primary productivity measurements only provide information for infinitesimally small points
over the oceans’ surfaces. Scaling these discrete measurements to global projections by means
of satellite-based estimates requires mathematical models. Clearly, although much of the
discrepancy between modelled and measured production results from limitations of the
models, some of the disagreement is also due to methodological differences in
14
C
measurements and errors in the
14
C data (Behrenfeld & Falkowski, 1997). To compare
modelled primary production with that obtained in situ, a high quality database of
14
C
measurements is required. Calculating accurate primary production estimates over large areas
is a primary step for ecosystem models charged with the task of assessing trophic dynamics.
Reliable estimates of primary production are also necessary for multiple other applications,
including quantifying the flux of carbon dioxide, assessing export production and estimating
production of climate-active gases such as dimethyl sulphide. Estimating accurate primary
production on global scales is also essential to understanding the consequences of climate
change on phytoplankton growth (Friedrichs et al., 2009).
Biomass and Remote Sensing of Biomass
250
The
14
C method is relatively simple. A known amount of
14
C-CO
2
is added to bottles
containing the water samples and after an incubation time the organic carbon is frequently
separated from the remaining inorganic carbon by filtration (Peterson, 1980). Several
debates have arisen from the comparison of the results obtained with the
14
C method and
the Winkler method, the latter largely used for primary production estimates before 1952
(Peterson, 1980). In 1972 Schindler and co-workers modified the
14
C method proposed 20
years earlier by Steemann-Nielsen. The authors described a method in which the samples
were not filtered, in order to avoid the rupture of cells during filtration and loss during
drying of filters that can still cause underestimation of primary production (Theodórsson &
Bjarnason, 1975). The problems encountered in filtering and the somewhat arbitrary nature
of the separation between dissolved and particulate matter led to the development of the
acidification and bubbling procedure (Peterson, 1980). Unfortunately, this technique does
not permit to assess the two fractions of primary production labelled with
14
C-CO
2
: POC
(Particulate Organic Carbon, corresponding to the
14
C retained in the autotrophic cells) and
DOC (Dissolved Organic Carbon, released from the autotrophic cells). Therefore this
technique is not useful to understand the transformation of the organic matter along the
trophic levels, in particular the link between autotrophic production and other levels of the
marine food web. In most of the references regarding primary production in the water
column, the method usually applied to stop the process and remove the excess labelled
14
C
was filtration and subsequent acidification with HCl (Table 1).
HCl sample volume reference
filters wetted with 1N 50 ml (filter) Babin et al., 1994
concentrated acid fumes 75 ml (filter for POC production)
100 µl of 18.5% acid 5 ml (filtrated for DOC production)
filters rinsed twice with 1N 50 ml (filter) Hewson et al., 2001
1 ml, 2M (filters stored for 2-3
da
y
s at -20°C before acidification
and counting)
100-500 ml (filter) for primary production
estimate
Karl et al., 1998
0.5 ml, 6N 1 ml (total sample) Lewis & Smith, 1983
200 µl, 0.1N 50 ml (filter) Mangoni et al,. 2008
concentrated acid fumes 5 ml (filter for POC production)
100 µl of 50% acid 5 ml (filtrated for DOC production)
100 µl of 50% acid 5 ml (total sample for TOC production)
500 µl, 0.5N 320 (?) ml (filter) Moutin & Raimbault, 2002
2 drops of 5N not available O'Donohue & Dennison, 1997
0.5 ml, 6N 5 ml (filtrated for extracellular release)
0.5 ml, 6N 5 ml (total primary productivity)
fumes of concentrated acid 75 ml (filter) Teira et al., 2005
Marañón et al., 2004
Pugnetti et al., 2005
Cermeño et al., 2006
Table 1. Summary of currently in use primary production filtration and acidification
methods. POC = particulate organic carbon; DOC = dissolved organic carbon.
Many authors use filters to estimate primary production, without considering the filtrated
fraction, which corresponds to the exudate release, nor the total sample. Moreover, different
HCl concentrations are used in the reported papers. When samples are filtered, filters can be
wetted or rinsed with acid (Babin et al., 1994; Hewson et al., 2001) or, in more recent studies,
exposed to concentrated acid fumes (Cermeño et al., 2006; Marañón et al., 2004; Teira et al.,
2005). The added HCl concentration ranged from 0.1N (Mangoni et al., 2008) to 6N (Lewis &
Smith, 1983; Pugnetti et al., 2005). Considering different acid volumes added to different