Evaporation Condensation and Heat transfer Part 10 pdf
Bạn đang xem bản rút gọn của tài liệu. Xem và tải ngay bản đầy đủ của tài liệu tại đây (1.95 MB, 40 trang )
Evaporation, Condensation and Heat Transfer
350
Contemporary architecture shows an increased interest in the building envelope, such as
evidenced by the words of Herzog: "It is meaningful to talk about of the building envelope as a"
skin "and not merely a "protection", something that "breathes", which governs the weather and
environmental conditions between the inside and outside, similar to that of humans. "
Among the examples of structures that use the system of the ventilated facade is possible to
cite the Jewish Museum in Berlin of Libeskind, the Gehry's Guggenheim Museum in Bilbao
and the Theatre La Scala in Milan built by Botta.
The use of ventilated walls and roof is also a useful application in case of restoration and
renovation of old buildings. There is a significant number of legislative measures to promote
increases in volume when they produce an improvement in the energy behavior of the
building.
From a structural viewpoint, a ventilated facade presents an outer facing attached to the
outer wall of the building through a structure of vertical and horizontal aluminum alloy or
other high-tech materials, so as to leave between the outer and inner wall surfaces a "blade"
of air. Often the gap is partially occupied by a layer of insulating material attached to the
wall of the building, to form a "coat" protected from atmospheric agents by the presence of
the external face of the ventilated facade.
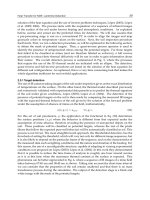
Each of the layers that make up the ventilated wall has a very specific function (see fig.1):
1. The outer coating is designed to protect the building structure from atmospheric
agents, as well as being the finishing element that confers the building aesthetic
character. Among the coating systems can be distinguished those made of "traditional
materials" and those made using "innovative materials "(metal alloys or plastics).
Recently found increasing use materials already widely used in traditional as ceramic
or brick, produced and implemented in a completely innovative way, such as
assembly of prefabricated modular panels attached by mechanical means without
recourse traditional mortars. This application has many advantages such as ease of
installation and maintenance, both favored by the possibility of intervention on each
slab.
2. The resistant layer, which can either be made of load-bearing walls (made of bricks,
blocks of lightweight concrete or brick) or traditional masonry (brick or stone, mixed) to
be recovered and been rebuilt, is that to which is secured by an anchoring system
properly sized, the outer coating.
3. The insulating layer has the task to cancel the thermal bridges, forming an effective
barrier to heat loss. The uneven distribution of surface temperatures, especially in
modern building which is in fact discontinuous in shape and heterogeneity of materials,
determines areas of concentration of heat flux. This problem is drastically reduced by
the system of insulation coat, which surrounds the building with a cover of uniform
thermal resistance with significant energy benefits.
4. The anchoring structure (substructure), usually made of aluminum alloy is directly
anchored to the inner wall using special anchors. Since its function is to support the
weight of the external coating, the choice of the kind of structure and the sizing must
take into account such factors as the weight of the coating, the characteristics of the
surrounding environment and the climate of the area (wind, rain, etc.).
5. The air gap between the resistant element and the coating is the layer within which
generates an upward movement of air, the chimney effect, triggered by heating of the
external coating.
Computational Fluid Dynamic Simulations of Natural Convection in Ventilated Facades
351
Fig. 1. Ventilated facade - Section
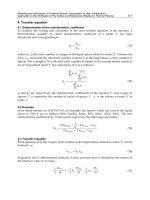
From a thermo-fluid dynamic viewpoint , during summer period, the outside air entering in
the cavity, is heated by contact with the external face at a higher temperature due to the
incident solar radiation. This causes a change in air density inside the air gap and the
formation of an upward movement that produces a benefit especially in the summer (see
fig.2 a) because it eliminates some of the heat that is not reflected by coating.
During the winter season (see fig.2 b) the solar radiation incident on the structure is much
smaller than in summer and the air outside and inside the gap have approximately the same
temperature, resulting in a very reduced stack effect. The movement of air allows the
evacuation of water vapor decreasing the possibility of interstitial condensation.
The study of the energy performance of ventilated walls requires a CFD analysis of the
airflow within the cavity both in cases where it is due only to thermal and pressure
gradients (chimney effect), and when it is induced by the propulsion of fans (forced
convection).
This thermo-fluid dynamics analysis of the ventilated cavity is a very complex procedure,
which requires a very detailed knowledge of the geometry of the system and thermo
physical properties of materials.
These elements, in addition to the difficulties in the determination of the convective
coefficients the approximations necessary for the values used for the boundary conditions
can drastically reduce the reliability of CFD methods based on numerical solution of this
problem.
Evaporation, Condensation and Heat Transfer
352
Fig. 2. Summer (a) and winter (b) functioning of ventilated facade
3. The calculation model
Authors have developed a calculation model to evaluate the energy performances of the
ventilated façade. The first critical step of the numerical solution of a thermo-fluid dynamics
problem is the identification of an appropriate physical model able to describe the real
problem.
The best choice is to use a physical model not excessively complex.
Therefore have been made two very important choices:
- The use of a two-dimensional geometric model;
- The introduction of the hypothesis of stationarity.
The ventilated walls object of the study have been schematized as a two-dimensional system
(see fig.3) consisting of two slabs, one internal and one external, which delimit a duct in
which the air flows. The structure has length “L” and thickness of the air gap “d”. The
Cartesian reference system has been placed with the origin at the beginning of the
ventilation duct, oriented with the y-axis in the direction of motion.
At the base and upper part of the facade there are two air vents, with height “a”, which
connect the ventilated cavity with the external environment.
Computational Fluid Dynamic Simulations of Natural Convection in Ventilated Facades
353
Fig. 3. Bi-dimensional model of ventilated facade
The second critical step in the numerical resolution of the problem is the characterization of
the heat exchanges.
The ventilated structure is characterized by the simultaneous presence of three types of heat
transfer: convection, conduction and radiation (see fig. 4).
Fig. 4. Heat exchanges
Evaporation, Condensation and Heat Transfer
354
The transmission of heat will be caused by:
- convective and radiative exchanges between the external environment and the exterior
surface of the coating;
- conductive heat exchange through the walls of the duct;
- radiative exchange between the two slabs delimiting the air gap;
- convective heat exchange between these slabs and the air circulating inside the channel;
- convective and radiative exchanges between the indoor and the intrados of the inner
wall.
The conductive heat transfer through the inner and outer walls has been characterized by
the conductive thermal resistance defined by:
i
cond
i
i
s
R
λ
=
∑
(1)
where s
i
and λ
i
and are respectively the thickness and thermal conductivity of the i-th layer
of the wall.
In steady-state analysis, the convective and the radiative heat transfers within the ventilated
cavity can be represented with an acceptable level of accuracy considering two thermal
resistances, r
1
and r
2
, expressed by the following equations :
0
1
0
A
AB
R
rr
rrR
=
++
and
0
2
0
B
AB
R
rr
rrR
=
++
(2)
where r
A
and r
B
are the thermal resistances due to the convective exchange between the fluid
and the two garments (A and B respectively), while the thermal resistance R
0
characterizes
the mutual radiative exchange between the two inner sides of the ventilated duct.
The thermal resistance R
0
has been expressed by the following equation:
12
0
11 112 22
111ee
R
Ae AF Ae
−−
=+ +
⋅⋅ ⋅
(3)
where A
1
and A
2
are the areas of the two slabs, F
12
is the view factor between the two
parallel surfaces, while e
1
and e
2
are the emissivity coefficient on both sides of the duct.
The convective thermal resistance (r
A
and r
B
) inside the ventilated channel have been
assessed using the relationship of Gnielinski valid for Reynolds numbers (Re) higher than
2300.
Using this model it is possible to calculate the Nusselt number of fluids in transient
conditions from linear to turbulent flow which can be expressed as:
()
()
0
23
Re 1000 Pr
8
1 12.7 Pr 1
8
Nu
ξ
ξ
−
=
+−
(4)
Where Pr is the Prandtl number and ξ represents the friction coefficient, calculated by means
of the correlation discovered by Petukhov reported below:
Computational Fluid Dynamic Simulations of Natural Convection in Ventilated Facades
355
()
2
1
1.82lo
g
Re 1.64
ξ
=
−
(5)
The influence of temperature has been considered with the introduction of the following
relation:
0.36
0
m
w
T
Nu Nu
T
⎛⎞
=
⎜⎟
⎜⎟
⎝⎠
(6)
where
T
m
is the mean temperature of the fluid in the cavity and T
w
is the temperature of the
wall of the ventilated duct.
The convective thermal resistances (
r
A
and r
B
) at inner and outer surfaces of the duct have
been calculated by the equations:
0.36
0
m
Au
wA h
T
rN
TD
λ
⎛⎞
=
⎜⎟
⎜⎟
⎝⎠
and
0.36
0
m
Bu
wB h
T
rN
TD
λ
⎛⎞
=
⎜⎟
⎜⎟
⎝⎠
(7)
where
D
h
is the hydraulic diameter defined as:
()
2
h
dL
D
dL
=
+
(8)
The third step of the numerical solution of the problem is the definition of energy and
motions equations for the flow of the air inside a cavity.
The steady state energy balance has been applied to a control volume, which represents the
whole of modules with two opaque layers separated by the air channel.
The time–averaged Navier-Stokes equations of motion for steady, compressible flow can be
written as :
-
Conservation of mass (continuity) in i
th
direction
()
0v
t
ρ
∂
+∇⋅ =
∂
G
(9)
Where ρ is the air density and v
G
the velocity vector
-
Conservation of momentum in i
th
direction
() ( )
()vvvp gF
t
ρρ τρ
∂
+∇ =−∇ +∇ + +
∂
G
G
GG G
(10)
where p is the static pressure,
τ
is the shear stress tensor, while g
ρ
G
and F
G
represent
respectively the body and the external forces.
-
Conservation of energy
()
(
)
()
e
ff
ii e
ff
h
i
EvEp kThj vS
t
ρρ τ
⎡⎤
∂
+∇⋅ + =∇⋅ ∇ − + ⋅ +
⎡⎤
⎢⎥
⎣⎦
∂
⎢⎥
⎣⎦
∑
G
GG
G
(11)
where
k
eff
is the effective conductivity.
Evaporation, Condensation and Heat Transfer
356
The first three terms in the right side of the equation represent energy exchanges due to
convection, conduction and viscous dissipation, while the term
S
h
includes the contributions
of the heat produced by chemical reactions.
The two transport equations for the standard
k-epsilon model, also derived from the Navier-
Stokes equations, can be written as follows:
-
Turbulent kinetic energy (k-equation)
()
()
t
ikbMk
ijkj
k
kku PPYS
tx x x
μ
ρρ μ ρε
σ
⎡⎤
⎛⎞
∂∂ ∂ ∂
⎢⎥
+=+++−−+
⎜⎟
⎜⎟
∂∂ ∂
⎢⎥
⎝⎠
⎣
⎦
(12)
-
Kinetic energy of turbulence dissipation (ε-equation)
()
() ()
2
132
t
ikb
ijkj
uCPCPCS
tx x xk k
εεεε
μ
εε ε
ρε ρε μ ρ
σ
⎡⎤
⎛⎞
∂∂ ∂ ∂
⎢⎥
+=+++−+
⎜⎟
⎜⎟
∂∂ ∂
⎢⎥
⎝⎠
⎣
⎦
(13)
Where the turbulent viscosity has been expressed as follow:
2
t
k
C
μ
μρ
ε
=
(14)
The production of turbulent kinetic energy
P
k
can be expressed by the equation:
2
kt
PS
μ
= (15)
where the term
S is the average strain tensor expressed by the relation:
2
ij ij
SSS≡ (16)
The effect of buoyancy forces is expressed by the following equation:
Pr
t
bi
ti
T
Pg
x
μ
β
∂
=
∂
(17)
where Pr
t
is the turbulent Prandtl number and g
i
is the component of gravity vector in the i-
th direction.
The constants have the following default values [1]:
C
1ε
=1,44, C
2ε
=1,92; C
3ε
=1; C
μ
=0,09; σ
ε
=1,3.and σ
k
=1,0.
The governing equations have been solved using the finite volumes method that is
particularly suitable for the integration of partial differential equations. These equations are
integrated in a control volume with boundary conditions imposed at the borders.
The interior of this domain is divided in many elementary volumes linked by mathematical
relationships between adjacent volumes so is possible to solve the Navier-Stokes equations
with the aid of a computer code.
4. Generation of the computational grid
The solution of differential equations using numerical methods requires computational
grids, commonly called meshes. The computational grid is a decomposition of the problem
space into elementary domains.
Computational Fluid Dynamic Simulations of Natural Convection in Ventilated Facades
357
The simplicity of the domain of study has allowed the use of a structured grid characterized
by the exclusive presence of 2D quadrilateral elements and a regular connectivity.
The computational grids used to simulate the behavior of air in ventilated cavities in this
study are simple quadrilateral mesh with a pitch of 0.5 cm in all directions.
The resolution of the numerical problem in the regions close to the solid walls, have a
significant impact on the reliability of the results obtained through numerical simulations,
because in these areas arise the phenomena of vorticity and turbulence requiring the use of
specific wall functions.
The analysis was performed used the method called enhanced wall treatment, which involves
the division of the computational domain in two regions: one where is predominant the
effect of turbulence and another in which prevails the effect of viscosity, depending on of
the value assumed by the turbulent Reynolds number, expressed using the following
equation:
Re
y
y
k
ρ
μ
= (18)
where y is the normal distance between the solid wall and the centers of the cell while k
represents the turbulent kinetic energy in correspondence the wall.
5. Boundary conditions
In mathematics, a boundary condition is a requirement that the solution of a differential
equation must satisfy on the margins of its domain. Differential equation admits an infinite
number of solutions and often
to fix some additional conditions is needed to identify a
particular solution, which will also be unique if the equation satisfies certain regularity
assumptions.
The inlet temperature T
0
has been imposed coincident with the external temperature Te,
while the pressure at the same section is equal to the atmospheric pressure p
0
=patm.
The outlet pressure p
L
has been determined using the relationship:
0
L
p
pgL
ρ
=− (19)
The pressure drop located at the openings connecting the ventilated cavity to the external
environment have been evaluated using the following equation:
2
2
v
pk
ρ
Δ= (20)
where v and ρ are the average velocity and density of the fluid while k is the localized loss
coefficient, obtained experimentally, which assumes values k
0
= 0.5 and k
L
= 1 respectively at
the inlet and the outlet sections.
The determination of turbulent flow parameters, k and ε, has previously required the
calculation of turbulent intensity Tu, which has been calculated using an empirical
correlation specifically adopted for flows in pipes:
(
)
v'
v
2
18
0.16 Re
h
D
Tu
−
⎛⎞
==
⎜⎟
⎝⎠
(21)
Evaporation, Condensation and Heat Transfer
358
The turbulent kinetic energy k has been calculated using: the equation:
()
2
3
2
kvTu=
(22)
where
v is the average velocity of flow.
The rate of turbulent kinetic energy dissipation ε has been calculated using the formula:
3
3
2
4
k
C
l
μ
ε
= (23)
where Cμ is a constant characteristic of the empirical k-ε turbulence model that assumes the
value of 0.01, while l is the turbulent length scale.
An approximate relationship between the physical size of the pipe is the following:
0.07lL= (24)
where L is the characteristic size of the duct, which in the case of channels with non-circular
section is coincident with the hydraulic diameter (L = Dh)
The boundary conditions for natural convection case are summarized in Table 1.
y = 0 y = L x = 0 x = d
p
p= p
0
p= p
0
-ρ
0
gL - -
T
T=T
0
- T= T
1
T= T
2
v
- - v=0 v=0
r
- - r=r
1
r=r
2
k
2
000
3
2
kk Tuv==
- k =0 k =0
ε
3
3
2
0
4
0
0
k
C
Tu
μ
εε
==
-
ε = 2 (μ/ρ)
3/2
0
w
C
k
x
μ
κμ
⎛⎞
⎛⎞
∂
⎜⎟
⎜⎟
⎜⎟
⎝⎠
⎝⎠
ε = 2 (μ/ρ)
3/2
0
w
C
k
x
μ
κμ
⎛⎞
⎛⎞
∂
⎜⎟
⎜⎟
⎜⎟
⎝⎠
⎝⎠
Table 1. Boundary conditions for natural convection case:
In the case of forced convection it has been defined the inlet velocity of the fluid while the
boundary conditions imposed on other elements of the geometry of the channel are
coincident with those used for the study carried out under natural convection.
6. The study sample
The studied case involved the analysis of a module with a length L = 6 m, and a depth D = 1
m. The characteristic size of the ventilated duct have been chosen according with the values
proposed by the reference in literature in order to obtain the best energy performance for
this kind of structure.
The Authors have studied four types of ventilated facade called respectively: P1, P2, P3 and
P4.
Computational Fluid Dynamic Simulations of Natural Convection in Ventilated Facades
359
Layer Material Width (m) ρ (kgm
-3
)
λ
(Wm
-1
K
-1
)
1 (Ext) Brick slabs 0.045 800 0.30
2 Air (ventilation duct) 0.10 - 0.56
3
Rigid fibreglass
panels
0.04 100 0.038
4 Cement mortar 0.015 2000 1.40
5 Brick in hollow blocks 0.18 1600 0.59
Facade P1
R
tnv
=1.855
m
2
KW
-1
6 (Int)
Lime mortar and
cement plastering
0.015 1800 0.90
1 (Ext) Slabs of ceramics 0.013 2700 1.00
2 Air (ventilation duct) 0.10 - 0.56
3
Rigid fibreglass
panels
0.03 100 0.038
4 Cement mortar 0.015 2000 1.40
5 Brick in hollow blocks 0.19 1200 0.43
Facade P2
R
tnv
=1.855
m
2
KW
-1
6 (Int)
Lime mortar and
cement plastering
0.015 1800 0.90
1 (Ext)
Cement fibred
reinforced panels
0.05 315 0.92
2 Air (ventilation duct) 0.10 - 0.56
3
Rigid fibreglass
panels
0.03 100 0.038
4 Cement mortar 0.015 2000 1.40
5
Brick in hollow blocks
of concrete
0.14 1100 0.35
Facade P3
R
tnv
=1.855
m
2
KW
-1
6 (Int)
Lime mortar and
cement plastering
0.015 1800 0.90
1 (Ext) Aluminum 0.001 2700 220
2 Vermiculite 0.026 90 0.08
3 Aluminum 0.001 2700 220
4 Air (ventilation duct) 0.10 - 0.56
5 Cement mortar 0.01 1800 0.70
6 Poroton Block 0.2 1600 0.17
Facade P4
R
tnv
=1.855
m
2
KW
-1
7 (Int)
Lime mortar and
cement plastering
0.015 1800 0.70
Table 2. Thermophysical characteristics of unventilated roofs.
Thermo-physical characteristics and geometry (thickness d, density ρ, solar absorptivity α,
and conductivity λ) of the four structures are showed in Table 2. The four samples of facade
have been chosen with the same value of thermal resistance (R
nv
=1,855m
2
kW
-1
) but different
external surface coating:
• facade P1 has a brick exterior coating;
Evaporation, Condensation and Heat Transfer
360
• facade P2 has a coating of ceramic tiles;
• facade P3 has a coating of cement fibred reinforced panels;
• facade P4 has an external coating made of insulated panels in vermiculite covered with
aluminum on both sides.
In all the studied cases, the outer layer is anchored to a supporting structure made of brick
blocks. The facades P1, P2 and P3 present the insulating layer, consisting of a rigid fibreglass
panel with a thickness of 4 cm, placed in the inner slab, while in the case of the facade P4 the
coating panel also acts as insulation layer.
The ventilation openings that connect the ventilated cavity with the external environment
are placed at the base and at the upper part of facade and have a size of 20 cm x 100 cm
The friction factors and heat transfer coefficients are assumed to be constant along the duct.
Generally, the roughness value of the air duct is assumed to be quite high in order to take
into account the presence of supports inside the air duct. Obviously this parameter is not
uniform throughout the whole structure but it is realistic in the portion of the channel that is
not affected by the presence of supporting elements.
Therefore the sensitivity analysis for this parameter have been performed.
The roughness
b has been varied from 0,005 m up to 0,03 m. This sensitive analysis didn’t
show significant variations both for the velocity profiles and for the energy performance of
the ventilated facade. The value of roughness has been estimated as b = 0,02 m.
The solar absorptivity coefficient α has been defined constant because its difference between
the three studied cases is about from 0.02 up to 0.04, so it involves only a few hundredths of
temperature degrees changes in the temperature sun-air
T
as
. According to the studies in
references the solar absorption coefficient has been fixed in
α = 0,8.
Thermal resistances of inner and outer surfaces have been defined respectively r
i
=0.13
m
2
kW
-1
and re=0.04 m
2
kW
-1
.
7. Results and discussions
The authors have studied the behavior of the four types of facades, both in case of natural
ventilation and in the case of forced ventilation of the air in the duct.
For the study of a typical summer situation have been considered the following reference
conditions:
-
External temperature: T
e
= T0 = 301 K;
-
Indoor temperature: T
i
= 297 K;
-
Incident solar radiation: I = 400 W/m
2
.
The modeling of the real system has been performed using the computer code "Fluent"and
the pre-processor "Gambit".
The convergence criterion requires that the maximum relative difference between two
consecutive iterations for each local variable is less than 10
-3
.
Convergence has been generally obtained with a number of iterations, which varies from
case to case, but always between 800 and 1200 iterations.
7.1 Natural ventilation
Initially has been studied the behavior of the ventilated facade system in natural ventilation,
with the motion of air in the cavity caused by thermal and pressure gradients.
Figures 5 to 12 show the velocity and temperature profiles obtained for the four facades.
Computational Fluid Dynamic Simulations of Natural Convection in Ventilated Facades
361
Fig. 5. Facade P1- Temperature profiles (L=6 m, d=0.1 m, T
e
=301 K, I=400W/m
2
)
Fig. 6. Facade P2- Temperature profiles (L=6 m, d=0.1 m, T
e
=301 K, I=400W/m
2
)
Evaporation, Condensation and Heat Transfer
362
Fig. 7. Facade P3- Temperature profiles (L=6 m, d=0.1 m, T
e
=301 K, I=400W/m
2
)
Fig. 8. Facade P4- Temperature profiles (L=6 m, d=0.1 m, T
e
=301 K, I=400W/m
2
)
Computational Fluid Dynamic Simulations of Natural Convection in Ventilated Facades
363
Fig. 9. Facade P1- Velocity profiles (L=6 m, d=0.1 m, Te=301 K, I=400W/m
2
)
Fig. 10. Facade P2- Velocity profiles (L=6 m, d=0.1 m, Te=301 K, I=400W/m
2
)
Evaporation, Condensation and Heat Transfer
364
Fig. 11. Facade P3- Velocity profiles (L=6 m, d=0.1 m, Te=301 K, I=400W/m
2
)
Fig. 12. Facade P4- Velocity profiles (L=6 m, d=0.1 m, Te=301 K, I=400W/m
2
)
Computational Fluid Dynamic Simulations of Natural Convection in Ventilated Facades
365
The temperature profiles show an increase of the air temperature inside the cavity along the
direction of the motion. It also possible to observe two temperature boundary layers
developed in correspondence of the two slabs.
The fluid temperature decreases gradually moving away from the two surfaces delimiting
the ventilated cavity and it reaches the value of undisturbed flow outside the thermal
boundary layer.
In the first section of the ventilation duct (1/6 of the total length of the facade), as is possible
to see in the profile obtained for y=1 m, the temperature increases above in the part of the
duct near the two walls, where viscous dissipation is maximum, while the air in the middle
of the channel presents a temperature very close to the entrance value
T
0
.
At a distance from the entrance sufficiently high (3/6 of the total length of the facade), the
air temperature in correspondence of the centerline increases too. From this section the
temperature profile becomes “stable”.
The temperature profiles obtained at the third section of the ventilation duct (5 / 6 of the
total length of the facade) have the same trend as those obtained for the second section, but
with higher overall temperatures.
It is interesting to observe that in the case of the ventilated facade P4, the air flow inside the
duct is heated less than the other two studied facades. In fact, for the facade P4 has been
obtained the lowest value of air temperature inside the duct.
The distributions of velocity observed in the cases of the walls P1,P2 and P4 show the
characteristic trend of internal flows in natural convection.
It is possible to observe the existence of two symmetric boundary layers developed near the
two slabs that delimit the ventilated duct . The fluid velocity is zero in correspondence of
the two walls (condition of adhesion to the wall) and increases with distance from the
surface, until it reaches a maximum value (x = 0.02m) and then decreases again moving
toward the center line (x = 0.05 m).
In the first section of the ventilation duct, as shown by the velocity profiles obtained at the
section located at y = 1 m, the air flow is not yet fully developed and it has a lower average
speed of about 1 m / s for the wall P1, of 1.2 m / s for the walls and P2 and P4 of 1.5 m / s
for the wall P3.
In the case of the wall P3, velocity profiles show a parabolic trend with a maximum speed of
1.6 m/s on the centerline (x = 0.05 m).
7.2 Forced ventilation
In the case of forced convection, the action of an mechanical propeller(one or more low
power fan) that pushes the air inside the double-ventilated, increasing the effects due to
local gradients of density characteristic of simple natural convection , has been simulated by
imposing a speed input v
0.
The other boundary conditions have been imposed coincident with those used to study the
motion of air in case of natural convection.
The following figures (from 13 to 16) show the velocity and temperature profiles obtained
for the ventilated wall P1, for two different values of inlet velocity, respectively, v
0
(1) = 1
m/s and v
0
(2) = 2 m/s.
The temperature profiles (see fig. 13 and 14) show a very flattened trend in the middle of the
channel with two points of maximum in correspondence to the two slabs. The increase of
the velocity v
0
, imposed by the fan, causes both the decrease of the temperature difference
between the two sides of the duct and the decrease of the temperature difference between
the inlet and outlet cross-sections (
T
L
-T
0
). Every way the ventilation heat flux, Q
v
=m
c
p
(T
L
-
T
0
), augment is caused by the increase of the mass air flow.
Evaporation, Condensation and Heat Transfer
366
Fig. 13. Facade P1- Temperature profiles (L=6 m, d=0.1 m, Te=301 K, I=400W/m
2
, v
0
=1 m/s)
Fig. 14. Facade P1- Temperature profiles (L=6 m, d=0.1 m, Te=301 K, I=400W/m
2
, v
0
=2 m/s)
Computational Fluid Dynamic Simulations of Natural Convection in Ventilated Facades
367
Fig. 15. Facade P1- Velocity profiles (L=6 m, d=0.1 m, Te=301 K, I=400W/m
2
, v
0
(1) =1m/s)
Fig. 16. Facade P1- Velocity profiles (L=6 m, d=0.1 m, Te=301 K, I=400W/m
2
, v
0
(1) =2m/s)
Evaporation, Condensation and Heat Transfer
368
The values of temperature inside the channel, T
m
, are less than the ones calculated for lower
inlet velocities, consequently it implies the decrease in the heat flux incoming into the
building expressed by the relation
Q
in
=R
in
(T
m
– T
i
).
Increasing the inlet velocity (see fig. 15 and 16) from 1 m/s to 2 m/s, the velocity profiles
tend to a flattened trend, the airflow feels less the effect of friction and the two boundary
layers become very thin.
The same results have been obtained for the other types of facades object of the study.
8. Energy performance of ventilated facades
In order to evaluate the benefit that derives from the use of ventilation, have been calculated
heat fluxes entering through ventilated structures, both in presence and absence of
ventilation.
Fig. 17. Heat flux incoming for unventilated(A) and ventilated (B) facade
In the case of lack of ventilation, the incoming heat flux (see fig. 17A) is :
-
as i
nv
nv
TT
Q
R
=
(25)
where
T
as
is the temperature-sun-air defined as: T
as
= T
e
+αI/h
oe
, T
e
is the outdoor air
temperature;
α is the absorption coefficient of the outer face; I is the incident solar radiation
intensity;
R
nv
is the thermal resistance of the unventilated facade defined as:
N
i
nv i e
i
i
s
Rr r
λ
=+ +
∑
(26)
where
r
i
and r
e
are respectively the thermal resistances of the inner and the external
surfaces while
s
i
and λ
i
are the thickness and the thermal conductivity of the i
th
layer (see
table 2).
In the case of ventilated facade (see fig. 17B) the heat flux coming into the room will be
given by the equation:
Computational Fluid Dynamic Simulations of Natural Convection in Ventilated Facades
369
m i
in
TT
Q
Ri
−
=
(27)
where
T
m
is the average temperature of the air into the duct and R
i
is the total thermal
resistance of the internal slab defined as:
1ii A
RrR r=+ + (28)
where
r
i
is the convective thermal resistance of the inner surface, R
A
is the conductive
resistance of the internal slab and
r
1
is the surface thermal resistance into the duct.
The average temperature
T
m
inside the duct has been obtained using the values provided by
the thermo-fluid simulations and it is expressed by the following empirical formula:
-
0
12
'(1 ) '
2
2
L
m
TT
zT z T
T
+
++
⎡⎤
⎣⎦
= (29)
where:
z=R
e
/R
tnv
is a dimensionless parameter; T
1
’, T
2
’, are the air temperatures respectively
in correspondence to the two slabs and
T
L
the air temperature in correspondence of the
outlet section of the duct obtained by the CFD simulations
The CFD simulations under natural convection have been carried out varying both the
geometry (the thickness d of the duct) and the climatic conditions (solar radiation I and the
external temperature
T
e)
. For the simulations carried out under mixed convection (natural +
forced) has been varied the inlet velocity of air
v
0
.
The results of the heat fluxes incoming in presence (
Q
in
) and in absence (Q
nv
) of ventilation
can be summarized as follows:
-
Influence of the width of the duct (d)
The increase of the width of the ventilated duct d from 5 cm to 20 cm (see fig.18)provides an
improvement of the energy performance of the structure, reducing the thermal loads
incoming.
2
3
4
5
6
7
8
9
0,05 0,1 0,15 0,2
d( m)
Q
in
(W/m
2
)
Qn v
P1
P2
P3
P4
Fig. 18. Variations of heat flux
Q incoming with the width of the duct d(L=6 m, T
e
=301 K,
I=400W/m
2
)
Evaporation, Condensation and Heat Transfer
370
The observed behavior is due to the reduction of relative roughness (b/Dh) with the resultant
increase in flow rates and ventilation heat load removed from the structure.
The wall P4 results to be the best, while the less efficient results the facade P3.
-
Influence of the solar radiation (I)
The graph in figure 19 shows the heat fluxes entering into the room without (Q
nv
) and in
presence (
Q
in
) of ventilation varying the incident solar radiation I from 100 W/m
2
up to 600
W/m
2
. It is possible to see that, despite the rise in solar radiation causes the increased heat
load incoming (
Q
in
), this quantity is always much lower than the heat flux incoming in
absence of ventilation (
Q
nv
).
2,00
3,00
4,00
5,00
6,00
7,00
8,00
9,00
10,00
11,00
12,00
100 200 300 400 500 600
I(W/m
2
)
Q
in
(W/m
2
)
Qnv
P1
P2
P3
P4
Fig. 19. Variations of heat flux Q incoming with the solar radiation I (L=6 m, d=0.1m, Te=301
K)
The increase in solar radiation I, in fact causes a greater heating of the outer wall that feeds
the chimney effect in the cavity, allowing to remove a larger amount of heat
Q
vent
from the
structure by ventilation and thereby reducing the heat flux entering the room
Q
in
. The wall
P4 results the best, while the less efficient results the facade P3.
-
Influence of the external temperature (T
e
)
The graph in figure 20 shows the behavior of air ventilated cavity at different external
temperature
T
e
that has been carried out by fixing the incident solar radiation of 400
W/m
2
and varying the value of the external air temperature T
e
, also coinciding with the
inlet temperature
T
0
, from 301 K up to 311 K. The rise in external temperature T
e
causes
an increase of the heat load incoming (
Q
in
) but this quantity is always lower than the heat
flux incoming without ventilation (
Q
nv
). This trend is due to the growth of air temperature
inside the duct with the consequent increase of heat flux entering in the room
Q
in
.
It has been possible to observe that, up to
Te=306 K, the facade P4 is the one that uses more
efficiently the ventilation, while for
T
e
>306 K the performances of the four studied facades
tend to conform.
For an external temperature
T
e
=311 K, the heat flux incoming in presence of ventilation
assumes a value of about 10 W/m
2
, however, lower than the heat load entering without the
contribution of ventilation.
Computational Fluid Dynamic Simulations of Natural Convection in Ventilated Facades
371
- Influence of the inlet velocity (v
0
)
Observing the graph in figure 21 is possible to see that the increase of the inlet velocity v
0
causes a decrease of the heat flux incoming
Q
in
due to the significant augment of the portion
of heat load removed by ventilation.
For
v
0
≥ 2,5 m/s the heat flux entering the room tends to a horizontal asymptote. This trend
is due to the fact that the temperature inside the ventilation duct can not cool down below
the outdoor temperature
T
e
.
Even in this case the wall P4 results to be the one using more effectively the ventilation,
while the P3 wall results to be the one that uses less efficiently the ventilated air gap.
2,00
4,00
6,00
8,00
10,00
12,00
14,00
16,00
301.0 303.5 306.0 308.5 311.0
Te (K)
Q
in
(W/m
2
)
Qnv
P1
P2
P3
P4
Fig. 20. Variations of heat flux
Q incoming with the external temperature T
e
(L=6 m, d=0.1
m, I=400W/m
2
)
2,00
3,00
4,00
5,00
6,00
7,00
8,00
9,00
0,5 1 1,5 2 2,5
v
0
(m/s)
Q
in
(W/m
2
)
Qnv
P1
P2
P3
P4
Fig. 21. Variations of heat flux
Q incoming with inlet velocity v
0
(L=6 m, d=0.1m, T
e
=301 K,
I=400W/m
2
)
Evaporation, Condensation and Heat Transfer
372
9. Conclusions
A steady calculation method, suitable for design applications, has been illustrated to study
the energy performances of ventilated facades during the summer period.
The thermo fluid dynamic behaviour of four different types of ventilated facade,
characterized by the same value of the total thermal resistance
R
nv,
, have been examined.
The velocity and temperature profiles have been calculated using the Fluent CFD code, for
different values of the width ,d, of the duct, incident solar radiation I, outdoor temperature Te
and inlet velocity v
o
.
It has been possible to observe significative differences in the velocity and temperature
profiles, for each kind of facade, mainly due to the thermo-physics characteristics of the
outer facing.
The analysis of the results carried out by the CFD simulations allow the following
considerations:
• the heat flux incoming Q
in
decreases if the width of the duct d increases;
• the heat flux incoming Q
in
through the facade increases for increasing values of solar radiation I
but the presence of ventilation allows the entry of a minor amount of heat compared to the case
in absence of ventilation. Therefore, for constant value of the absorption coefficient α and
the outdoor temperature
Te, the choice of the ventilated facade is recommended in site
with high values of solar radiation
I;
• the increase of the external air temperature T
e
causes the augment of the heat flux
incoming Q
in
due to the reduction of the effects of ventilation of the structures;
• the increase of the inlet velocity v
0
causes the reduction of the air temperature inside
the duct and consequently of the heat flux incoming Q
in
. For v
0
≥ 2,5 m/s the heat load
entering into the room tends to a horizontal asymptote.
The study has shown that the energy performance of a ventilated facade is influenced by the
repartition of thermal resistances between the inner and the outer slabs composing the
structure.
The Authors have defined the dimensionless parameter z, which represents the fraction of
thermal resistance facing on the external environment, expressed by the relation:
/
env
zRR=
(30)
where
R
nv
is the total thermal resistance of the wall in absence of ventilation and R
e
represents the thermal resistance between the cavity and the external environment, which
can be written as follows:
eAe
RRr
+
=
(31)
where
R
A
is the thermal resistance of the external coating and r
e
is the laminar external
resistance.
It is possible to observe the existence of a correlation between the fraction of thermal
resistance z facing on the outside and the heat fluxes incoming through the ventilated facade
Q
in
: the wall P4, which is among those analyzed the one that uses more efficiently the
ventilation, is characterized by the highest value of z while the ventilated facade P3 that is
the less efficient presents the lowest value of the same coefficient (see fig.22).
Computational Fluid Dynamic Simulations of Natural Convection in Ventilated Facades
373
Fig. 22. Comparison between the coefficient
z (%) and the heat flux incoming Q
in
(T
e
=301 K;
I=400 W/m2)
It is possible to assert that the ventilated facades, during summer period, achieve high
energy performances, with reduction of the heat flux incoming typically above 40%,
compared to the same facade unventilated. These energy performances are less
advantageous for low values of solar radiation ( i.e facades exposed to the north).
It is considered appropriate to provide the cavity of a system for monitoring the
temperature and the velocity of air in order to regulate and optimize the functioning of the
ventilated structure.
10. References
Balocco, C., Mazzocchi, F., Nistri, P.(2001). Facciata ventilata in laterizio: tecnologia e
prestazioni,
Costruire in Laterizio, n. 83, pp. 63-75 (in Italian).
Torricelli, M.C.(2000). Caldo d’inverno e fresco d’estate,
Costruire in Laterizio, 77, pp.56-67 (in
Italian).
Launder, B.E., Spalding, D.B.(1974). The Numerical Computation of Turbulent Flows,
Computer Methods in Applied Mechanics and Engineering, n.3, pp.269-289.
Miyamoto, M., Katoh, Y., Kurima, J., Saki, H.(1986). Turbulent free convection heat transfer
from vertical parallel plates,
Heat transfer, Vol. 4 , pp. 1593-1598.
Fedorov, A. G., Viskanta, R.(1997). Turbulent natural convection heat trasfer in an
asimmetrically heated vertical parallel-plate channel
, International Journal of Heat
and Mass Transfer,
Vol. 40, n. 16, pp. 3849-3860.
Patankar, S.V.(1980). Numerical heat transfer and fluid flow,
Hemisphere Publications.
Rohsenow, W.M., Hartnett, J.P., Gani, E.N. (1985) Handbook of heat transfer fundamentals,
2
nd
ed., McGraw/Hill, New York.
Patania, F., Gagliano, A., Nocera, F., Ferlito, A., Galesi, A.(2010). Thermofluid- dynamic
analysis of ventilated facades,
Energy and Buildings n.42, pp.1148-1155.
Patania, F., Gagliano, A., Nocera, F., Ferlito, A., Galesi, A.(2011). Energy Analysis of
Ventilated Roof,
Sustainability in Energy and Buildings, pp. 15-24.