Ferroelectrics Applications Part 5 potx
Bạn đang xem bản rút gọn của tài liệu. Xem và tải ngay bản đầy đủ của tài liệu tại đây (2.16 MB, 23 trang )
Ferroelectric Polymer for Bio-Sonar Replica
81
The corona discharge is a room-temperature poling technique accomplished by applying
high voltage to the PVDF film, placed between a flat electrode and an array of conductive
tips placed at a distance of a few millimeters with an interposed control grid. The poling
process is completed within several seconds and a high temperature was found to yield
greater and more stable piezoelectric and pyroelectric effects (Bloomfield et al., 1987). Poling
can also be carried out by applying electric fields, between 500 kV/cm and 800 kV/cm at
high temperatures (90 ÷ 110 °C) for about one hour; the electric fields must be applied
directly to both the metalized faces of the film. High temperatures create thermal agitation,
allowing a partial alignment of the dipoles due to the electric field. Successively, the
temperature is decreased and then the electric field switched off, resulting in a permanently
polarized state of the polymer (Hasegawa et al., 1972). One of the most utilized methods
(Bauer, 1989) is that of applying an alternating electric field through the polymer at a
frequency ranging from 0.001 Hz to 1 Hz, while gradually increasing the amplitude of the
electric field, which results an hysteresis loop of polarization. This technique allows the
achievement of a very stable, reproducible and durable polarization.
Polarization can easily be controlled by monitoring the actual current passing through the
polymer which is given by:
dE dP E
i
dt dt R
ε
⎛⎞⎛⎞⎛⎞
=++
⎜⎟⎜⎟⎜⎟
⎝⎠⎝⎠⎝⎠
(1)
3.3 Piezoelectric equations
A necessary condition to induce piezoelectricity in a medium is the absence of a center of
symmetry in its atomic structure. Starting from thermodynamic potential, in adiabatic and
isothermal conditions, general piezoelectric equations can be derived. Neglecting the effects
of the magnetic field, the most useful simplified equations are given as follows:
E
t
T
D
t
T
D
t
S
E
t
S
SsTdE
DdT E
SsTgD
EgT D
TcShD
EhS D
TcS E
DeS E
ε
β
β
ε
⎧
=+
⎪
⎨
=+
⎪
⎩
⎧
=+
⎪
⎨
=− +
⎪
⎩
⎧
=−
⎪
⎨
=− +
⎪
⎩
⎧
=−ε
⎪
⎨
=+
⎪
⎩
(2)
The first pair of equations is the most used, where electric field and stress are taken as
independent variables. The second pair of equations can be used for general purposes
except for triclinic and monoclinic crystal systems. The last two pairs are used when the
strain is prevalent in only one dimension. The four piezoelectric constants are related as
follows:
Ferroelectrics - Applications
82
TE DT
SE SD
SD E S
dg
ET T D
TD TE
eh
ES DS
∂∂ ∂ ∂
== =−=
∂∂ ∂ ∂
∂∂ ∂∂
=− = =− =
∂∂ ∂∂
(3)
Below a brief notation in matrix form of the tensor theory for PVDF is reported (Mason,
1964, 1981):
11 12 13 31
11
12 11 13 31
22
13 13 44 44
33
44 15
44
55
44 15
66
66
11
15 11
22
15 11
33
31 31 33 33
00000
00000
00000
000 000 0
.
0000 0 00
00000 000
0000 0 00
000 000 0
00000
EEE
EEE
EEE
E
E
E
T
T
T
sss d
ST
sss d
ST
sss d
ST
sd
ST
ST
sd
ST
s
DE
d
DE
d
DE
ddd
ε
ε
ε
= (4)
One of the most important properties of piezoelectric materials is their ability to convert
energy, expressed by the piezoelectric coupling factor k which is related to the mutual,
elastic, and dielectric energy density. It is a useful parameter for the evaluation of power
transduction, and is better than the sets of elastic, dielectric and piezoelectric constants.
4. PVDF applications
4.1 Acoustical and optical devices
The most common applications of PVDF are in the fields of electro-acoustic, electro-
mechanic (Sessler, 1981; Lovinger, 1982, 1983; Hunt et al., 1983), and pyroelectric
transducers (a “vidicon” imaging system was proposed by Yamaka, 1977). In the field of
electroacoustic transducers, the ferroelectric polymer was largely used as an ultrasonic
transducer in the MHz frequency range for application in the medical field, and in the audio
frequency range. In the first case, its functioning principle is based on the thickness mode of
vibration along the z direction (see Figure 5), in which one or both of the wide faces are
clamped to a rigid bulk, while in the second case, at much lower frequencies, the transverse
piezoelectric effect along the x direction is predominant.
Thanks to its piezoelectric characteristics (compared in Table 1 with other piezoelectric
materials such as low Q - quality factor - together with low acoustic impedance, lightness,
conformability, and very low cost), it is also a competitive material in the fabrication of
ultrasonic transducers. It resonates in the thickness mode at very high frequencies, for use in
non-destructive testing in clinical medicine (Ohigashi et al., 1984).
Ferroelectric Polymer for Bio-Sonar Replica
83
Property Unit PZT4 PZT5A PZT5H PbNb
2
O
6
PVDF P(VDF-TrFE)
Sound velocity
m/s 4600 4350 4560 3200 2260 2400
Density
10
3
kg/m
3
7.5 7.75 7.5 6.2 1.78 1.88
Acoustic
impedance
10
6
Rayl 34.5 33.7 34.2 20 4.2 4.51
Elastic constant
10
9
N/m 159 159 147 - 9.1 11.3
Electromechanical
Coupling Factor
k
31
0.51 0.49 0.50 0.32 0.2 0.3
Piezoelectric
constant
e
33
C/m
2
15.1 15.8 23.8 - -0.16 -0.23
h
33
10
9
V/m 2.68 2.15 1.84 - -2.9 -4.3
d
33
pC/N 289 375 593 85 17.5 18
d
31
pC/N -123 - - - 25 12.5
g
33
V⋅m/N
0.0251 0.0249 0.0197 0.032 -0.32 -0.38
ε
r
=ε
33
/ε
0
635 830 1470 300 6.2 6
Table 1. Comparison of main piezomaterial properties
Another high frequency application is in combination with integrated electronic circuits in
the fabrication of a 32-element array configuration for ultrasonic imaging (Swartz and
Plummer, 1979).
The performance of transducers realized on silicon was improved by spinning a 15 µm-thin
layer of a solution of P(VDF-TrFe) (a copolymer of the polyvinylidene fluoride) in MEK
(Methyl Ethyl Ketone), onto a processed silicon wafer in which a low noise NMOS transistor
with an extended gate was integrated (Fiorillo et al., 1987).
4.2 Low frequency ultrasound devices
At much lower frequencies, an electric potential applied to both of the wide faces of a free
PVDF sheet, generates length-extensional vibrations along x that can be converted into a
radial vibration by curvature. This second principle of functioning was exploited in two
different ways; the PVDF film is stretched out on a polyurethane support with a small
curvature, or alternatively a hemicylindrical shape is imposed to the free sheet by clamping
the narrowest sides along direction y at a distance of πr.
The piezoelectric equilibrium of a thin sheet of PVDF, polarized along the z or 3 direction
and stretched along the x or 1 direction, is governed by the following equations:
1111313
3311333
E
T
SsTdE
DdT E
ε
=+
=+
(5)
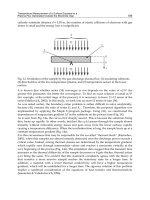
By applying an alternating voltage between the two electrodes, the hemicylindrical
geometry and its lateral constraint allows the conversion of longitudinal motion into radial
vibration (see Figure 6). Ultrasonic waves are generated in forward and backward
directions. The resonance frequency is inversely proportional to the bending radius and can
Ferroelectrics - Applications
84
be easily controlled by varying it. Neglecting the clamping effects, the resonance frequency
is given by:
11
11
2
E
f
r
s
π
ρ
= (6)
where r is the radius of the curvature and
11
1/
E
s and
ρ
are Young’s modulus and mass
density of curved PVDF film material, respectively (Fiorillo, 1992). Similar results were
verified by finite element analysis (Toda, 2000). However in the curved geometry proposed
by Toda and adopted by Hazas & Hopper (2006), clamping generates secondary acoustic
fields which result in energy loss and directivity reduction.
Fig. 6. A piezo-polymer film transducer obtained by curving a PVDF resonator in the length
extensional mode along the 1 or stretching direction.
4.3 PVDF transducer modeling
Because of the ferroelectric polymer’s inherent noise, a correct modeling of the transducer’s
electric impedance plays an important role in designing the electronic circuits. In order to
design a specific electronic circuit capable of driving the PVDF transducer with high voltage
over a wide band centered around the resonance, and of amplifying the echo with a high
SNR (signal-to-noise-ratio), a Butterworth- VanDyke modified model has been implemented
in the receiver. Both the modulus and the phase of the electric admittance of the transducer
have been measured by using an impedance gain-phase analyzer.
Although the piezopolymer transducer suffers from high dielectric losses, the resonance
frequency can be determined with good approximation from the phase diagram of the
electric admittance. On the other hand, the almost flat diagram of the modulus around the
resonance leads to more coarse results that, especially at low US frequency, need further
manipulation in order to give reliable information. For instance, at the resonance frequency
42.7
r
fkHz= , the Butterworth-Van Dike modified model of the electric impedance of the
transducer can be characterized by the following parameters:
Ω= kR
s
330
,
HL
s
10=
,
pFC
s
4.1=
,
Ω= kR 210
0
,
pFC 5.248
0
=
, where ,
0
R
has been introduced in the static
branch to take into account dielectric losses as shown in Figure 7.
Ferroelectric Polymer for Bio-Sonar Replica
85
Fig. 7. Impedance equivalent model of the piezo-polymer transducer which also takes into
account dielectric losses in which R
0
(ω) and C
0
(ω) are frequency-dependent parameters.
Piezoelectric devices are characterized by the figure of merit
QkM
2
=
, where k is the
electromechanical coupling and Q is the quality factor. In order to radiate or receive
acoustical waves, piezoelectric transducers are required to have smaller M characterized by
high k but low Q. Because of their inherent properties, piezo-ceramic and standard piezo-
crystal sound transducers normally have high electromechanical couplings and high quality
factors. We have modified the structure in order to increase the bandwidth and to further
reduce the quality factor Q, while the resonance frequency can be continuously changed by
modifying the film bending radius. As a result we obtained a controlled resonance
transducer with a very low synthetic quality factor for choosing the right axial resolution
and improving the pulse echo mode functioning over the full range frequency of bat
biosonar (Fiorillo, 1996).
4.4 PVDF transducer with controlled resonance
In this second assembly, the transducer is realized by curving the sheet, according to
parabolic shape, where the two extremities A and B, are tangentially blocked along two
lines, t and t’, that originate in point O (see Figure 8). The bending of the film is
mechanically controlled by changing the opening arc angle φ between t and t’. The
equation of the parabolic transverse section,
2
y
ax c=− + , can be rewritten by considering
two new parameters: the slope of t(t’),
()
tan / 2m
πϕ
= ⎡ − ⎤
⎣
⎦
(m’=-m) , and d(d’), the fixed
distance from the origin O to A (and B, respectively). Then, the arc length l has been
evaluated as a function of d(d’) and m(m’). Finally the ratio l/d (l/d’) at various m(m’)
values, has been considered. Because of the imposed geometry and in order to assume a
parabolic transverse section at any angular position φ, the ratio l/d (l/d’) must be a
constant quantity. Hence the film motion, converted from extensional to radial by
geometry, can be studied by considering a parabolic shape in the range 27° < φ < 40° with
an error less than 5%. When φ=50° the error increases up to 10%. By increasing the length l
of the film in comparison with d(d’), it is possible to further increase the opening arc angle
and, consequently, to reduce the resonance frequency. The transducer shape is now quite
different from the parabolic one. However the maximum angle φ cannot exceed 70°,
without the transducer being damaged.
Ferroelectrics - Applications
86
Fig. 8. Three dimensional view of transducer assembling in variable resonance frequency
configurations clamped along A and B
φ [deg]
27 30 35 40 45 50 55 60 65 67
f
r
[kHz]
65.1 61.3 54.6 50.5 47.3 42.7 38.0 35.8 34.3 30.0
Table 2. Resonance frequency vs opening arc angle
Experimental results show that the resonance frequency is inversely proportional to the
opening arc angle φ between t and t’. It decreases from 65 kHz, when φ=27°, to 45 kHz when
φ=50°. For φ>50° the film shape is quite different from a parabolic cylinder, however the
resonance frequency decreases to 30 kHz by increasing the opening arc angle to φ=67°.
These results are in good agreement with previous results obtained using hemicylindrical
transducers with circular transverse sections, different bending radii and different lengths.
By considering the upper -3dB frequency f
H
≈71.4 kHz and the lower -3dB frequency f
H
≈27
kHz (for each angular position it is Q≈5), when φ ranges, respectively, from 27° to 67° (see
Table 2), a broad-band transducer B=f
H
-f
L
=44.5 kHz with central frequency of 49.25 kHz and
very low synthetic quality factor Q≈1 is obtained.
The immediate advantage of this kind of transducer is the possibility of changing the axial
resolution, which can be increased up to λ/50 (c/f, c=344 ms
-1
, T=24 °C, relative humidity
=77%) with digital phase measurement techniques of the transit time of the echo signal, and
ranges between 250 µm, at f
L
≈27 kHz , and 96 µm, at f
H
≈71.5 kHz, for an accurate profile
reconstruction up to a distance of 0.5 m. A closer dependence of the resonance frequency
from both the bending radius and the opening arc angle, at different arc lengths, as well as a
complete electromechanical model of the transducer, has been studied. This model takes
into account the high dielectric losses of the piezo-polymer foil, even far from resonance.
Because the polymer’s inherent noise also is related to its high dielectric losses, which are
frequency dependent, as well as C
0
(ω) and R
0
(ω) (see Figure 7), we modified the parallel
connection between C
0
and R
0
to have constant lumped parameters in the static branch over
a broad frequency range.
Ferroelectric Polymer for Bio-Sonar Replica
87
Fig. 9. RLC equivalent electric circuit of the transducer in which the R C series branch makes
the parameters independent of frequency variation in the range 1 kHz-150 kHz.
The static side of the equivalent electric circuit was modified by inserting a second branch
that includes a resistor (R
01
) connected in series to a capacitor (C
01
) as shown in Figure 9.
The values of C
0
, R
0
, C
01
, R
01
are approximately constant between 1÷150 kHz. The electric
behavior of the two static networks was equivalent in the frequency range of interest. In
addition the modified equivalent admittance better approximates the measured values
(Fiorillo, 2000). Once we determined the equivalent electrical circuit with constant electric
parameters, of the lossy transducer in a relatively broad frequency range, we investigated
the pre-amplifier noise sources and the noise generated in the receiver, Rx, to optimize
SNR. For this reason we took into account the transducer equivalent electric network with
related Johnson noise sources. We did not consider noise sources in the transmitter, Tx,
because the driving voltage can be arbitrarily increased within the limits of dielectric
breakdown.
5. Echo-location techniques of bat
There are 966 species of bats that use different ultrasonic waveforms to move between
obstacles and to locate the target. The most simple bio-pulses are very simple clicks of
around 40 kHz. Some species emit constant frequency signals, CF, a sinusoidal burst of
many cycles, or frequency modulated signals, FM. Another more sophisticated form of the
US signal is a combination of a CF pulse immediately followed by a downward chirp, an
FM pulse. This kind of CF-FM, can be a pure tone or a multi-harmonic signal. Its energy
may be selectively controlled depending on the distance and the size of the target.
5.1 Echo-location of Pteronotus Parnellii
The most complex CF-FM pulse is that emitted by the Pteronotus Parnellii, or moustached
bat, which is composed of four harmonics: the fundamental CF
1
-FM
1
, at 30.5 kHz, followed
by the downward chirp in which the frequency is reduced to 20 kHz, and three higher
harmonics, followed by relative chirps, CF
2
-FM
2
at 61 kHz, CF
3
-FM
3
, at 92 kHz, and CF
4
-FM
4
at 123 kHz respectively down to about 50, 80, and 110 kHz (see Figure 10a). The mustached
bat is able to extract plenty of information from the echo signal as shown in Figure 10b.
Ferroelectrics - Applications
88
a) b)
Fig. 10. The four pulse components of the bio-signal generated by the mustached bat. In
diagram a) the solid line represents the superimposed CF-FM component, while the dashed
line depicts the received echo . Table b) shows information received by the bat related to the
characteristics of the echo signal analysis.
Distance is evaluated using the echo delay, throughout the time-of-flight (TOF) as related to
the frequency modulated components FM
2
, FM
3
, FM
4
. The FM signals are used to cover the
whole range of the bio-sonar. In particular the components FM
2
, FM
3
, FM
4
operate at the
maximum, medium and minimum distance, while the first component, FM
1
, is used to start
the TOF measurement and is sent to the auditory system, internally, through the larynx. A
neural network model based on FM-FM neurons and proposed by Suga (1990) is shown in
Figure 11. The neural network is mainly divided into two parts:
•
An afferent pathway appointed to the transmission of the PFM
1
pulse
•
An afferent pathway appointed to the reception of EFM
n
(n=2, 3 or 4) echoes
Fig. 11. Scheme of a portion of the neural network for ranging analysis
Ferroelectric Polymer for Bio-Sonar Replica
89
The neural network compares the first component PFM
1
with each one of the other three
EFM
2
, EFM
3
and EFM
4
, in three different neural structures: one for PFM
1
-EFM
2
, one for
PFM
1
-EFM
3
and one for the PFM
1
-EFM
4
components. The FM
n
(n=2,3 or 4) components of
the echo are elaborated by the neural network in order to obtain a sequence of bio-pulses,
each one related to a particular delay time. The neurons are located over the delay time axis
and are tuned to a particular delay time from 0.4 ms to 18 ms. They receive the echo
naturally delayed by the target from the upper network (neurons EFM
n
, A, B). This echo
reaches all the neurons of the time axis. Similarly the start pulse (PFM
1
) reaches each neuron
of the time axis from the lower network (neuron PFM
1
, C, D) with increasing delay
accomplished either with variation in length and axon diameter or by different time
inhibition values. In this neural structure only one neuron is excited, by both EFM
n
and
PFM
1
, when the echo and the pulse are combined with a particular delay, and generates an
action potential at the time-of-flight as related to target distance.
5.2 The PVDF sonar system and the afferent electronic pathway
The PVDF transducer can be used as a transmitter (converse piezoelectric effect) or a
receiver (direct piezoelectric effect) of ultrasonic signals. The circuit for driving the
transmitter with CF – FM signals, is realized using a power operational amplifier, followed
by a step-up transformer, that generates a wide range of signals from a few volts up to a few
hundred volts in both CF and FM mode. The receiver converts ultrasonic energy into electric
energy and the signal is firstly pre-amplified with a very low-noise, low-distortion
operational amplifier, designed for low frequency ultrasound applications (Fiorillo et al.,
2010). It is then filtered and conditioned to be suitable for neural network processing as
shown in Figure 12.
Fig. 12. Block diagram of the transmitter and receiver circuit a). 65 kHz burst signal (upper)
reflected by a plane (lower) located at 150 mm from the sonar b).
The first step is to create a sequence of suitable pulses, each related to a particular frequency
of the FM signal, in order to evaluate the TOF. For simplicity, the FM
2
echo component and
the related neural network will be considered. The FM
2
signal is a down-chirp from 65 kHz
to 49 kHz with a duration of about 6 ms, from which a sequence of suitable pulses is created
to activate the artificial neural network.
Ferroelectrics - Applications
90
In the electronic system the pulse sequence related to the spectral components is obtained by
filtering and then rectifying the FM
n
(n=2…4) signals. Finally the signal is again filtered at
low frequency to extract the envelope shown in Figure 13.
Fig. 13. Schematic simulation of cochlea signal conditioning
These pulse signals are sent in parallel to the neural network which compares the first
component PFM
1
with each one of the other three EFM
2
, EFM
3
, EFM
4
in three different
neural structures: PFM
1
-EFM
2
, PFM
1
-EFM
3
and PFM
1
-EFM
4
.
Similarly PFM
1
is converted in a sequence of pulses according to a time-frequency
correspondence. In fact, when both PFM and EFM signals reach the neural network as a
pulse sequence, frequency losses sense since it is related to the particular delayed pulse.
According to the Suga model, neurons A and C respond to the stimulus with action
potentials, while in our electronic system voltage pulses are sent, from neurons A and C
through neurons B and D, in the afferent ways, to the time axis.
In Figure 14 one can see the neural network learned and simulated in Matlab in which only
three neurons A (C) and four FM-FM neurons along the time axis are considered, for
simplicity’s sake. The A neurons, which receive the output signal from the block diagram
shown in Figure 13, are implemented by using a multilayer perceptron structure trained
with a back propagation algorithm. It reduces the envelope duration around its peak value
(see Figure 15) in order to improve the cross-correlation analysis performed by the FM-FM
neurons.
The neural model offers a possible description in terms of cross-correlation analysis
according to signal codification and time of flight detection as in bat biosonar for ranging
evaluation.
Ferroelectric Polymer for Bio-Sonar Replica
91
Fig. 14. Portion of a three-level neural network in which each neuron A (or C) receives the
corresponding envelope that is sent through neurons B (or D) to FM-FM neurons
Fig. 15. a) Sequence of 16 pulses, related to a 16 echo envelope, at the output of A neurons.
b) Neuron multilayer perceptron implemented in Matlab environment
Ferroelectrics - Applications
92
6. Conclusion and future development
It is our opinion that ferroelectric polymer-based sensors for low frequency ultrasound in air
represent the best compromise between versatility and performance.
In effect, the curved PVDF ultrasonic transducer is the only one capable of resonating over a
wide frequency range. In fact, the functioning of the majority of standard or custom
transducers, based on different technologies, is limited to narrow frequency bands which
reduce their use to a restricted field of application. For this reason most research is
concerned with signal processing rather than transducer technology. The efficiency of
ultrasonic transducers is clearly improved by the ferroelectric polymer technologies. PVDF
transducers can adapt work modalities to tasks almost in medium range application in air
according to strategies observed in the flight of bats.
Our work shows the possibility of using PVDF transducers to replicate the behaviour of bat
bio-sonar despite the fact that only ranging was considered. Future developments must be
concerned with the implementation of suitable neural networks for the explication of
different tasks as relative to velocity, target size and finer characteristics. All of these
problems could be approached in terms both of technology and of neural networking.
7. References
Altringham, J. (1986). Bats: biology and behavior. Oxford University Press, New York
Bauer, F. (1986). Method and device for polarizing ferroelectric materials, U.S. Patent
4,611,260, USA
Bergman, J.G., McFee, J.H., Crane, G.R. (1971). Pyroelectricity and optical second harmonic
generation in polyvinylidene fluoride films, Applied Physics Letter, Vol. 18, No. 5,
pp. 203-205, 0003-6951
Berlincourt, D. (1981). Piezoelectric ceramics: characteristics and applications, Journal of the
Acoustical Society of America, Vol. 70, No. 6, pp. 1586-1595, 0001-4966
Bloomfield, P.E., Marcus, M.A. (1988). Production of ferroelectric polymer films, In
Applications of Ferroelectric Polymers, Wang, T.T., Herbert, J.M., Glass, A.M., Blackie
& Son Ltd, Chapman and Hall, New York
Brown, L.F., Carlson, D.L. (1989). Ultrasound transducer models for piezoelectric polymer
films, IEEE Transaction on Ultrasonics, Ferroelectrics and Frequency Control, Vol. 36,
No. 3, pp. 313–318, 0885-3010
Davis, G.T. (1988). Structure, morphology, and models of polymer ferroelectrics, In
Applications of Ferroelectric Polymers, Wang, T.T., Herbert, J.M., Glass, A.M. Blackie
& Son Ltd, Chapman and Hall, New York
De Condillac, E.B. (1754). Condillac's treatise on the sensations, Geraldine Carr (trans.), Favil
Press, London
Hasegawa, R., Takahashi, Y., Chatani, Y., Tadokoro, H. (1972). Crystal structure of
three crystalline forms of poly(vinylidene fluoride), Polymer Journal, Vol. 3, pp. 600-
610
Hasegawa, R., Kobayaschi, M., Tadokoro, H. (1972). Molecular conformation and packing of
poly(vinylidene fluoride). Stability of three crystalline forms and the effect of high
pressure, Polymer Journal, vol. 3, No.5, pp. 591-599
Ferroelectric Polymer for Bio-Sonar Replica
93
Hunt, J.W., Arditi, M., Foster, F.S. (1983). Ultrasound transducers for pulse echo medical
imaging, IEEE Transaction on Biomedical Engineering, Vol. BME-30, No. 8, pp. 453-
481, 0018-9294
Jona, F, Shirane, G. (1962). Ferroelectric crystals, Pergamon Press, New York
Fiorillo, A.S. (2000). Noise analysis in air-coupled PVDF ultrasonic sensors, IEEE Transaction
on Ultrasonics, Ferroelectrics and Frequency Control, Vol. 47, No.6, pp. 1432-1437, 0085-
3010
Fiorillo, A.S. (1996). Ultrasound transducer with low synthetic quality factor, Applied Physic
Letters, Vol. 68, No. 2, pp. 164-166, 0003-6951
Fiorillo, A.S., Design and characterization of a PVDF ultrasonic range sensor, IEEE
Transaction on Ultrasonics Ferroelectrics and Frequency Control, Vol. 39, No. 6, pp 688-
692, 0085-3010
Fiorillo, A.S., Van der Spiegel, J., Esmail-Zandi, D., Bloomfield, P.E. (1990). A P(VDF/ TrFE)
based integrated ultrasonic transducer, Sensors and Actuators A: Physical, Vol. 22,
No.1-3, pp. 719-725, 0924-4247
Fiorillo, A.S., Lamonaca, F., Pullano, S.A. (2010). PVDF based sonar for a remote web system
to control mobile robots, Sensors & Transducers Journal, Vol. 8, Special Issue, pp. 65-
73, 1726-5479
Hazas, M., Hopper, H. (2006). Broadband ultrasonic location systems for improve indoor
positioning, IEEE transaction on Mobile Computing, Vol. 5, No. 5, pp. 536-547, 1536-
1233
Lewin, P.A., De Reggi, A.S. (1988). Short range applications, In Applications of Ferroelectric
Polymers, Wang, T.T., Herbert, J.M., Glass, A.M. Blackie & Son Ltd, Chapman and
Hall, New York
Lovinger, A.J. (1983). Ferroelectric polymers, Science, Vol. 220, No. 4602, pp. 1115-1121
Lovinger, A.J. (1982). Developments in crystalline polymers, Applied Science, Vol. 1,
No.5
Mason, W.P. (1981). Piezoelectricity, its history and applications, Journal of the Acoustical
Society of America, Vol. 70, No. 6, pp. 1561-1566
Mason, W.P. (1964). Piezoelectric crystals and their applications to ultrasonic, Van Nostrand
Company, Inc. 4th ed., New York
Sessler, G.M. (1981). Piezoelectricity in polyvinylidenefluoride, Journal of the Acoustical
Society of America, Vol. 70, No. 6, pp. 1596–1608
Swartz, R.G., Plummer, J.D., Integrated silicon-PVF2 acoustic transducer arrays, IEEE
Transaction on Electron Devices, Vol. 26, No. 12, pp 1921-1931, 0018-9383
Suga, N. (1990). Cortical computational maps for auditory imaging, Neural Networks, Vol.3,
No. 1, pp.3-21, 0893-6080
Toda, M., Tosima, S. (1999). Theory of curved clamped PVDF acoustic transducers,
Proceeding of IEEE Ultrasonic Symposium, 1051-0117, Caesars Tahoe, October
Wang, H., Toda, M. (1999). Curved PVDF airborne transducer, IEEE Transaction on
Ultrasonics Ferroelectrics and Frequency Control, Vol. 46, No. 6, pp. 1375–1386, 0885-
3010
Ferroelectrics - Applications
94
Yamaka, E., Teranishi, A. (1977). Pyroelectric Vidicon Tube with PVF, Film and Its
Application, Proceeding of the 1st Meeting on Ferroelectric Materials and Their
Applications, Kyoto, November
0
Ferroelectric Materials for Small-Scale Energy
Harvesting Devices and Green Energy Products
Mickaël Lallart and Daniel Guyomar
LGEF, INSA-Lyon
France
1. Introduction
Portable electronic devices and autonomous systems experienced a strong development over
the last few years, thanks to progresses in microelectronics and ultralow-power circuits, as
well as because of an increasing demand in autonomous and “left-behind” sensors from
various industrial fields (for instance aeronautic, civil engineering, biomedical engineering,
home automation). Until now, such devices have been powered using primary batteries.
However, such a solution is often inadequate as batteries raise maintenance issues because
of their limited lifespan (typically one year under normal conditions - Roundy, Wright and
Rabaey (2003)) and complex recycling process (leading to environmental problems). In order
to tackle these drawbacks, many efforts have been placed over the last decade on systems able
to harvest electrical energy from their close environment (Krikke, 2005; Paradiso and Starner,
2005). Many sources are available for power scavenging, such as solar, magnetic, mechanical
(vibrations) or thermal (Hudak and Amatucci, 2008). In order to power up small-scale devices,
a particular attention has been placed on the last two sources (Anton and Sodano, 2007; Beeby,
Tudor and White, 2006; Jia and Liu, 2009; Vullers et al., 2009), as they are commonly available
in many environments and because the conversion materials can be easily integrated within
the host structure.
The purpose of this chapter is to give a comprehensive view and analysis of small-scale energy
harvesting systems using ferroelectric materials, with a special focus on piezoelectric and
pyroelectric devices for vibration and thermal energy scavenging systems, respectively. As
the energy that can be provided from microgenerators is still limited to the range of tens
of microwatts to a few milliwatts, a careful attention has to be placed on the design of the
harvester. In particular, backward couplings that may occur between each conversion and
energy transfer stages require a global optimization rather than an individual design of each
block.
The chapter is organized as follows. Section 2 aims at presenting energy sources and
conversion materials that will be considered in this study, as well as basic models for
the considered conversion devices. Then section 3 will give a general view of a typical
microgenerator, emphasizing the energy conversion chain and issues for optimizing the
energy flow. Sections 4 and 5 will focus on two important energy conversion stages (energy
conversion and extraction), highlighting general optimization possibilities to get an efficient
energy harvester. Implementation issues for realistic applications will then be discussed in
5
2 Feroelectrics Vol. IV: Applications
Section 6. Section 7 will present some application examples to self-powered systems. Section 8
will finally briefly conclude the chapter.
2. Energy sources and modeling
Two conversion effects of ferroelectric materials will be considered through this chapter:
piezoelectricity, which consists of converting input mechanical energy into electricity, and
pyroelectricity, allowing harvesting energy from temperature variations. Therefore, two
energy sources will be considered in this study: mechanical energy and thermal energy. The
constitutive equations for piezoelectric materials are given by:
dT
= c
E
dS − e
t
dE
dD
=
S
dE + edS
, (1)
where D, E, S and T respectively refer to electric displacement, electric field, strain and stress
tensors. c
E
, e and
S
stand for elastic rigidity of the material, piezoelectric coefficient and
electric permittivity under constant strain. Finally, d and
t
represent the differentiation and
transpose operators respectively. In the case of pyroelectric devices, the equations yield:
dσ
= pdE + c
dθ
θ
0
dD =
θ
dE + pdθ
, (2)
with θ and θ
0
the temperature and mean temperature, σ the entropy of the system, p the
pyroelectric coefficient, c the heat capacitance and
θ
the electric permittivity under constant
temperature.
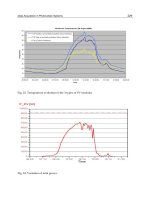
This allows the derivation of energy densities that may be typically obtained. Table 1 gives
the comparison of the electrostatic energy density of the two devices for a typical solicitation.
It can be seen that the two materials feature relatively close energy density values. This
can be explained by the fact that, although piezoelectric coupling is generally much higher
than pyroelectric coupling, the input mechanical energy is usually much less than the energy
generated by temperature variation. Therefore, the global energy, given by the product
of input energy by conversion abilities, is similar for the two materials. Nevertheless, as
mechanical frequencies are typically much higher than thermal frequencies, the output power
of piezoelectric-based microgenerators is greater than devices using pyroelectric materials
(Guyomar et al., 2009; Lallart, 2010a).
Moreover, because of their higher coupling coefficients, extracting energy from piezoelectric
elements can affect the mechanical behavior of the system, while the coupling of pyroelectric
devices is small enough to neglect the backward coupling (i.e., only the second equation of
Eq. (2) can be taken into account).
The model of a global structure can also be obtained from the local constitutive equations
Eqs. (1) and (2). In the case of a piezoelectric element (possibly bonded on a structure under
Piezoelectric Pyroelectric
Material NAVY-III type ceramic PVDF film
Conversion coefficient e
33
= 12.79 C.m
−2
p = −24e − 6 C.m
−2
.K
−1
Relative permittivity
S
33
/
0
= 668
θ
33
/
0
= 12
Typical input variation ΔS
= 10 μm.m
−1
Δθ = 1K
Electrostatic energy density
(
W
el
)
piezo
= 1.4 μJ.cm
−3
(
W
el
)
pyro
= 2.7 μJ.cm
−3
Table 1. Energy densities for typical piezoelectric and pyroelectric materials
96
Ferroelectrics - Applications
Ferroelectric Materials for Small-Scale Energy Harvesting Devices and Green Energy Products 3
flexural solicitation), it can be shown that the system may be modeled around one of its
resonance frequencies by an electromechanically coupled spring-mass-damper system (Badel
et al., 2007; Erturk and Inman, 2008):
M
¨
u
+ C
˙
u + K
E
= F − αV
I
= α
u
˙
u
− C
0
˙
V
, (3)
where u, F, V and I refer to the displacement (at a particular position of the structure), applied
force, piezovoltage and current flowing out of the active material. M, C and K
E
denote the
dynamic mass, structural damping coefficient and short-circuit stiffness of the system, while
α
u
and C
0
are given as the force factor and clamped capacitance of the piezoelectric insert.
In the case of pyroelectric energy harvesting, it has previously been stated that the low
coupling coefficient permits neglecting the backward coupling. Hence, only the electrical
equation is necessary, leading to the macroscopic equation (Guyomar et al., 2009; Lallart,
2010a):
I
= α
θ
˙
θ
− C
0
˙
V, (4)
with α
θ
the pyroelectric factor.
3. Overview of a microgenerator
The principles of an energy harvester lie in several energy conversion and transfer stages to
convert the input energy into electrical energy supplied to a load. Basically, four intermediate
stages appear between the energy source and the device to power up (Figure 1):
1. Conversion of the raw input energy into effective energy that can be transferred to the
active material.
2. Conversion of the energy available in the material into electrical energy.
3. Extraction of the electrical energy available on the material.
4. Storage of the extracted energy.
Fig. 1. General energy harvesting chain
97
Ferroelectric Materials for Small-Scale Energy Harvesting Devices and Green Energy Products
4 Feroelectrics Vol. IV: Applications
However, the energy transfer is not unidirectional. There exist backward couplings that alter
the behavior of the previous stage (Figure 1). Therefore, because of these backward couplings,
the design of an efficient energy harvester should take the whole system into account. In
particular, three main issues have to be considered to dispose of an effective microgenerator:
• Maximization of the energy that enters into the host structure.
• Enhancement of the conversion abilities of the material.
• Optimization of the energy transfer.
3.1 Piezoelectric system
When considering vibration energy harvesting using the piezoelectric effect, two cases can be
considered. Either the piezoelectric element is directly bonded on the structure (Figure 2(a)),
yielding an open-circuit piezovoltage that is a direct image of the strain and stress within
the host structure, or an additional mechanical system is used (Figure 2(b)), allowing an
easier maintenance but requiring a fine tuning of the resonance frequency so that it matches
one of the mode of the host structure
1
. In all the cases however, the system is operating
under dynamic mode in order to dispose of a significant amount of mechanical energy
(Keawboonchuay and Engel, 2003).
In the case of direct coupling the energy provided by the input force is first converted
into mechanical energy through the host structure, and then to electrostatic energy by
the piezoelectric element, while when using indirect coupling an additional mechanical to
mechanical energy conversion stage appears (a part of the energy in the host structure is
transferred to the additional mechanical system).
The previous design criteria when using piezo-based microgenerators therefore consist of:
• Properly positioning the piezoelement near maximum strain/stress locations (for direct
coupling) or maximum acceleration areas (for indirect coupling) and adapting the
additional structure to the host structure in the case of seismic coupling.
• Using piezoelectric elements featuring high coupling coefficients and/or using artificial
enhancement of the global coupling factor.
• Adapting the load seen by the piezoelectric element.
Obviously, the interdependence of the conversion stages necessitates a global approach rather
than an individual optimization. A typical example is the damping effect generated by
the harvesting process (Lesieutre, Ottman and Hofmann, 2003): as a significant part of the
mechanical energy is converted into electricity, the former decreases, limiting the vibrations
of the structure and thus the output electrical power.
(a) Direct coupling (b) Indirect (seismic) coupling
Fig. 2. Typical configurations for vibration energy harvesting using piezoelectric elements
1
In the case of seismic coupling multimodal energy harvesting is therefore delicate.
98
Ferroelectrics - Applications
Ferroelectric Materials for Small-Scale Energy Harvesting Devices and Green Energy Products 5
Generally, the structure optimization consists of allowing a large amount of energy to enter
in the piezoelectric element (which can be obtained by using a proper geometry - Zhu, Tudor
and Beeby (2010)) and ensuring a wide frequency range operation, hence allowing energy
entering whatever the force frequency is. This can be achieved by using variable resonance
frequency (Challa et al., 2008; Lallart, Anton and Inman, 2010b) or using nonlinear structures
(Andò et al., 2010; Blystad and Halvorsen, 2010a; Erturk, Hoffmann and Inman, 2009; Soliman
et al., 2008). Another commonly adopted solution is to use several cantilevers with different
lengths (Shahruz, 2006), which however decreases the power density. The optimization of the
last two items will be exposed in Sections 4 and 5.
3.2 Pyroelectric system
The case of pyroelectric energy harvesting consists of extracting energy of time-variable heat
trough the thermal capacitance of the active material (Figure 3). The optimization of the input
energy lies in the trade-off in the heat capacitance value, as energy should enter easily (low
heat capacitance value and high thermal conductivity) and amount of available energy (high
heat capacitance value).
For the conversion stage, the design is easier than in the case of piezoelectric elements, as
the backward coupling can be neglected in almost all pyroelectric systems. In addition,
as pyroelectric effect principles are close to those of the piezoelectric effect, the conversion
enhancement and transfer optimization are similar to the case of piezo-based devices, as it
will be explained in Sections 4 and 5.
4. Conversion improvement
The purpose of this section is to expose possibilities for improving the energy conversion.
To introduce this concept, it is proposed to consider a piezoelectric-based system. From the
equation of motion of the simple spring-mass-damper model (Eq. (3)), the energy analysis
over a time period
[t
0
; t
0
+ T] is obtained by integrating in the time-domain the product of the
equation by the velocity:
1
2
M
˙
u
2
t
0
+T
t
0
+
1
2
K
E
u
2
t
0
+T
t
0
+ C
t
0
+T
t
0
(
˙
u
)
2
dt + α
u
t
0
+T
t
0
V
˙
udt =
t
0
+T
t
0
F
˙
udt, (5)
where all the corresponding energies are given in Table 2. Therefore it can be seen that the
converted energy depends on the force factor α
u
and on the time integral of the product of the
voltage by the speed:
W
conv
|
piezo
= α
u
t
0
+T
t
0
V
˙
udt. (6)
Fig. 3. Typical configuration for thermal energy harvesting using pyroelectric elements
99
Ferroelectric Materials for Small-Scale Energy Harvesting Devices and Green Energy Products
6 Feroelectrics Vol. IV: Applications
Term Meaning
1
2
M
˙
u
2
t
0
+T
t
0
Kinetic energy
1
2
K
E
u
2
t
0
+T
t
0
Potential energy
C
t
0
+T
t
0
(
˙
u
)
2
dt Dissipated energy
α
u
t
0
+T
t
0
V
˙
udt Converted energy
t
0
+T
t
0
F
˙
udt Provided energy
Table 2. Definition of the energies in the case of piezoelectric energy harvesting
Such an analysis can obviously be applied to pyroelectric conversion, yielding the amount of
converted energy:
W
conv
|
pyro
= α
θ
t
0
+T
t
0
V
˙
θdt (7)
Hence, in order to enhance the conversion abilities of the system, three ways can be explored:
• Increase α
u
(for vibration energy harvesting) or α
θ
(for thermal energy harvesting).
• Increase the voltage.
• Decrease the time shift between voltage and speed (or temperature variation rate).
Usually, the first point corresponds to the use of piezoelectric materials with higher intrinsic
coupling coefficient (Rakbamrung et al., 2010). This has been done recently through the use of
single crystal devices (Khodayari et al., 2009; Park and Hackenberger, 2002; Sun et al., 2009),
which typically allows increasing the harvested power by a factor of 20 (Badel et al., 2006).
However, single crystals are difficult to obtain, and no industrial process has been achieved,
compromising the design of low-cost microgenerators using such materials.
In order to enhance the harvesting abilities, a nonlinear approach has been proposed that
allows an artificial increase of the global electromechanical coupling coefficient (Guyomar et
al., 2005; Lefeuvre et al., 2006; Makihara, Onoda and Miyakawa, 2006; Qiu et al., 2009; Shu,
Lien and Wu, 2007). This process consists of quickly inverting the piezoelectric voltage when
the displacement or temperature reaches a maximum or a minimum value (or equivalently
when the velocity cancels), as shown in Figure 4. Thanks to the dielectric behavior of
piezoelectric and pyroelectric materials, the voltage is continuous. Hence, the inversion
process allows a cumulative voltage increase effect, as well as an additional piecewise constant
voltage that is proportional to the sign of the velocity, allowing a magnification of the energy
conversion using both the voltage increase and the reduction of the time shift between
voltage and velocity. Practically, the inversion of the voltage is obtained by intermittently
connecting the active material to an inductor L (Figure 5), shaping a resonant network which
permits the voltage inversion if the switch SW is open for half an electrical oscillation period.
Nevertheless, the losses in this switching circuit lead to an imperfect inversion characterized
by the inversion factor γ (corresponding to the ratio between absolute voltages after and
before the inversion), which is comprised between 0 (no inversion - voltage cancellation) and
1 (perfect inversion).
In the framework of energy harvesting, the switching element can be placed either in parallel
or in series with the classical energy harvesting circuit (which consists of connecting the
material to a diode rectifier bridge and a smoothing capacitor C
s
as shown in Figure 6(a)),
respectively leading to the principles of the parallel Synchronized Switch Harvesting on Inductor
100
Ferroelectrics - Applications
Ferroelectric Materials for Small-Scale Energy Harvesting Devices and Green Energy Products 7
Fig. 4. Nonlinear treatment principles
Fig. 5. Practical implementation of the voltage inversion technique
(parallel SSHI - Figure 6(b) - Guyomar et al. (2005)) and series Synchronized Switch Harvesting on
Inductor (series SSHI - Figure 6(c) - Lefeuvre et al. (2006); Taylor et al. (2001)). Such an approach
typically allows a gain of 10 using classical components compared to the classical technique
when considering constant displacement magnitude. Harvested energies as a function of the
systems parameters (with f
0
the vibration frequency, X
M
the displacement or temperature
variation magnitude and R
L
the equivalent connected load) are listed in Table 3.
However, backward coupling influences the mechanical behavior of the host structure (more
particularly by introducing a damping effect) when using piezoelectric energy harvesting
at the resonance frequency. In this case, it is possible to get the displacement magnitude
u
M
from the mechanical energy analysis of the system, leading to the normalized harvested
(a) Classical
(b) Parallel SSHI (c) Series SSHI
Fig. 6. Energy harvesting circuits
101
Ferroelectric Materials for Small-Scale Energy Harvesting Devices and Green Energy Products
8 Feroelectrics Vol. IV: Applications
Technique Harvested energy Maximal harvested energy Gain (γ = 0.8)
Standard
(
4α f
0
)
2
R
L
(
1+4R
L
C
0
f
0
)
2
X
M
2
α
2
C
0
f
0
X
M
2
−
Parallel SSHI
(
4α f
0
)
2
R
L
[
1+2(1−γ)R
L
C
0
f
0
]
2
X
M
2
2
1−γ
α
2
C
0
f
0
X
M
2
10
Series SSHI
[
4(1+γ)α f
0
]
2
R
L
[
(
1−γ)+4(1+γ)R
L
C
0
f
0
]
2
X
M
2
1
−γ
1−γ
α
2
C
0
f
0
X
M
2
9
Table 3. Harvested energies for classical and SSHI techniques and gain under constant
displacement magnitude
powers depicted in Figure 7. To make this chart as independent as possible from the system
parameters, the power has been normalized with respect to the maximal harvested power in
the standard case when taking into account the damping effect:
P
lim
=
F
M
2
8C
, (8)
with F
M
the driving force magnitude. The x-axis of Figure 7 corresponds to the figure of merit
given by the product of the squared global coupling coefficient k
2
(reflecting the amount of
energy that can be converted) by the mechanical quality factor Q
M
(giving an image of the
effective available energy). This figure shows that the standard and SSHI techniques feature
the same power limit, but the nonlinear approaches permit harvesting the same amount of
energy than the classical scheme for much lower values of k
2
Q
M
, meaning that much less
volume of active materials is required. Figure 7 also shows that the series SSHI performance
is very close to the parallel SSHI. It can be noted that these nonlinear approaches also permit
increasing the bandwidth of the microgenerator (Lallart et al., 2010c). Losses in the inductance
that limit the power increase can also be controlled using proper approaches, such as smoother
inversion (Lallart et al., 2010d), PWM actuation that insures a perfect inversion
2
(Liu et al.,
2009) or by ensuring that the inversion losses are always less than the converted energy over
a given time period (Guyomar and Lallart, 2011).
Finally, another way to enhance the conversion abilities is to consider a bidirectional energy
flow from the source to the storage stage (Lallart and Guyomar, 2010e). This approach permits
beneficiating of a particular “energy resonance” effect as the converted energy equals the
Fig. 7. Normalized harvested powers under constant force magnitude at the resonance
frequency
2
In this case, driving losses may however compromise the energy balance.
102
Ferroelectrics - Applications
Ferroelectric Materials for Small-Scale Energy Harvesting Devices and Green Energy Products 9
converted energy without providing initial energy (from the storage stage) plus twice the
cross-product of the initial voltage V
0
times the voltage generated by the active material:
W
conv
|
bidir
=
1
2
C
0
α
C
0
X
M
+ V
0
2
−
1
2
C
0
V
0
2
=
1
2
α
2
C
0
X
M
2
+ 2αV
0
X
M
. (9)
Hence, as the harvested energy increases, the initial provided energy during the beginning
of a new cycle increases as well, allowing harvesting more energy, and therefore closing the
“energy resonance” loop. This approach permits a typical harvested energy gain up to 40
under constant displacement magnitude (or constant temperature variation magnitude) as
well as bypassing the power limit when considering the damping effect.
It can also be noticed that instead of adding external nonlinearities, Guyomar, Pruvost and
Sebald (2008); Khodayari et al. (2009); Zhu et al. (2009) have shown that the energy harvesting
performance may be also enhanced by using the intrinsic nonlinear behaviors of pyroelectric
materials, such as ferroelectric
↔ferroelectric or ferroelectric↔paraelectric phase transitions.
5. Energy transfer optimization
The next stage in the energy conversion chain lies in the energy transfer from the active
material to the storage stage. As the amount of energy provided to the electronic device may
alter the energy conversion process (which can be seen from the load-dependent powers in
Table 3 and in Figure 8), additional interfaces have to be included so that the energy extracted
from the active material is maximum. This section proposes to expose two possibilities to
ensure a harvested energy independent from the connected load by:
• Ensuring that the active material sees the optimal load.
• Decoupling the extraction and storage stage through a nonlinear approach.
The simplest way for ensuring that the load seen by the piezoelectric or pyroelectric material
equals the optimal one that maximizes the harvested power consists of adding a converter
between the active element and the extraction stage (Han et al., 2004; Lallart and Inman,
Fig. 8. Normalized harvested powers under constant displacement magnitude (or constant
temperature variation magnitude) as a function of the load (normalized with respect to the
optimal load in the standard case)
103
Ferroelectric Materials for Small-Scale Energy Harvesting Devices and Green Energy Products