Biofuel''''s Engineering Process Technology Part 16 ppt
Bạn đang xem bản rút gọn của tài liệu. Xem và tải ngay bản đầy đủ của tài liệu tại đây (749.73 KB, 40 trang )
Energy Paths due to Blue Tower Process
591
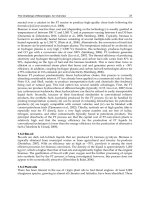
Through the tests, the syngas components and the equilibrium constants were obtained. For
instance, Fig.3 illustrates the gaseous yields on the pyrolysis at 550 °C with variation of S/C
=0.14 to 0.98, and the reforming reaction at S/C=1.0 with variation of 800 to 950 °C,
respectively. Here, a steam carbon ratio is defined as the following equation.
2
Added Steam [mol/s] Moisture [mol/s]
/
Carbon Content of Material [mol/s]
SCmol HO mol C
(5)
Note that the gaseous components are modified at 20% moisture content. Also, the approach
temperature for each reaction is shown as Table 3.
Reaction
T
Unit
Pyrolysis 78.3 °C
Reforming 252.0 °C
Table 3. Approach temperature for each reaction (estimated)
a) Pyrolysis (550 °C, S/C=0.14-0.93)
b) Reforming reaction (800-950
°C, S/C=1.0)
Fig. 3. Gaseous yields of pyrolysis (a) and reforming reaction (b).
Biofuel's Engineering Process Technology
592
Based on the above experimental results, we estimated the following material balance:
31.078 43.495 23.677 0.069 2
2422
25
2 3 2.686 0.482 0.343 0.004
31.078
24.052 11.682 2.435 9.442 23.228
2.92 10 4.40 10
CHON HO
HCOCHCOHO
NNHCHON
(6)
2.686 0.482 0.343 0.004
CHON is the chemical component of char, and its heating value was 32.0
MJ/kg. In our simulator, the energy performance would be solved so that the input and the
output on heat and materials would be balanced.
Next, using 9.5mm ball, we measured the temperature profiles at the surface of ball and
the center of it. In the phase of absorption of heat, the ball was kept at each designed
temperature between 200 and 950 ºC. At the time, there was difference between the surface
temperature and the center one, and the temperature differences were measured. Inversely,
in the phase of heat radiation, the ball was heated up to 1,000 ºC in the furnace, and it was
put in a room temperature. Simultaneously, the temperature differences were measured.
Note that these temperature profiles are time series data.
As a result, the thermal conductivities can be obtained. Also, since the thermal circulation
time has to be the same as the reacting time on a pyrolysis and a steam reforming reaction,
the optimal size of the ball is decided. Thus, the adequate auxiliary power for the circulation
of HC would be obtained. Due to this result, we can estimate the suitable residence time in
each reactor for the temperature profile which would be led by the simulator. Based on the
above concept, we could estimate the syngas through BT process (Dowaki et al., 2008a,
Dowaki, 2011a).
2.2 Process design of energy production system through BT process
Next, we introduce the examples of process design through BT process. As we mentioned
before, there would be many energy paths through BT process. Here, as the examples, H
2
production and Cogeneration system (CGS) would be concentrated. The purpose of each
process design would be due to the energy analysis and/or the environmental one using
LCA methodology.
2.2.1 Case study of Bio-H
2
production system
Through a reaction process based on superheated steam, the biomass is converted to the
syngas with a high concentration of H
2
. In the BT process, pyrolysis gases are reformed with
H
2
O (steam), and Tar and Char are generated as co-products. Since Tar contents pass
through the higher temperature zone, the residual volume would be negligible. Also, due to
the recycling of the sensible heat of syngas, the total efficiency of the entire system would be
improved.
Here, the process design of Bio-H
2
was executed by the consideration of basic experimental
results.
The capability of the biomass gasification plant is 12 t/d, and the annual operation days are
300 day/yr. In the process design, the heat energy generated from the gasifier was assumed
to be utilized as the energy for materials dryer. Due to the recycling of thermal energy, the
energy of dryer can be reduced at most. For instance, the moisture content can be
compensated up to 42 wt.% against the initial moisture content of 50 wt.%. The syngas
generated through BT gasifier is transferred to the shift-reaction convertor, and then is fed
Energy Paths due to Blue Tower Process
593
into PSA (Pressure Swing Adsorption). In the PSA, the high concentrated H
2
gas was
purified to 99.99Vol.% (4N) of H
2
gas.
Here, Tables 4 shows the performance of Bio-H
2
production system. In Tables 4, the cold gas
efficiency
Cold
is defined as follows:
MJ h
MJ h MJ h MJ h
Cold
Syngas
Feedstock Char Offgas
(7)
Also, the total efficiency
Total
of this system is
2
io-H MJ h
MJ h
Total
B
Feedstock
(8)
BT Process (15 t/d) Feedstock 635.9 kg/h
8,415 MJ/h
Syngas
(For Bio-H
2
)
678.5 Nm
3
/h
4,544 MJ/h
Cold-Gas Eff.
Cold
62.0% LHV-%
Auxiliary Power 247.4 kW
PSA (4N-H
2
) Bio-H
2
303.5 Nm
3
/h
3,275 MJ/h
Total Eff.
Total
38.9% LHV-%
Table 4. Performance of Bio-H
2
production system (estimated)
2.2.2 Case study of Cogeneration system
Next, we explained about the co-generation system by which electricity and thermal energy
can be generated. In the case of BT-CGS, due to the heat balance, the reaction energy in the
furnace might be shortage. Thus, the additional feedstock would be necessary. In the case of
Bio-H2 production system, since off-gas through PSA is available, the additional biomass
material is not required.
Also, from the viewpoint of the economic condition, the case that the additional one is fed
into BT would be much better in comparison to the case without any feedstock. That is,
more products (i.e. electricity and/or thermal energy) can be generated. Consequently, the
economic condition of BT-CGS operation would be improved by a lot of energy products.
Thus, we consider BT-CGS case in which the additional feedstock is required.
For the operation of gas-engine due to the low calorific heating value of bio-gas which
means the syngas of BT gasifier, although there are sometimes problems on the heating
value of fuel, we executed the process design using the practice parameters which were
analysed by the engine manufacturing maker.
Table 5 shows the performance of Bio-CGS. In Tables 5, the cold gas efficiency
Cold
, the net
power efficiency
Pow
, the heat recovery efficiency
Heat
and the net total efficiency
Total
are
defined as follows:
Biofuel's Engineering Process Technology
594
MJ h
MJ h MJ h . MJ h
Cold
Syngas
Feedstock Char Add Feedstock
(9)
Power Power-Auxiliar
y
MJ h
MJ h . MJ h
Pow
Net
Feedstock Add Feedstock
(10)
MJ h MJ h
MJ h . MJ h
Heat
Steam Hot water
Feedstock Add Feedstock
(11)
Total Pow Heat
(12)
¶(9pt)BT Process
(18 t/d)
Feedstock
625.0 kg/h
8,278 MJ/h
Additional
Feedstock
139.5 kg/h
1,846 MJ/h
Syngas
(For Gas-engine)
1,021 Nm
3
/h
6,922 MJ/h
Cold-Gas Eff.
Cold
59.0% LHV-%
Auxiliary Power 111 kW
Gas-Engine
Power (Net) 459 kW
Steam 1,344 MJ/h
Hot water 1,551 MJ/h
Power Eff. 16.3% LHV-%
Heat Recovery Eff. 28.6% LHV-%
Total Eff.(Net) 44.9% LHV-%
Table 5. Performance of BT-CGS (estimated)
3. Concept of the biomass Life Cycle Assessment
So far, the biomass Life Cycle Assessment (LCA) analyses, in which the pre-processing
process of chipping, transportation and drying of biomass materials are included, and in
which the energy conversion process of a production energy of electricity and/or heat
through an integrated gasification combined cycle (IGCC) power system or a co-generation
system (CGS) is included, were analysed (Dowaki et al. 2002, Dowaki et al. 2003).
In this section, we describe on the BT-CGS and the production system of Bio-H
2
. At the
beginning, in this section, we defined the system boundary of the biomass LCA. A target is
to estimate a life cycle inventory (CO
2
emissions and/or energy intensities) of the entire
system with a biomass gasification system and/or a purification one. That is, we refer to the
environmentally friendly system, such as the biomass energy system, considering CO
2
emissions and/or energy intensities from the entire system based on LCA methodology.
Energy Paths due to Blue Tower Process
595
In the case of BT-CGS or Bio-H
2
, due to the shortage of reaction heat in the furnace or the
larger auxiliary power output of PSA, the specific CO
2
emission might be affected. That is,
the process design and the energy analysis on basis of the process simulation would be
extremely significant.
3.1 System boundary
Following ISO 14041 guidelines, we define the system boundary in the biomass energy
system.
The system boundary includes the entire life cycle of Bio-H
2
fuel or electricity and thermal
energy products, including the pre-processing process and the energy conversion process.
(See Fig. 4). In the pre-processing process, there are sub-processes of chipping,
transportation by trucks, and drying. In the energy conversion process, there are sub-
processes of the gasification through the BT plant with a purification process or a CGS unit.
Also, in our estimation, we focused on “well to tank (WtW)” analysis.
Fig. 4. System boundary of biomass LCA.
3.2 Functional unit
The target product is Bio-H
2
and CGS products of electricity and/or heat energy. Thus, the
functional unit is assumed to be the unit per a produced energy. The lower heating values of
H
2
and electricity are 10.8 MJ/Nm
3
and 3.6 MJ/kWh, respectively.
3.3 Pre-processing process
In the pre-processing process, there are sub-processes of chipping, transportation, and
drying of biomass materials. In particular, within the sub-processes of transportation and
drying, we have to consider uncertainties. To date, there are few studies considering these
uncertainties. CO
2
emissions and energy intensities in the biomass LCA would be affected
by the moisture content of biomass materials, and the transportation distance from the
Biofuel's Engineering Process Technology
596
cultivation site, or the site of accumulating waste materials, to the energy plant. Table 6
shows heating values, and that of CO
2
emissions, for each fuel with biomass materials,
respectively. Also, CO
2
emissions and energy intensities were estimated using the Monte
Carlo simulation in order to consider these uncertainties (Dowaki and Genchi, 2009).
Fuel CO
2
Note
Feedstock 0.0 g-CO
2
/MJ-Fuel
at 20 wt.% (moisture content), Japanese
Cedar, HV:13.23 MJ/kg
Diesel 74.4 g-CO
2
/MJ-Fuel Chipping, Transportation, HV: 35.50 MJ/L
Electricity 123.1 g-CO
2
/MJ-Fuel
Auxiliary power of the plant (Primary
Energy)
Table 6. Data of the specific CO
2
emissions
3.3.1 Sub-processes of chipping, transportation and drying
The energy consumption of chipping, transportation and drying is as follows:
a. Chipping: The energy consumption of the chipping process is due to electricity and
diesel. The specific units of energy consumption are 13.6 kWh/material-t (122.4
MJ/material-t) and 1.23 L-diesel/material-t (43.7 MJ/material-t), respectively
(Hashimoto et al., 2000).
b. Transportation: The chopped biomass materials are delivered to the plant by 10 ton
diesel trucks. CO
2
emissions and/or energy intensities on a given transportation run
would be affected by the weight of biomass materials. That is, the weight of which the
materials can be carried is restricted to bulk density. We measured the bulk density
(=0.14 t/m
3
) in the atmosphere. The bulk density is dependent upon the moisture
content. Thus, assuming that the bulk density is at a moisture content of 15 wt.% (
15
),
the bulk density
M
C
at any moisture content (
M
C wt.%) is
15
0.85
1
MC
MC
(13)
Next, the loading platform of 10t-trucks is to be approximately 24.7 m
3
(Suri-Keikaku
Co. Ltd., 2005). Consequently, even a truck with 10 ton’s volume cannot always carry
that in full weight. Here, CO
2
emissions and/or energy intensities are assumed to be
due to the fuel consumption of truck, which is indicated as a function of the loading
rate of weight. That is, using the loading rate of
, the fuel consumption rate of a 10t-
truck
FC
f is
FC
f
ab
(14)
where, a(=714 g-CO
2
/km) and b(=508 g-CO
2
/km) are constants on the fuel
consumption of the truck (Dowaki et al., 2008b).
The definition of the loading rate of
is as follows: Assuming that the plant scale is Ps
dry-t/d, and that the annual operating time is 300 days, the annual material balance on
the feed materials is 300Ps t-dry/yr. Since the throughput per year at
M
C wt.% is
300 1Ps MC , the total number of transportation by 10 t trucks at
M
C wt.% (
mat
N )
is
Energy Paths due to Blue Tower Process
597
300 1
1
24.7
mat
MC
Ps MC
N
(15)
Where,
is represented as the maximum integer, so as not to exceed . Thus, the
average loading rate of a 10 t-truck (
ave
) is
300 1
10
ave
mat
Ps MC
N
(16)
Providing the average loading rate, and multiplying
FC
f
by the transportation
distance and the specific CO
2
emissions or the energy consumption of diesel, we can
estimate CO
2
emissions or fuel consumption in the transportation sub-process. In this
paper, the transportation distance is the range between 5 (
min
Dist ) and 50 km
(
max
Dist ), because the wooden materials in Japan are distributed widely. That is, it is
assumed that the feed materials are collected within a radius of 50 km.
c. Drying: Next, on the sub-process of drying, the energy consumption was estimated
under the condition that the moisture content of feed materials would decrease to 20
wt.%. Here, assuming that the initial moisture contents are from 20 (
min
MC ) to 50 wt.%
(
max
MC ), the raw materials are dried by a boiler. Also, the auxiliary power of a pump
in a boiler is included in the energy consumption of the sub-process. The operational
specification of a wood-chip dryer (boiler) is the energy efficiency of 80 %, and the
auxiliary power of a pump of 0.195 kWh/t-water (1.75 MJ/t-water). Note that the
moisture content of feedstock can be reduced by the hot exhausted gas to some extent.
d. Monte Carlo simulation on the uncertainties:
As the above, in this paper, we estimated
CO
2
emissions and/or energy intensities, considering the uncertainties of the
transportation distance and the moisture content. In this paper, the following two
uncertainties of the distance and the moisture content were considered by the Monte
Carlo simulation.
That is, the uncertainties on the transportation distance ( Dist km) and the moisture
content (
M
C wt.%) are represented by uniform random numbers
i
Rnd between 0 and
1 in Eqs. (17) and (18). Note that
1
Rnd and
2
Rnd are independent and identically
distributed.
min 2 max min
Dist Dist Rnd Dist Dist
(17)
min 1 max min
MC MC Rnd MC MC
(18)
An iteration count in the simulation was executed up to 10,000. The range within a 95 %
significant level was adopted as the uncertain data on the distance and the moisture
content, in order to estimate CO
2
emissions. In this case, the gross distributions on CO
2
emissions would be normal distributions.
3.4 CO
2
emissions on CGS and Bio-H
2
fuel
Based on the above data, CO
2
emissions of CGS (electricity and/or thermal energy) and Bio-
H
2
fuels are shown in Fig. 5.
Biofuel's Engineering Process Technology
598
0.0
30.0
60.0
90.0
120.0
150.0
min. max. ave. min. max. ave.
CO
2
emissions [g-CO
2
/MJ-product E]
Auxiliary Dryer Transportation
Chip Conv.Electricity Conv. H2
Electricity
Case 2 (Bio-H
2
production)
Case 1(CGS)
Fig. 5. CO
2
emission in each case (Case 1:CGS, Case 2 Bio-H
2
production).
According to Fig. 5, the entire CO
2
emissions are 16.3-65.7 g-CO
2
/MJ of CGS and 39.6-95.3 g-
CO
2
/MJ of Bio-H
2
, respectively. Especially, in the CGS case, the specific CO
2
emissions of
electricity are 5.9-23.9 g-CO
2
/MJ, and the reduction percentages in comparison to the
conventional electricity in Japan are 80.6-95.2%. In the case of Bio-H
2
case, the reduction
percentages against the conventional H
2
production (121.3 g-CO
2
/MJ, Natural gas origin)
are 21.4-67.3%.
CO
2
emissions at the material drying and at the auxiliary power of a purification process of
PSA occupy a large portion of the entire CO
2
emission. Especially, the influence due to the
compression power of H
2
purification would be significant. In the case of Bio-H
2
, the
amount of 35.1% to 84.4 % of the total CO
2
emissions would be emitted from the auxiliary
power including the power for BT operation. Also, in the case of CGS, that of 16.5% to 66.6
% would be emitted from the auxiliary power origin, even if the PSA operation is not
equipped.
The deviations of CO
2
emissions (the maximum value – the minimum one) due to the
uncertainties on the moisture content and the transportation distance would be within 49.5
g-CO
2
/MJ of CGS and 55.7 g-CO
2
/MJ of Bio-H
2
, respectively.
That is, the range of collection of biomass feedstock would be extremely significant from the
viewpoint of CO
2
emission reduction on basis of LCA methodology.
4. Future application of bio-fuel
As we mentioned before, the renewable energy source, especially, the biomass energy
source would be promising for global warming protection. Using the biomass feedstock,
there are many fuels which can be converted through the gasification, the fermentation or
another process. Here, we concentrated to the biomass gasification process by which
electricity and thermal energy or Bio-H
2
fuel are produced. Also, the CO
2
emission due to
Energy Paths due to Blue Tower Process
599
LCA methodology, which is estimated in order to understand the impact of Global warming
numerically, was estimated. As a next step, we have to create the countermeasure
for promotion of our proposed system. However, there is not example in which the
relationship between the supply and the demand is argued enough. Based on the sequential
and entire system, we have to judge the effects and/or the benefits such as CO
2
emission etc.
(See Fig. 1).
Here, as a good example, we introduce the following system. However, that might be
difficult to promote our proposed system due to the cost barrier against a conventional
system at the present time. The combined system in which the renewable energy such as
Bio-H
2
can be available would have a significant meaning in the future utilization for Global
warming protection. Simultaneously, we have to create the new business model which
would be suitable for the end users.
Now, there is the proposal to install an advanced cell phone (a smart phone) with a PEFC
unit so as to get CO
2
benefit. A smart phone is an electronic device used for two-way radio
telecommunication over a cellular network of base stations known as cell sites. The sale of
mobile phones has been one of the fastest growing markets in the world today. For instance,
the cell phone users of Japan were approximately 107 million in 2005 (Infoplease, 2005). At
present, around 85% people in America have used cell phone. In addition, new technology
of a mobile communication is being developed very quickly. A few years ago, people used
their cell phone just for making a call or sending a short mail through a SMS function.
However, at the current time, there are a lot of features of a smart phone such as music
player, video player, game, chatting, internet browsing and email, etc. These factors should
increase energy consumption and increase CO
2
emission.
The current power supply system in a smart phone is dominated by a Li-ion battery, which
has some advantage such as wide variety of shapes/sizes without a memory effect. In
addition, the rapidly advancing needs for mobile communication are increasing the
consumer demand for portable application with even higher power output, longer
operation time, smaller size, and lighter weight. A Li-ion and other rechargeable battery
system might not be suitable for high power and long time span portable devices due to
their lower energy density, shorter operational time, and safety. Li-ion batteries are well
established as a power supply for portable devices. Recently, since the power demand has
been increasing faster than battery capabilities, the fuel cells might become a promising
alternate for niche applications. A fuel cell is an electrochemical device which continuously
converts chemical energy into electricity and thermal energy by feeding H
2
fuel and oxygen
into it. A fuel cell power supply can be higher energy per a unit mass than conventional
batteries. Also, the using of fuel cell system is not harmful to the environment, if compared
with a Li-ion battery (Hoogers, 2003). Also, there are the following two types of fuel cell: 1)
Polymer Electrolyte Fuel Cell (PEFC) and 2) Direct Methanol Fuel Cell (DMFC), which are
operated in low temperature. These two systems are almost same, the difference is only in
fuel, that is, the PEFC is operated by H
2
(gas) and DMFC is done by methanol (liquid). Here,
we focused on the PEFC into which H
2
fuel is fed. The reason why we concentrate the
system is that the fuel for a PEFC can be produced by the renewable resources such as
biomass feedstock with a lower CO
2
emission in comparison to the conventional production
system. In the area where there is plenty of biomass feedstock (e.g. Indonesia and Malaysia
etc.), there is a good potential to install that. A PEFC is applied to replace a Li-ion battery. A
comparison of CO
2
emission between a Li-ion battery cell phone and a PEFC cell phone was
calculated using Life Cycle Assessment (LCA) methodology, in consideration of the user's
behaviour.
Biofuel's Engineering Process Technology
600
4.1 A case study on a smart phone due to LCA methodology
The goal of this study is to compare the CO
2
emission of the conventional Li-ion cell phone
and the PEFC cell phone. The functional unit is the specific CO
2
emission per a life cycle
(LC) of kg-CO
2
/LC. Fig. 6 shows the life cycle stage on the schematic design of system
boundary, in which a pre-processing of raw materials, a manufacture, a transportation and
distribution, an energy consumption of end users and a disposal process are included. Also,
in this study, we referred to the duration time of each operation of cell phone (Dowaki et al.,
2010a).
Energy use sector
System boundary
Transportation
Biomass Material
(Waste Wood etc.)
Drying
H
2
production
(Blue Tower
*
)
Fossil liquid fuel
Electricity
(Fossil fuel origin)
Auxiliary
Fuel
H
2
fuel for
PEFC-Smart phone
Direct CO
2
emission
*
(Due to energy use)
* Biomass gasification system
+ H
2
purification system
(except transportation of a fuel cartridge)
Electricity
**
for
Li-ion Smart phone
Indirect CO
2
emission
*
(Due to cell equipment)
Note:
* Estimated period=2.6 years
** This value is based on the wheel to tank, that is, the input energy for producing the fuel besides raw energy source (primary energy) is considered, too.
Cell phone equipment manufacture sector
Raw Material
Manufacture
(part, member)
Smart phone
Fossil fuel
Li-ion Smart phone
(Conventional)
PEFC Smart phone
(Target case)
Life time=2.6 years
Life time=2.6 years
(Assumption)
Transportation
Fuel
Fig. 6. System boundary of a cell phone analysis.
In the system boundary, as we described the prior section, we think about the availability of
Bio-H
2
through BT process. For the purpose, we executed the questionnaire on the way to
use a smart phone firstly. Also, we executed the performance of a PEM cell which is based
on a PEFC unit using the electric power measurement device.
The difference between a Li-ion and a PEFC cell phone is in electrical energy sources. The
Li-ion cell phone is supplied by conventional electricity, whereas a PEFC cell phone is done
by Bio-H
2
as an energy input. The battery charge due to the conventional electricity emits
CO
2
of one of the greenhouse gases. On the other hand, since the Bio-H
2
would be carbon
neutral, the CO
2
emission is equivalent to zero in a combustion process. However, the
production process of a renewable fuel is accompanied with the conventional energy inputs
(i.e. fossil fuels). Thus, it is extremely important to estimate the energy system based on LCA
methodology.
4.1.1 A questionnaire for the smart phone users
In order to investigate the way to use a smart phone in each user, we executed the
questionnaire between February 17 and February 24, 2011. 200 respondents in Japan
Energy Paths due to Blue Tower Process
601
participated in this research. Also, target respondents are the users who use a smart phone,
with their ages between 15 and 65 years, respectively. In the questionnaire content, the
duration time of a talking, a SMS, music (MP3), a game, a web-site (internet), an e-mail
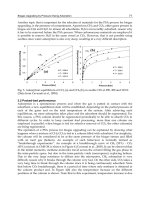
checking, and an idle time were estimated for each age category. Fig. 7 shows the result of
the duration time of each function. The checking time of internet would be larger in both
weekdays and holyday (Dowaki et al., 2011b).
0
20
40
60
80
100
120
Talking Music Game SMS e-mail Internet
Duration time (Weekday)
[min/day]
under 20s 20s
30s 40s
over 50
a) Weekdays
0
20
40
60
80
100
120
Talking Music Game SMS e-mail Internet
Duration time (Holiday)
[min/day]
under 20s 20s
30s 40s
over 50
b) Holiday
Fig. 7. Duration time of each function in a smart phone.
4.1.2 Measurement of the performance of a PEFC unit
Based on the duration time, we measured the performance of a PEM-cell which is based on
a PEFC unit for a smart phone. That is, using the result of output capability of a PEM-cell
and the maximum duration time, we designed the cell area of a PEFC, and estimated the
energy consumption for each function.
Here, in order to have a good reliability, 10 times experiments have been done for the
following tasks: a talking, a SMS, music (MP3), a game, a web-site (internet) and an e-mail
checking, respectively. In our experiments, we used the electric measurement device
(AC/DC POWER HiTESTER 3334, HIOKI E.E. Corp.) to measure the voltage and the
current, and the power which is obtained by these factors.
Next, for the purpose of estimating the cell performance, we measured the potential of a
PEM-cell in varying currents. The apparatus consists of a PEM-cell (Micro Inc.) and a
Biofuel's Engineering Process Technology
602
potentiostat (HAB-151, Hokuto Denko Corp.). The size of the cell with low platinum loading
electrodes (1.0 Pt mg/cm
2
) and Nafion® 115 is 4 cm2×3 cells. Using a potentiostat, 1) an
open circuit voltage
0
V [Volt] was measured and 2) the relationship of current density J vs.
cell potential V was evaluated between approximately 200 mV/cell and an open circuit
potential
0
V . Also, H
2
flow in anode was up to 20 ml/min and the concentration of H
2
was
100 vol.% at a constant percentage (see Fig.8). Note that each parameter on the performance
of a PEM-cell is decided at the condition which is not rate-limiting. In this case, we adopted
the flow rate condition of 20 ml/min. The cathode was stayed at the atmospheric condition.
The conditions in both the anode and cathode sides were not saturated by steam (Dowaki et
al., 2010a, Dowaki et al., 2011b).
Next, the relationship between a cell’s potential and current density, in the low and
intermediate current density region of a PEM-cell, has been shown to obey the following Eq.
(19) (Kim et al., 1995). Note that the result was shown by the condition of a single PEM- cell.
0.0
0.2
0.4
0.6
0.8
1.0
1.2
0.0 30.0 60.0 90.0 120.0
Cell voltage (a single cell) [Volt]
Current density [mA/cm
2
]
Measured
Estimated
Fig. 8. Relationship between current density and a cell voltage in the single PEM-cell.
0
Vlog exp
cell
Vb JRJm nJ
(19)
Where,
J ,b,
cell
R , m and n are current density [mA/cm
2
], Tafel slope [mV/decade], a cell
resistance [ohm-cm
2
] and constant parameters, respectively.
Based on the experimental result, we analysed each parameter by the approximation
formula of Eq. (19). Consequently, the open circuit voltage
0
V , the Tafel slope b , a cell
resistance
cell
R and constant parameters of m and n were 1.16 Volt, 54.0 mV/decade, 2.98
ohm-cm
2
, 9.08 and -2.53×10
-3
were obtained. Using these parameters, we designed the PEFC
unit of a smart phone as follows: the surface area is 22 cm
2
, and the stack number of cell is 3.
These conditions would be suitable of a conventional smart phone size and satisfy the
maximum output among each function. Also, the stoichiometric ratio is assumed to be 1.00.
This means the supplied H
2
would be fully consumed.
Energy Paths due to Blue Tower Process
603
Next, due to the questionnaire for smart phone users (see Fig. 7), the energy consumption
for each function and the performance of PEFC using a PEM-cell experimental result, we
estimated CO
2
emission on basis of LCA methodology. Using Eq. (19), the H
2
flow rate in
practice use is able to be calculated. Here, a PEFC would be operated between 1.17 and 2.63
Volt. The specific energy consumption in each function was between 0.39 and 37.7
Nml/min.
4.1.3 Specific CO
2
emission of a smart phone
Based on the above analysed results, we estimated the CO
2
emission of a smart phone use.
Here, we considered the indirect and the direct CO
2
emissions. The direct CO
2
emission is
equivalent to the fuel consumption origin. On the other hand, the indirect one is mainly on
the device of a smart phone. In this study, we focused on HTC Desire X06HT made in
Taiwan as a model phone. The indirect CO
2
emission is calculated by Input-Output (IO)
table, and this emission referred to the prior result. Also, we estimated the conventional
smart phone including Li-ion battery in order to compare to the new one. Assuming that the
holding time (life time: LT) when one user has a smart phone until he or she change the new
one is 2.6 years, the indirect CO
2
emission of HTC Desire X06HT including Li-ion battery
would be 15.32 kg-CO
2
/unit. The emission of a smart phone with a PEFC unit would be
15.30 kg-CO
2
/unit. Although there are uncertainties on the storage tank of H
2
to some
extent, referring to the data of DMFC storage tank which has already developed, we
estimated the emission as almost same as the conventional case (Dowaki et al., 2010a).
Next, the direct CO
2
emission is affected by the specific CO
2
emission of each fuel. Here, the
CO
2
emissions of conventional electricity, H2 fuel of natural gas origin (on-site) and Bio-H
2
are assumed to be 123.1 g-CO
2
/MJ, 121.3 and 39.6 g-CO
2
/MJ-H
2
, respectively. The CO
2
emission per one life cycle is shown in Fig. 9. Note that the specific emission of Bio-H
2
is a
minimum level (see Fig. 5).
10.0
12.0
14.0
16.0
18.0
20.0
22.0
Li-ion
BT-H2
Fossil-H2
Li-ion
BT-H2
Fossil-H2
Li-ion
BT-H2
Fossil-H2
Li-ion
BT-H2
Fossil-H2
Li-ion
BT-H2
Fossil-H2
Under 20 20's 30's 40's Over 50
CO
2
emission [kg-CO
2
/LC]
Case categories
Direct CO2 Indirect CO2
Fig. 9. Life Cycle CO
2
emission for a smart phone use.
According to this result, due to application of a PEFC unit to the smart phone, we would be
able to reduce CO
2
emissions of 3.9% to 6.1 % in comparison to the conventional phone.
Especially, in the category of younger generation, the CO
2
reduction benefit would be
effective.
Biofuel's Engineering Process Technology
604
4.2 A case study on a greenhouse facility due to LCA methodology
Next, we propose the advanced greenhouse system for paprika cultivation with the
combined biomass gasification process of BT with SOFC (Solid Oxide Fuel Cell). The BT
gasifier which is a biomass gasification process has a characteristic of generating hydrogen
gas of high concentration in syngas. Here, we considered the acceptability for the related
facilities in agriculture field. Because the environmentally friendly system such as a PV
system or a fuel cell co-generation system is still not enough to be promoted for those
facilities. That is, there would be potential to combine the biomass energy system which is
environmentally friendly with the agriculture related facilities. In addition, MAFF
contribute to the global warming protection through the carbon-footprint of agricultural
products. The ministry has a few subsidy menus on the promotion of the system. Also, on
the surplus energy of electricity and/or thermal energy, there are institutions by which the
energy companies are obliged to purchase them with additional fees.
Using the above institutions and/or subsidy menus under the leadership of the Japanese
government, we considered the following concrete paprika harvesting system in which the
biomass gasification (BT) process with SOFC is assumed to be introduced (Dowaki et al.,
2010b).
First, our model site is the paprika harvesting facility in Miyagi of Japan, whose area is 4.6
ha. In our study, through interviews from the owner company, we used the data of not only
the energy consumption of electricity and oil, but also the supply of CO
2
gas which is fed
into the greenhouse as a growth promoting agent. That is, in the model we proposed, the
electricity, the thermal energy and the CO
2
gas which is included in exhausted gas through
BT plant are assumed to be available for the greenhouse facility of paprika harvesting. In
addition, due to the combination of the advanced power generation such as SOFC,
additional benefit of CO
2
emission reduction would be obtained. This may be advantageous
from the profit aspect since the surplus electricity would be able to be sold to the
commercial energy companies. Also, from the viewpoint of thermal energy use, the
combined BT with SOFC units would be advantageous since the exhausted gas with a high
temperature (ca.700 °C) is generated. Although the operation of SOFC has been in a
developmental stage, we used the published parameters. The initial cost of SOFC unit seems
to be costly in comparison to the conventional power system. However, it is said that the
commercial stage of SOFC is close. Thus, the initial cost was assumed to be equivalent to the
target price as of 2015. The thermal energy for the greenhouse is supplied by the heat pump
equipment. This would bring to the benefit of cost and/or CO
2
emission reduction, since
there is little waste thermal energy (Dowaki et al., 2011c).
On the other hand, MAFF tries to introduce the carbon-footprint for the agricultural
products. It is difficult to estimate the monetary values of CO
2
emissions of agricultural
products. For instance, Kikuchi et al. investigated the willingness to pay for CO
2
emission
reduction of vegetables (Kikuchi and Itsubo, 2009). They found out that the consumers have
a willingness to pay for an additional cost of approximately 5% up against a conventional
price. Although this is only a limited effect, there would be a potential to earn income due to
the carbon footprint. That is, with regard to income in our system, revenues to the plant
owner would include the related subsidy, the processing fee of waste material, the sale of
surplus electricity and the paprika sale with low CO
2
emission. The carbon-footprint of
agricultural product might be important one of income sources.
In this study, we analysed the CO
2
emission due to LCA methodology.
Energy Paths due to Blue Tower Process
605
4.2.1 A LCA for the paprika cultivation
In the LCA concept of this paper, the direct factors and the indirect ones have to be
considered. In our definition, fossil fuel energy inputs (primary energy basis) and the
electricity of fossil fuel origin are included in the direct factors. Also, chemical fertilizers are
included in the indirect ones. Here, note that another greenhouse gases such as N
2
O and
CH
4
are not taken into consideration.
So far, in the biomass LCA analyses, the pre-processing process of chipping, transportation
and drying of biomass materials, and the energy conversion process of a production energy
of electricity and/or heat, through an energy system are included. This time, the paprika
harvesting process has to be added to the entire life cycle stage. Using the chemical
experimental data, the design of BT plant with SOFC units would be extremely significant in
the biomass LCA. A target is to estimate a life cycle inventory of the entire system with BT
gasifier and SOFC.
Here, we describe on the system boundary in this study. Following ISO 14041 guidelines,
we define the system boundary in the biomass energy system (see Fig. 10) (Dowaki et al.,
2010b).
Fig. 10. System boundary of a paprika production system.
The system boundary includes the entire life cycle of each energy input (electricity/thermal
energy), including the pre-processing process, the energy conversion process and the
paprika harvesting process. In the pre-processing process, there are sub-processes of
chipping, transportation by trucks, and drying. In the energy conversion process, there are
sub-processes of the gasification through the BT plant (19 t/d) with the four units of SOFC
(200 kW/unit) process. In the paprika harvesting process, it is assumed that the exhausted
gas of CO
2
is available as a growth agent. Here, the target product is a paprika. Thus, the
functional unit is assumed to be the unit per a produced paprika (Dowaki et al., 2011c).
Next, in the pre-processing process, there are sub-processes of chipping, transportation, and
drying of biomass materials. In particular, within the sub-processes of transportation and
drying, we have to consider uncertainties (see section 3.3.1). To date, there are a few studies
considering these uncertainties. CO
2
emissions in the biomass LCA would be affected by the
moisture content of biomass materials, and the transportation distance from the cultivation
site, or the site of accumulating waste materials, to the energy plant. Hence, it would be
extremely significant to consider these factors. Table 7 shows the specific CO
2
emissions, for
each fuel with biomass materials, respectively.
Biofuel's Engineering Process Technology
606
Item CO
2
Note
Feedstock 0.0 g-CO
2
/MJ-Fuel at 20 wt.% (moisture content), Japanese
Cedar, HV:13.23 MJ/kg
Diesel 74.4 g-CO
2
/MJ-Fuel Chipping, Transportation, HV: 35.50 MJ/L
Bunker A 76.9 g-CO
2
/MJ-Fuel Paprika production (Boiler)
Kerosene 73.6 g-CO
2
/MJ-Fuel Paprika production (Boiler)
Electricity 123.1 g-CO
2
/MJ-Fuel
*
Paprika production (Ventilation and
lightning)
Fertilizer (N) 5.67 kg-CO
2
/kg Indirect CO
2
emission
Fertilizer (P
2
O
5
) 0.88 kg-CO
2
/kg Indirect CO
2
emission
Fertilizer (K
2
O) 1.85 kg-CO
2
/kg Indirect CO
2
emission
Table 7. Data of the specific CO
2
emissions.
On the energy conversion process, assuming that the 19 t/d BT plant and 4×200 kW SOFC
(BT-SOFC system) were installed, we estimated the CO
2
emission in the paprika production
system. Here, the operational condition of SOFC unit is assumed to be almost full load
operation. Also, the specification of SOFC unit is shown in Table 8.
Unit Scale [kW] 200
Number of unit - 4
Operating Temp. [°C] 900
Current density [mA/cm
2
] 612
Stoichiometric ratio - 1.25
Tafel slope [mV/dec.] 2.2
Cell Resistance [ohm] 0.52
Open Circuit Voltage [mV] 950
DC/AC converter Eff. [%] 95
Table 8. Specification of SOFC unit.
Due to the specification data in each system, the performance of BT-SOFC system is
obtained as Table 9. Also, the thermal energy supply to the facility is assumed to be due to
the heat pump (COP: 5.5).
BT Process (19t/d)
Feedstock
781.3 kg/h
10,338 MJ/h
Cold-Gas eff.(Eq.
(7))
56.2 LHV%
Auxiliary Power 127.3 kW
SOFC (4×200 kW)
Power eff.vs.
syngas
45.5 LHV%
Power eff. vs. feed 25.0 LHV%
Net eff. vs. feed 20.6 LHV%
Net power scale 590 kW
Table 9. Performance of BT-SOFC system.
Energy Paths due to Blue Tower Process
607
4.2.2 Paprika cultivation facility
In this study, we investigated the greenhouse facility at Miyagi of Japan where paprika is
brought into cultivation. In this facility, the annual product yields are around 200 t/yr. The
energy of electricity, kerosene and bunker A for lighting and a heater, and the input of CO
2
gas as a growth agent are consumed. Here, since the energy data of time series was
necessary, the boiler fuels of kerosene and/or bunker A were assumed to be in proportion to
a difference between the minimum temperature for growing and the atmospheric one. Also,
electricity was assumed to be consumed for 12 hours per a day.
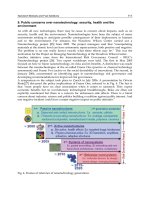
Next, the consumption of CO
2
gas as a growth agent would be analysed statistically. In a
plant such as paprika, CO
2
is consumed through photosynthesis. That is, this volume would
be proportional to the duration of bright sunshine and an intensity of radiation. Fig.11
shows the statistically estimated CO
2
consumption.
y = 23.15e
0.0009x
R² = 0.801
y = 821.36e
0.0008x
R² = 0.782
0
2,500
5,000
7,500
10,000
0 1,000 2,000 3,000 4,000 5,000 6,000
CO
2
input[kg-CO
2
]
Radiation×Duration of sunshine [Wh/m
2
]
CO2 input(Feb Jun.)
CO2 input(Jul Dec.)
Fig. 11. CO
2
supply volume as a growth agent.
On the other hand, fertilizers of N, P
2
O
5
and K
2
O only were considered, however another
chemical inputs were ignored (Dowaki et al., 2010b).
4.2.3 Specific CO
2
emission of a paprika production
Based on the above results, we estimated the CO
2
emission in conventional case and that of
BT-SOFC case (see Fig. 12). In this study, the CO
2
intensities in BT-SOFC case are included
on the uncertainties of moisture content and a transportation distance (See section 3.3.1).
In the conventional case, the specific CO
2
emission of 622.6 g-CO
2
/paprika was estimated.
On the other hand, in the BT-SOFC case, the specific CO
2
emission of 38.1 to 218.4 g-
CO
2
/paprika was analysed, and CO
2
reduction rate was 64.9% to 93.9%, respectively. Also,
since the surplus electricity of 4,137 MWh/yr would be generated through this system, the
much CO2 reduction benefit might be obtained due to the alternation with the conventional
electricity.
Biofuel's Engineering Process Technology
608
Fig. 12. Specific CO
2
emission of a paprika.
5. Conclusions
As we described before, there is a good potential to install the renewable energy system
such as a biomass energy system. In this section, we focused on the Blue Tower gasification
process. In the near future, when we consider the promotion of eco-friendly business, we
have to realize the sustainable business model which can be operated under a good cost
condition and/or a reduction of CO
2
emission. That is, we have to consider not only
technological barrier but also the CO
2
abatement effect. In this case, LCA methodology
would be reasonable and necessary. Of course, the business scheme would be extremely
significant.
In this section, we introduced two cases based on the biomass gasification system of BT
process. In both cases, for instance, if we utilize the subsidies due to the central and/or local
governments at the initial stage, or the regulation of feed-in tariff is available, the proposed
business scheme would become increasingly competitive against the conventional business
model. Also, recently, people have a great concern on the carbon-foot print based on LCA
methodology. This means that there is potentiality to purchase the product with low-carbon
emission. For the future, in order to mitigate GHG gases, we might have to consider the
suitable technological system and the effective eco-socio system.
6. References
Ministry of Economy, Trade and Industry, Japan (METI). (2007). Report on Next-Generation
Vehicle and Fuel Initiative, 11.07.2007, Available from:
www.meti.go.jp/press/20070528001/initiative-torimatome.pdf
The Ministry of Agriculture, Forestry and Fisheries, Japan (MAFF). (2006). 11.07.2007,
Available from:
Energy Paths due to Blue Tower Process
609
K.K. Gas Review. (2007). Demand and Supply for industrial gas, 2007 Gas Georama in Japan
(in Japanse)
. p.65
M .Mayer, H. J. Mühlen and C. Schmid. (2004). Blue Tower hydrogen from biomass,
European Conference on Renewable Energies and Cooperation Exchange, Vienna, Austria
H. J. Mühlen and C. Schmid. (1999). Staged Reforming-A Thermal Conversion Process
Specifically Developed for Biomass,
Proceedings 2nd Olle Lindström Symposium, pp.
75-82, Stockholm, Sweden
K. Dowaki, T. Ohta, Y. Kasahara, M. Kameyama, K. Sakawaki and S. Mori. (2007) An
Economic and Energy Analysis on Bio-hydrogen Fuel using a Gasification Process.
Renewable Energy, Vol. 32, Issue 1, pp. 80-94
M. Kameyamaa, S. Ogura, H. Kamiuchi and K. Dowaki. (2010). Performance evaluation of
1t/d scale plant through Blue Tower gasification process (in Japanese).
Journal of
Japan Society of Energy and Resources
, Vol. 31, No. 2, pp.43-50
K. Dowaki, Y. Kon, and M. Kameyama. (2008a). A Modified Design of CGS Operation or
Bio-H
2
Production through Blue Tower (BT) Process. The 8th International conference
on Eco balance
, B-07, Tokyo, Japan
K. Dowaki, M. Nakazono, M. Yamanari, M. Kameyama and H. Kamiuchi. (2011a). An
Analysis of Heat and Flow Characteristic of Heat Carrier in BT Process
(in
Japanese).
Proceedings of the 27
th
conference on energy, economy, and environment,
pp.271-274, Tokyo, Japan
K. Dowaki, H. Ishitani, R. Matsuhashi and N. Sam. (2002). A comprehensive life cycle
analysis of a biomass energy system.
Technology, Vol. 8, pp. 193–204
K. Dowaki, S. Mori, H. Abe, P. Grierson, M. Adams, N. Sam and P. Nimiago. (2003). A life
cycle analysis of a biomass energy system taking sustainable forest management
into consideration.
Proceedings of 6th International Conference on Greenhouse Gas
Control Technologies
, pp. 1383–1388, Kyoto, Japan
K. Dowaki and Y. Genchi. (2009). Life Cycle Inventory Analysis on Bio-DME and/or Bio-
MeOH products through BLUE Tower Process.
International Journal of LCA, Vol.14,
Number 7, pp.611-620
S. Hashimoto, T. Obara and Y. Terashima. (2000). Evaluation of demolition wood waste
recycling from environmental aspect (in Japanese),
Journal of environmental systems
and engineering VII
, Vol. 643, Issue VII-14, pp.37–48
Suri-Keikaku Co. Ltd. (2005). FY2004 Survey on estimation and investigation of exhaust
emission factors and their total amount (in Japanese).
K. Dowaki, T. Eguchi, R. Ohkubo and Y. Genchi (2008b) A life cycle assessment on a fuel
production through distributed biomass gasification process (in Japanese).
Transaction of the institute of Electrical Engineers of Japan C, Vol. 128, Issue 2, pp.168–
175
Infoplease. (2005). Cell Phone Usage Worldwide, by Country. 01.04.2011, Available from:
G. Hoogers. (2003). Fuel Cell Technology Handbook, In:
Portable Applications, G. Hoogers,
(Ed.), Capter 9, CRC Press LLC, ISBN 0849308771
K. Dowaki, T. Izawa and K. Sakamoto. (2010a). An analysis of CO
2
emission on the cell
phone with PEFC using Bio-H
2
fuel (in Japanese). Journal of Life Cycle Assessment,
Japan,
Vol. 6, Issue 3, pp. 259-269
Biofuel's Engineering Process Technology
610
K. Dowaki, K. Yasumoto, M. Yamanari, Y. Iwai and H. Nishiyama. (2011b). A system
analysis on the mobile device in consideration of the characteristics of cell phone
users (in Japanese).
Proceedings of The 6th meeting of the institute of Life Cycle
Assessment, Japan
, pp.170-171, Sendai, Japan
J. Kim, S. M. Lee and S. Srinivasan. (1995). Modeling of Proton Exchange Membrane Fuel
Cell Performance with an Empirical Equation.
Journal of The Electrochemical Society,
Volume 142, Issue 8, pp. 2670-2674
K. Dowaki, M. Yamanari, Y. Takada and J. Kamihirata. (2010b). An indication of a carbon-
footprint of Paprika due to the greenhouse facilities with an installation of biomass
energy system,
The 9th International conference on Eco balance, A2-1510, Tokyo, Japan
K. Dowaki, K. Fukumoto, M. Shimoguchi and M. Yamanari. (2011c). Proposals of the
agricultural products cultivation system due to Blue Tower Gasification combined-
cycle systems to reduce CO
2
emission. Proceedings of The Life Cycle Management
conference (LCM 2011)
, Submitted, Berlin, Germany
K. Kikuchi and N. Itsubo. (2009). Utility of Applying Carbon Footprint at Farmers’ Market
Aimed at Promotion of Local Production for Local Consumption (in Japanese),
Journal of Life Cycle Assessment, Japan
, Vol. 5, No. 4, 2009, pp.446-455
26
Advances in the Development
of Bioethanol: A Review
Giovanni Di Nicola
1
, Eleonora Santecchia
1
,
Giulio Santori
2
and Fabio Polonara
1
1
Dipartimento di Energetica, Università Politecnica delle Marche, Ancona
2
Università degli Studi e-Campus, Via Isimbardi 10, Novedrate (Co)
Italy
1. Introduction
Henry Ford, father of the modern automobile, constructed his Model T in the early years of
the 20th century, when he planned to fuel it with ethanol obtained from cereals. Ford
promoted the use of this fuel with such conviction that, by 1938, plants in Kansas were
already producing 18 million gallons of ethanol a year (about 54,000 t/year). But interest in
ethanol declined after the Second World War because of the enormous availability of natural
gas and oil.
At the end of the Seventies, following the first oil crisis, various oil companies began to sell a
petrol containing 10% of ethanol, called gasohol, taking advantage of the tax deductions
granted on ethanol. Bioethanol did not immediately meet with the success it deserved,
however, because it already had competitors on the market, such as methyl tert-butyl ether
(MTBE), which was better than ethyl tert-butyl ether (ETBE) in both economic terms and
performance. In subsequent years, MTBE proved to be heavily polluting, so it was banned
and bioethanol returned to become one of the most attractive prospective solutions for
reducing CO
2
emissions.
Another factor that helped to relaunch bioethanol was the growing awareness that we are
nearing the so-called tipping point, i.e. the moment commonly indicated as the critical point
of no return, when the curve of the demand for oil intersects the declining curve of its
availability.
There is an ethical issue, however, that particularly concerns bioethanol, but also affects the
other fuels of biological origin. Biofuels are obtained mainly from raw materials such as
plants and cereals, that would otherwise be destined for the foodstuffs industry.
To deal with this problem, recent research has been concentrating on an inedible perennial
herbaceous plant called Miscanthus giganteus that has a calorific value of approximately
4200 kcal/kg of dry matter. Using lignocellulose materials, municipal solid waste or the
wheat wasted each year (around 5%, which would provide about 9.3 Gl of bioethanol) could
also overcome the ethical obstacles.
Bioethanol can be used in various forms: added in proportions of 5-10% to the diesel oil in
diesel engines; mixed in proportions of 10-85% in petrol for internal combustion engines, or
to replace 0-100% of the petrol used in flexible fuel vehicles (FFV). The number of FFV on
the roads is constantly increasing: in Brazil their sales now reach 400,000 vehicles/year and
Biofuel's Engineering Process Technology
612
there are approximately 1,500,000 of them (mainly public vehicles) circulating in the USA; in
Europe, Sweden has around 15,000 vehicles of this type fueled with E85 (85% ethanol).
Research is also underway on improved engines fueled with bioethanol, and on fuel cells
that use the internal reforming of bioethanol to obtain hydrogen.
1.1 Ethyl tertiary butyl ether
Ethyl tertiary butyl ether (ETBE) is a high-octane bioethanol product obtained mainly by
making the ethanol react with isobutylene (a byproduct of oil refining) under the effect of
heat and various catalysts. It is consequently considered as being partially renewable.
ETBE has technological and functional features that are very like and distinctly better than
those of the alcohol it is obtained from. Moreover, it lacks the latter’s problems of volatility
or miscibility with petrol and it features a high octane number.
Being an ether, it contains oxygen in the molecule, and this enables it to help improve the
vehicle’s emissions of pollutants. A recent paper (Da Silva et al., 2005) conducted a study on
the effects of the anti-detonating properties and Reid vapor pressure (RVP) of petrols mixed
with various additives, concluding that adding ETBE improves the mixture’s anti-
detonating properties and reduces the vapor pressure without interfering with the volatility
needed to start a cold engine.
ETBE obtained from bioethanol (also called bioETBE) offers the same benefits as bioethanol,
i.e. a lower emission of pollutants, a higher octane number and a reduction in crude oil
imports, without the technical and logistic problems posed by the alcoholic nature of
bioethanol. BioETBE also contributes to the diffusion of biofuels in the transport sector.
1.2 Diesel and bioethanol mixtures (e-diesel)
The development and increasing use of diesel and bioethanol mixtures in diesel engines has
been driven mainly by the European countries needing to comply with the European Union
directive 2003/30/CE (which establishes that at least 5.75% of the fuels market must consist
of biofuels by the year 2010), as well as the need to dispose of a petrol surplus in the
refineries due to the greater demand for diesel vehicles. The drawbacks of the so-called e-
diesel mainly concern a reduced viscosity and lubrication issues, a lower cetane number and
injection capacity, a greater volatility (which can lead to an increase in the emissions of
uncombusted hydrocarbons) and a lesser miscibility (Marek & Evanoff, 2001; Hansen et al.,
2005; Lapuerta et al., 2007). In particular, Lapuerta et al. studied different diesel-bioethanol
mixtures in different conditions of temperature, water content and additives, developing
level maps that give a precise idea of the mixtures’ areas of stability and of kinetic
separation, that prompt the following conclusions:
the presence of water in the mixture facilitates the separation of the ethanol phase;
when its temperature increases, the mixture becomes more stable and the solubility of
the ethanol in the diesel also increases;
the mixture’s sensitivity to the effects of water content and additives is higher, the
higher the temperature of the mixture;
mixtures with a bioethanol content up to 10% (v/v) can be used in diesel engines in
regions where temperatures in winter rarely drop below -5°C;
using stability-improving additives can increase the range of ethanol proportions in the
mixtures, or the geographical extension of their applicability, enabling any phase
separation to be avoided.
Advances in the Development of Bioethanol: A Review
613
1.3 Research projects and bioethanol promotion
To succeed in demonstrating the feasibility of replacing petrol and diesel oil with
bioethanol, the European Union developed the BEST project (BioEthanol for Sustainable
Transportation) (European Union, 2011), involving six European countries (Sweden, the
Netherlands, the United Kingdom, Ireland, Spain and Italy), and also Brazil and China: the
global aims of the project are to introduce at least 10,500 FFV and 160 bioethanol-fueled
buses, as well as to build 148 service stations, 135 to provide E85 and 13 to provide E95.
The NILE project (New Improvements for Lignocellulosic Ethanol) (Eurec, 2011) focuses
instead on proposing the best processes for an economically effective production of
bioethanol from lignocellulose biomass, suitable for use in internal combustion engines. The
main goal of the NILE project is to reduce the cost of producing bioethanol from this type of
raw material so as to make the technology commercially competitive. The NILE project
brings together 21 industrial and research organizations from 11 member states, with
complementary professional backgrounds and expertise so as to cover the whole cycle of
bioethanol production and usage. On a technical level, the problems that remain to be
solved concern reducing the cost of the enzymatic hydrolysis process by developing new
artificial enzymatic systems, eliminating the current drawbacks intrinsic in converting
fermentable sugars into ethanol, and validating the artificial enzymatic systems and yeast
strains in a fully-integrated pilot plant.
Finally, there is the European LAMNET research program (Latin America Thematic
Network on Bioenergy) (LAMNET, 2011), the main aim of which is to establish a trans-
national forum to promote the sustainable use of biomass in Latin America and other
emerging countries.
2. Raw materials
One of the great merits of bioethanol consists in the enormous variety of raw materials, and
not only plants, from which it can be produced. The production methods vary depending on
whether or not the raw material is rich in fiber.
The basic materials for producing biofuels must have certain features, including high carbon
and hydrogen concentrations and low concentrations of oxygen, nitrogen and other organic
components. The following is a brief description of some of the most important raw
materials suitable for use in bioethanol production.
2.1 Alfalfa (medicago sativa)
This is a lucerne of the Fabaceae family that grows in cool subtropical and warm temperate
regions. It demands no nitrogen-based fertilizers and its leaves are a precious source of
protein in animal fodder. In a recent paper (Dien et al., 2006) it was observed that this plant
has a low glucose yield due to a low-efficiency cellulose hydrolysis. The stems contain high
concentrations of crude proteins and organic acids.
2.2 Switch grass (panicum virgatum)
This is a perennial herbaceous plant that grows mainly in the United States. Its ethanol yield
per hectare is the same as for wheat. It responds to nitrogen fertilizers and can sequester the
carbon in the soil. It is a highly versatile plant, capable of adapting easily to lean soils and
marginal farmland (Heaton et al., 2004). Like maize, it is a type C
4
plant, i.e. it makes an
alternative use of CO
2
fixation (a process forming part of photosynthesis). Most of the
Biofuel's Engineering Process Technology
614
genotypes of Panicum virgatum have short underground stems, or rhizomes, that enable
them with time to form a grassy carpet. Single hybrids of Panicum virgatum have shown a
marked potential for increasing their energy yield (Bouton, 2007), but genetic engineering
methods on this plant are still in a developmental stage and for the time being only their
tetraploid and octaploid forms are known; we also now know that similar cell types
(isotypes) reproduce easily.
2.3 Sweet sorghum (sorghum bicolor L)
The grains obtained from this plant are rich in starch and the stems have a high saccharose
content, while the leaves and bagasse have a high lignocellulose content. The plant can be
grown in both temperate and tropical countries, and it tolerates drought, flooding and
alkalinity. Sorghum is considered an excellent raw material because the methods for
growing and transporting it are well established. Ethanol can be obtained from it by
exploiting both its starch and its sugar content. Research is currently underway on the use of
hybrid or genetically modified species, although those obtained so far are weaker and need
to be further refined and tested as concerns energy conversion efficiency (Rooney et al.,
2007).
2.4 Cassava (manihoc esculenta)
This tuber is of considerable interest not only for ethanol production but also to produce
glucose syrup, and it is available in tropical countries. The ethanol yield from the whole
manioc is equivalent to the ethanol produced from cereals using dry milling methods. The
only known lies in that the manioc has to be processed 3-4 days after it was harvested. To
avoid such lengthy processing times, the manioc is first sliced and then left to dry in the sun.
The waste water produced in the process can be treated by means of anaerobic digestion to
produce bio gas.
2.5 Spruce (picea abies)
This tree has attracted a great deal of attention as a raw material for ethanol production
because it is a lignocellulose material mainly composed of hexose sugars, which are more
readily convertible than pentose sugars.
2.6 Willow (salix)
This is a member of the Angiosperm family and is consequently characterized by a hard
wood. In this species, a fraction of the xylose units is acetylated. Some of the OH groups of
the xylose carbons C
2
and C
3
are replaced by O-acetyl groups. With pretreatment, these
groups release acetic acid that, in high enough concentrations, inhibits the yeasts involved
in the fermentation process, according to some studies (Sassner et al., 2008a). It was recently
demonstrated (Sassner et al., 2008b) that, by pretreating willow with sulfuric acid before the
enzymatic hydrolysis process, and then simultaneously performing saccharification and
fermentation, they succeeded in obtaining a global ethanol yield of 79%.
2.7 Reed canary grass (phalaris arundinacea)
This is a type C
3
perennial herbaceous plant that grows in the cool season and has an excellent
resistance to flooding. Its productivity is strongly influenced by high levels of nitrogen
fertilizers, a feature that makes it very useful for the distribution of fertilizer from livestock.
Advances in the Development of Bioethanol: A Review
615
2.8 Sugar cane (saccharum officinarum)
This plant only grows well in tropical and subtropical regions, which is why it is particularly
common in Brazil. It has a 12-17% sugar content, 10% of which is glucose and the other 90% is
saccharose. Milling can extract 95% of the total sugar content and the juice can subsequently
be used to produce sugar or allowed to ferment to produce bioethanol. The bagasse (i.e. the
solid residue remaining after milling) can be used as a source of energy and heat.
2.9 Sugar beet (beta vulgaris)
This plant generally grows in the cooler temperate regions, so it is abundant in Europe,
North America and Asia. In the ethanol production process, the sugar beet is sliced and,
while the juice is used to produce sugar or ethanol, the pulp is dried and used as animal
feed or sold for pharmaceutical purposes.
2.10 Cereals
These must be ground to obtain starch, from which bioethanol is subsequently obtained.
The cereals containing fewer proteins and more carbohydrates are preferable for distilling
purposes because they have a higher bioethanol conversion rate. This means that the
nitrogen content in the cereals can be adapted to facilitate starch accumulation instead of
proteins synthesis, thereby improving both the energy yield and the quality of the
fermentation process (Rosenberg et al., 2001). The principal cereals are:
2.10.1 Wheat
It grows mainly in temperate regions. The wheat treatment process is much the same as for
the other cereals and it is best to use high-gravity fermentation to obtain the best
performance in the fermentation process.
2.10.2 Barley
The most suitable is the so-called Winter variety, which is often underestimated as a
foodstuff, despite the fact that it can tolerate drought and is highly adaptable.
2.10.3 Winter rye (secale cereale L)
This cereal relies heavily on the availability of nitrogen in the soil; it has high contents of
both glucan and xylan (40.8% and 22.3% respectively) (Petersson et al., 2007).
2.10.4 Corn stover
This is what remains on the ground after maize has been harvested. This raw material is
abundantly available and demands no further investment in biomass, although not all of the
corn stover can be removed - 30% of it must be left on the ground to prevent erosion (by
facilitating water infiltration and reducing evaporation), and as the main source of soil
organic carbon (SOC) in order to preserve the soil’s productivity. Corn stover contains
polymeric hemicellulose and cellulose, but their biodegradability by glycosidase is strongly
inhibited by a small quantity (12-15%) of lignin (Gressel, 2008; Varvel et al., 2007).
2.11 Jerusalem artichoke (helianthus tuberosus)
This plant grows in summer, reaching its maximum height in July and dying in October.
The tubers are rich in inulin (a fructose polymer), which can be used to obtain a syrup for