Energy Management Systems Part 13 potx
Bạn đang xem bản rút gọn của tài liệu. Xem và tải ngay bản đầy đủ của tài liệu tại đây (13.32 MB, 20 trang )
Energy Management Systems
228
switching the interface. The MCCP converts LQI into packet reception rate (PRR) for
comparing the interface in the same scale.
In routing, the MCCP follows not only the shortest path routing method but also a policy to
select a path which has totally the most high quality links. To increase the choices of the path
selection, the protocol is used to consider redundancy paths to a destination as much as
possible. Moreover, the MCCP adapts to the variation of topology by updating the routing
table dynamically. The network consists of a top router, routers, and end devices. The top one
not only routes data to other routers but also manages the whole network. The role of the
router is only to route data to other routers. End devices, which are sensor or actuator nodes,
send data directly to a router. One router and some end devices are connected in a star
topology and make up a subnet. Each subnet is connected with each router in a tree topology.
Each router, including the top one, has its own neighbour table, which is constructed by
exchanging hello packets with each one-hop neighbour routers. The hello packet, the
structure of the neighbour table, and their usage basically follows the TBRPF neighbour
discovery (TND) protocol (RFC 3684). The switching method, which means how to select the
interface for transmitting, uses the field of 'Metric' of the neighbour table. The neighbour
table is also used for finding out the disconnected link with the neighbour router. If a router
finds a disconnected link, it sets the link state information to its neighbour table, and
advertises the information to its routing path.
The MCCP uses a table-driven routing method. Each router in the network has its own
routing table. The routing table is constructed when the router joins the network, then it
updates its own routing table dynamically by exchanging topology update packets
periodically with its neighbour routers. When a router joins the network, it constructs a
routing table as follows. First, when the router finishes its initialization, it broadcasts a 'Top
Router Join' packet to send it to the top router by multi-hop. When the top router receives
the 'Top Router Join' packet, it broadcasts a 'Top Router Offer' packet to send it to the router
by multi-hop. At this time, the router identifies the shortest path to the top router by
counting hop counts of the 'Top Router Offer' packet. The router then sends a 'Top Router
Confirm' packet to the top router to advertise that the router could join the network. After
joining the network, routers exchange topology update packets with neighbour routers to
keep the latest link state consistent.
A network of the MCCP is able to function as an overlay network that consists of multiple
networks of different interface. With the overlay approach, user applications do not have to
factor in which interface to use when transmitting data. Moreover, as the number of
interfaces, redundant paths also increase.
4. Prototype development
4.1 Prototype hardware platform
We gradually developed various sensor/actuator nodes and several enhancement modules
to use in our proposed A-EMS. Fig. 4 shows some of the developed prototype hardware.
The ZigBee sensor node (a), the first we developed, is equipped with three sensors for
temperature, illuminance, and motion. It can be operated with 4 AAA batteries or an AC
adapter. We used Renesas Technology Co.'s MCU as the ZigBee modem module. The user
application and device driver programs are also implemented on this MCU.
The power consumption measurement module (b) is one of the enhancement modules we
developed that can be connected through the UART serial interface with a ZigBee sensor
An Adaptive Energy Management System Using Heterogeneous Sensor/Actuator Networks
229
node. We used a PIC16F877 as the MCU of this enhancement module. This module can
measure instantaneous voltage and current values at the same time with a transformer (VT)
and a current transmission (CT), respectively, as well as active power, reactive power,
apparent power, current consumption, and moment of force. The average power
consumption is calculated for the product of the instantaneous value of the measured
voltage for four cycles and the instantaneous value of the measured current. The measured
precision is within ±2% by using various loads from a low to high power factor that are then
compared with Yokogawa Electric Works, Ltd.'s WT230, which is a highly accurate power
meter.
The router node (c) consists of a main application board with a ZigBee module and a power
line communication (PLC) module. The application layer and the device driver program
manage these modules using a real-time OS, Renesas Technology Co.'s M3T-MR30/4, to
conform to the μITRON 4.0 specifications. Our connected medium-speed PLC modem
enables PLC at about 400 kbps with a frequency band of 2 to 9 MHz.
Recently, we developed power-saving, small-sized IEEE 802.15.4 sensor nodes (d) (e) (f).
They work in combination with replaceable boards such as network, living climate sensor,
IR remote control, and smart power strip boards. We used a Renesas Technology Co.'s R8C
as an MCU. These nodes can be operated with either CR2 batteries or an AC adapter. They
can also be connected to additional sensors, such as soil moisture and CO2, via I2C bus.
The sensor node (d) is equipped with four types of sensors for temperature, humidity,
illuminance, and motion. The standby power is about 37 μA and the operating power is
about 26.8 mA. If we assume intermittent operation with 10-minute intervals, 80% battery
efficiency of the 750 mA CR2 battery, and 2.7 V stable operating voltage, the sensor node
runs approximately 602 days.
The IR control node (e) has one IR receiving part and four IR emitting parts. This node,
which can record 20 IR signal patterns via the IR receiving part, is used to operate
appliances that operate via IR control, including TVs, HDD recorders, and air conditioners.
The smart power strip node (f) has the same function as the power consumption
measurement module (b). This node can remotely turn on/off connected appliances by
attaching a solid state relay (SSR) module. We used a Panasonic Electric Works Co.'s
AQA611VL as the SSR. The load current was 40 A.
Fig. 5 shows the block diagram of our developed network board. Each type of sensor node
consists of the combination of replaceable boards and it has self-networking and
communication abilities. The network infrastructure is deployed through router nodes that
can create a multi-hop network by wireless or power line communication. The system is
useful for improving network facilities in old buildings or houses that do not have enough
network cables.
4.2 Prototype implementation
We implemented a prototype system based on our design shown in Fig. 6. The left side of
the figure shows the overlay sensor/actuator network. The sink and coordinator nodes are
connected to the sensor gateway, which integrates sensing data from different sensor
networks and either stores it or passes it on to client devices or other devices equipped with
a PUCC application. To integrate multiple sensor devices, which can be of different types,
all sensing data that is not required for real-time features is stored in an integrated DB (a
PostgreSQL in this prototype). Information about the sensor device is stored in the metadata
and a table for the sensing data is created in the integrated database (DB).
Energy Management Systems
230
b) Power consumption
measurement module
a) ZigBee sensor node
e) IEEE 802.15.4
IR control node
d) IEEE 802.15.4
sensor node
f) IEEE 802.15.4
Smart power strip node
c) Router node
Fig. 4. Developed hardware platform.
・Environmental sensor
board
(Size:40x45x20)
・Smart power strip board
(Size:110x50x30)
RF Module
(IEEE802.15.4)
RTC
V
REF
MPU
(R8C)
DEBUG CN
COM CN
INT
VREF
I/O
I/O
Serial
Antenna
Size:14x53 mm
Size:40x45x15 mm
Small sized network board
A/D
I2C
Serial
Serial
Ext-CN40P
・IR remote control
board
(Size:40x45x10)
Replaceable boards
E8a
emulator
RS232C
I/F
Fig. 5. Developed hardware platform.
The actuator controller module monitors the sensing data selected by the client device and
checks if the event occurrence condition is satisfied. If the sensing data satisfies the occurrence
condition, the controller module informs the service management module. In addition, if a
sensor device that has been monitored is pulled out of the network, this module informs the
service management module that event detection has become impossible.
An Adaptive Energy Management System Using Heterogeneous Sensor/Actuator Networks
231
The actuator controller module enables composite event detection using sensing data that
belongs to a different sensor gateway. This module executes parsing, creates an event tree
for a composite event, and facilitates the monitoring of the selected sensor device. If the
sensing data satisfies the event occurrence condition, this module checks whether the value
satisfies the service execution condition based on the event tree. If it does, the service
management module is informed. If not, this module tells other sensor gateways that have
not yet satisfied the event condition that its sensor gateway satisfied the event occurrence
condition. On the other hand, if the sensor data falls outside the range of the event
occurrence condition, this module informs every sensor gateway related to the composite
event.
PostgreSQL
Web
server
Actuator
controller
Sensor gateway
Sink node
Cordinator
node
Event – Action
settings
Overlay sensor/actuator networks
Sensing data
recorder
Mobile phone
Web browser
Sensor node
-temperature
-humidity
- illuminance
-power meter
-motion
Actuator node
-IR remote
control
-power strip
60~70分
1 2 3
2
4
6
10
15
20
25
30
70~80分
1 2 3
2
4
6
10
15
20
25
30
80~90分
1 2 3
2
4
6
10
15
20
25
30
90~100分
1 2 3
2
4
6
10
15
20
25
30
100~110分
1 2 3
2
4
6
10
15
20
25
30
110~120分
1 2 3
2
4
6
10
15
20
25
30
Fig. 6. Prototype implementation.
The sensor gateway processes messages generated when a gateway communicates with
other PUCC nodes, such as a client device, through the PUCC platform. On the basis of the
sent message, the appropriate process is executed to refer to a DB table or request a
definition of services and events from the service management module.
Although the PUCC P2P nodes function as the sensor gateway and the mobile phone in this
prototype system, we can freely configure the cooperative behavior of sensors and actuators
from any mobile device. It is easy to integrate other new devices after deployment and to
develop appropriate systems for indivisuals with different lifestyles through the PUCC
platform.
4.3 Controller user interface
As shown in Fig. 7, we implemented the user interface on a client's device. In this case, we
controlled the camera based on the status of the sensor nodes. Each element in the system
works as described below. We used a Nexus One smart phone equipped with the Android
OS and installed our developed PUCC middleware. With this middleware, the user can
configure an event detected by a sensor and the service provided by a device.
The client device finds the devices by using a discovery method and generates a GUI from
the collected information. The client can then use the GUI to define the event condition
Energy Management Systems
232
(such as temperature > 30 degrees) that sensors can detect. After defining the event
condition, the user can also select a service for this condition. When the user finishes the
configuration, the middleware sends the event condition to the sensor gateway. When
sensors satisfy it, the middleware receives the notify message and then sends an invoke
message to the home appliance gateway to execute the service.
The sensor gateway has metadata, information about the device itself, and sensors collecting
data, so the client device is able to know what types of sensors are connected to the gateway.
When the gateway receives a subscribe message from other devices, it analyzes the event
condition and determines if the sensor data matches the condition. If it does, the gateway
notifies the user or other gateways with a notify method.
The home appliance gateway has metadata, information about the device itself, and a
connected appliance, so the client device is able to know what kind of service is at the
connected appliance. When this gateway receives an invoke message from other devices, it
analyzes the messages and determines which service to execute.
Start screen
Action settings
Send
subscribe
message
Select the
event you
defined
App
&
Condition1
Condition2
Event parsing module
Parse a event condition
sent from the client and
determine whether the
event has occurred.
Use event tree
Sensor gateway
Mobile phone
App
&
Condition1
Condition2
Determine whether the
event occurred based on
the event-tree generated
by this module.
Event definitions
Select each
element
(to generate an
event condition)
ex)
illuminance
> 300 lx
BRIGHT!!
Send
subscribe
message
The event occurred
Device
metadata
Service
metadata
Generate GUI based on
gateways’ metadata
Gateway
Fig. 7. Controller user interface on mobile phone.
4.4 Visualization user interfaces
We developed several Web interfaces to convert the information gathered by sensors into
user-friendly formats, as shown in Figs. 8 and 9. When a user accesses the interface to view
selected records (Fig. 8), he or she inputs the ID for the selected sensor, a start and finish
period, and the number of records requested (distributed evenly in the time period) with a
check box that can handle two or more selsections. Options include light, motion sensor,
temperature, humidity, battery power, power consumption, measured voltage, and power
factor. This sample shows the trend charts of light, motion, temperature, and power
consumption with an amChart [9] that can display the graph with JavaScript and Flash.
The volume of information from the sensors is huge, so when all the information is
downloaded for each case, the infrastructure between the Web server and the PostgreSQL
An Adaptive Energy Management System Using Heterogeneous Sensor/Actuator Networks
233
server is overloaded. To solve this problem, we implemented a function inside the
PostgreSQL server that requests only the required amount of data. The ID, term, and
amount of desired data are then transmitted to the PostgreSQL server from the Web server
PHP. The selection function gathers the requested information from the tables on the
PostgreSQL database in accordance with the timestamp and then sends it back to the PHP.
The PHP makes an XML file from the PostgreSQL data and reads it with a drawing
program.
Fig. 8. Visualization user interface for each sensor node.
Fig. 9 shows another visualization user interface for grasping an entire area. The color of
each rectangle indicates the measured temperature of each sensor node. Blue is colder and
red is hotter. The size of the center circle within each rectangle shows the activity level based
on the detection conducted every 15 minutes. The blue color of each center circle depicts the
detection of the motion sensor. The small circle on the upper left of each rectangle shows the
someone's presence or absence at each work space predicted by simple data mining. This
interface reports increasing activity as the circle gets bigger. Users can observe the living
climate at any time through the Web browser.
5. Experimental results
5.1 Experimental environment
We deployed our developed nodes in our laboratory as shown in Fig. 10. We installed 54
ZigBee sensor nodes (Fig. 4(a)) on the ceiling, ten power consumption measurement nodes
(Fig. 4(b)), six ZigBee router nodes, and a sensor gateway connected to the ZigBee
coordinator and the sink nodes. The appliances connected to the power consumption
measurement nodes included printers, a refrigerator, a microwave, an electric pot, a plasma
display, circuit breakers, and power strips. We installed two types of power consumption
measurement nodes: one for plugging appliances (Fig. 11(a)) and the other for attaching to a
Energy Management Systems
234
Date
Detected counts every
15 min
Presence or absence
Tem p er atur e
Sensor node ID
Fig. 9. Visualization user interface for grasping entire area.
circuit breaker (Fig. 11(b)). This experimental environment corresponds to the second
installation level of our A-EMS.
To evaluate the accuracy of our developed power consumption measurement node, we also
installed another electric power meter (SyoeneNavi, CK-5 and WHM3-SP01, made by
Chugoku Electrical Instruments) in the circuit breaker in room J1407.
5.2 Validation of our power consumption measurement module
We measured the accuracy of our power consumption measurement node with SyoeneNavi.
Fig. 12 shows the measured power consumption of a circuit breaker in room J1407 from
midnight to 11 p.m. on March 23, 2010. Fig. 12(a) shows the power consumption result
without any tuning. As for the transition time of power consumption, almost the same
results are obtained, though an offset average of a 17 Wh increase is caused overall
compared with SyoeneNavi. Fig. 12(b) shows subtracks of offset processing. There was a
difference from -33.6 Wh to 24 Wh at the location in which a power consumption of 400 Wh
was exceeded through measurements of SyoeneNavi. The result for power consumption of
less than 400 Wh with our developed node and SyoeneNavi were the same. It was 5,953 Wh
in our developed node and 5,876 Wh in the SyoeneNavi measurement when the entire
amount of power consumption on this day was calculated. To make the measurement equal
to SyoeneNavi, we should add the offset processing when the error margin rate based on
SyoeneNavi is within 1%.
5.3 Evaluation of detailed breakdown function of electric energy
We evaluated the function that breaks down in detail the amount of power consumption.
Fig. 13 shows a detailed breakdown of hourly electric energy for each time zone. The bar
An Adaptive Energy Management System Using Heterogeneous Sensor/Actuator Networks
235
J1401
Mizuno &
Mineno lab.
J1403
Prof. Mineno
J1405
Mizuno &
Mineno lab.
J1407
Mizuno &
Mineno lab.
J1409
Prof. Mizuno
WC
EV
Circuit breaker
Circuit breaker
Circuit breaker
1.2
1.2
0.95
2.33
1.251.9
1.2
0.95
1.9
1.2
0.95
1.9
0.8
1.2
0.95
1.9
1.9
3.3
1.9
0.95
1.17
Sensor nodes (a)
Router nodes (c)
Power consumption
measurement nodes (b)
Coordinator + sink + gateway
x2
x2
x2
x2
Appliances connected to the power consumption measurement
nodes: printers, refrigerator, microwave, electric pot, plasma
display, circuit breakers, power strips.
Fig. 10. Experimental environment in our laboratory.
(b) Power consumption measurement
node for circuit breaker
(a) Power consumption measurement
node for appliances
Power strip
Circuit breaker
Appliance
Power consumption measurement node
Power consumption measurement no de
Fig. 11. Power consumption measurement nodes.
Energy Management Systems
236
Electric energy [Wh]
Electric energy [Wh]
SyoenrNavi
Power consumption
measurement module
SyoenrNavi
Power consumption
measurement module
(a) Without any tuning.
(b) After offset processing.
[TOD]
[TOD]
Fig. 12. Validation of our developed power consumption measurement module.
graph indicates individual energy consumption of the connected appliances (refrigerator,
electric pot, power strips, etc.) to the power consumption measurement nodes. The
maximum value is the measured electric energy at the circuit breaker in room J1407.
We can see an individual's behavior such as turning on a PC, LCD, or printer, from 9 a.m.
to 6 p.m. The power consumption of the equipment connected to the power consumption
measurement nodes is indicated as part of the power strips. The other parts in
Fig. 13 show the power consumption of equipment connected to the buried outlets that
were not directly connected to the power consumption measurement node, such as a
miniature heater, the access point of a wireless LAN, two cordless handsets, a plasma
display, and so on. The data from 6 o'clock to 11 p.m. suggests that the individual's
behavior is not seen because the electric energy is lower than 190 Wh. The consumer
electronic products with the highest consumption are a refrigerator and an electric pot.
The average electric energy of the refrigerator was about 100 Wh and the electric pot was
about 62 Wh.
The result of visualizing the individual energy consumption led us to conclude
that reducing the power consumption of an electric pot is an energy-saving action, as
has been widely alleged. When nobody is using it, the power supply of an electric pot
should be unplugged and kept warm for a shorter time. Fig. 13(b) shows the effect of
energy-saving actions, such as unplugging an electric pot from 5 p.m. to 9 p.m.
The amount of power saving per month was about 29.5 KWh. This enables us to save 649
yen a month based on the charge unit price of 22 yen, the average unit price of the
nationwide electric power company. This amounts to electric bill savings of about 8,000
yen per year.
The experimental results showed that a detailed breakdown of the amount of electric energy
for each time zone can reveal the waste of power consumption in our daily life. It also gives
us the chance to think of better energy consumption habits.
An Adaptive Energy Management System Using Heterogeneous Sensor/Actuator Networks
237
Electric energy [Wh]
Electric energy [Wh]
(b) After energy-saving action on 2010/03/25.
[TOD]
Power strips
Electric pot
Others
Refrigerator
Power strips
Electric pot
Others
Refrigerator
[TOD]
(a) Without any energy-saving action on 2010/03/23.
Fig. 13. Detailed breakdown of electric energy data at circuit breaker.
6. Conclusion
We proposed an adaptive architecture for A-EMS that can control energy consumption by
maintaining a certain installation level through converged heterogeneous networks. We
developed various types of evaluation nodes and several enhancement modules to deploy
the proposed A-EMS. We also developed a prototype system that enables users to configure
a cooperative network of sensors and actuators from a mobile device. If several multi-
vendor sensors/actuators in heterogeneous networks are able to communicate with each
other, information that sensors have could be used extensively by many ubiquitous services
for a more eco-friendly lifestyle.
Experimental results for our prototype system showed that it is possible to adaptively
improve energy efficiency using the proposed A-EMS. For example in our laboratory, the
amount of power saving per month was about 29.5 KWh. This enables us to save 649 yen a
month based on the charge unit price of 22 yen, the average unit price of the nationwide
electric power company. This amounts to electric bill savings of about 8,000 yen per year.
In our future work, we plan to deploy a controlling function based on data mining to
activate installation level 3 or more. We will quantitatively evaluate the reduction in energy
consumption, and we aim to make out A-EMS a more versatile system by deploying
different types of sensors and actuators, developing device searching that uses the location
information of the device, and increasing the number of services a user can request.
Energy Management Systems
238
7. References
Cao, L.; Tian, J. & Zhang, D. (2006). Networked Remote Meter-Reading System Based on
Wireless Communication Technology, IEEE International Conference on Information
Acquisition, pp.172-176, 2006
Inoue, M.; Higuma, T.; Ito, Y. & Kubota, H. (2003). Network Architecture for Home Energy
Management System, IEEE Transactions on Consumer Electronics, Vol.49, pp.606-613, 2003
Kushiro, N.; Suzuki, S.; Nakata, M.; Takahara, H. & Inoue, M. (2003). Integrated Residential
Gateway Controller for Home Energy Management System, IEEE Transactions on
Consumer Electronics, Vol.49, No.3, pp.629-636, 2003
Zhao, P.; Suryanarayanan, S. & Simoes, M. (2010). An Energy Management System for
Building Structures Using a Multi-Agent Decision-Making Control Methodology,
Proceedings of IEEE Industry Applications Society Annual Meeting (IAS), pp.1-8, 2010
Mineno, H.; Kato, Y.; Obata, K.; Kuriyama, H.; Abe, K.; Ishikawa, N. & Mizuno, T. (2010).
Adaptive Home/Building Energy Management System Using Heterogeneous
Sensor/Actuator Networks, Proceedings of IEEE International Conference on Consumer
Communications & Networking Conference (CCNC), 2010
IEEE 1451 Standard,
Sensor Model Language, www.opengeospatial.org/standards/sensorml/
Device Kit Website, www.eclipse.org/ohf/components/soda/index.php
Chen, C. & Helal, A. (2009). Device Integration in SODA using the Device Description
Language, IEEE International Symposium on Applications and the Internet (SAINT), 2009
Peer to Peer Universal Computing Consortium,
OSGi Alliance,
Tzeng, C.; Wey, T. & Ma, S. (2008). Building a Flexible Energy Management System with
LonWorks Control Network, Proceedings of IEEE International Conference on
Intelligent Systems Design and Applications (ISDA), pp.587-593, 2008
Han, D. & Lim, J. (2010). Smart home energy management sytem using IEEE 802.15.4 and
ZigBee, IEEE Transactios on Consumer Electronics, Vol.56, No.3, pp.1403-1410, 2010
Park, H; Burke, J. & Srivastava, M. (2007). Design and Implementation of a Wireless Sensor
Network for Intelligent Light Control, Proceedings of IEEE International Conference on
Information and Processing in Sensor Networks (IPSN), pp.370-379, 2007
Son, Y.; Pulkkinen, T.; Moon, K. & Kim, C. (2010). Home Energy Management System based
on Power Line Communication, IEEE Transactions on Consumer Electronics, Vol.56,
No.3, pp.1380-1386, 2010
Suh, C. & Ko, Y. (2008). Design and Implementation of Intelligent Home Control Systems
based on Active Sensor Networks, IEEE Transactinos on Consumer Electronics, Vol.54,
No.3, pp.1177-1184, 2008
Chen, C. & Helal, A. (2008). Sifting through the Jungle of Sensor Standards, IEEE Pervasive
Computing Magazine, Vol.7, No.4, 2008
Kato, Y.; Ito, T.; Kamiya, H.; Ogura, M.; Mineno, H.; Ishikawa, N. & Mizuno, T. (2009).
Home Appliance Control Using Heterogeneous Sensor Networks, Proceedings of
IEEE Consumer Communications & Networking Conference (CCNC), 2009
Sawada, H.; Kuriyama, H.; Nakano, Y.; Mineno, H. & Mizuno, T. (2011). Mutually
Complementary Communication Protocol for Indoor Sensor/Actuator Networks,
Proceedings of IEEE/IPSJ Internationa Symposium on Applications and the Internet
(SAINT), 2011
Ogier, R.; Templin, F. & Lewis, M. (2004). Topology Dissemination Based on Reverse-Path
Forwarding (TBRPF), RFC 3684, 2004
12
Smart Grid and Dynamic Power Management
Dave Hardin
EnerNOC, Inc.
USA
1. Introduction
Historically, energy has been relatively inexpensive. Efforts to manage the efficient use of
electrical energy have been of secondary importance and often limited to initial architectural
and design considerations. Inexpensive and widely-available energy has led to
unprecedented economic growth but the costs and risks are increasing: the costs of fossil
fuels, the costs to the environment, and the risks to foreign supplies.
With the passage of the Energy Independence and Security Act of 2007, the United States
embarked on a path to modernize the electrical grid as described in Title XIII – Smart Grid.
(US Title XIII, 2007) This modernization is transforming how energy is generated,
transmitted, distributed and consumed in residential, commercial and industrial facilities
but it is not changing the basic electrical constraints of the system.
Electrical supply and demand must remain in balance at all times. This balance has
traditionally been attained through dispatching generation and day-ahead scheduling along
with sufficient capacity reserves. Temporal load change typically follows a macro pattern
based on diurnal or daily variation. Power usage increases during the day and decreases at
night. It is this cycle, or load curve, which drives modern grid operations. Sufficient reserve
capacity is required to meet any demand peaks. Generation failures and circuit trips also
require that reserves be brought on-line. When, for any reason, supply does not equal
demand, the grid can collapse resulting in a blackout.
2. What is Smart Grid
The U.S. Energy Independence and Security Act of 2007, TitleXIII and the NIST (National
Institute of Standards and Technology) Smart Grid Framework (SG Roadmap, 2010)
describe the goals and objectives of Smart Grid. EISA Title XIII defines the following
characteristics of Smart Grid:
1. “Increased use of digital information and controls technology to improve reliability,
security, and efficiency of the electric grid.
2. Dynamic optimization of grid operations and resources, with full cyber-security.
3. Deployment and integration of distributed resources and generation, including
renewable resources.
4. Development and incorporation of demand response, demand-side resources, and
energy-efficiency resources.
Energy Management Systems
240
5. Deployment of `smart' technologies (real-time, automated, interactive technologies that
optimize the physical operation of appliances and consumer devices) for metering,
communications concerning grid operations and status, and distribution automation.
6. Integration of `smart' appliances and consumer devices.
7. Deployment and integration of advanced electricity storage and peak-shaving
technologies, including plug-in electric and hybrid electric vehicles, and thermal-
storage air conditioning.
8. Provision to consumers of timely information and control options.
9. Development of standards for communication and interoperability of appliances and
equipment connected to the electric grid, including the infrastructure serving the grid.
10. Identification and lowering of unreasonable or unnecessary barriers to adoption of
smart grid technologies, practices, and services.”
FERC (Federal Electricity Regulatory Commission) outlined the top eight (8) U.S. National
Smart Grid priorities as:
“Wide-area situational awareness: Monitoring and display of power-system components and
performance across interconnections and over large geographic areas in near real time.
Demand response and consumer energy efficiency: Mechanisms and incentives for utilities, business,
industrial, and residential customers to cut energy use during times of peak demand or when power
reliability is at risk.
Energy storage: Means of storing energy, directly or indirectly.
Electric transportation: Refers, primarily, to enabling large-scale integration of plug-in electric
vehicles (PEVs).
Cyber security: Encompasses measures to ensure the confidentiality, integrity and availability of the
electronic information communication systems and the control systems necessary for the
management, operation, and protection of the Smart Grid’s energy, information technology, and
telecommunications infrastructures.
Network communications: The Smart Grid domains and subdomains will use a variety of public and
private communication networks, both wired and wireless.
Advanced metering infrastructure (AMI): Currently, utilities are focusing on developing AMI to
implement residential demand response and to serve as the chief mechanism for implementing
dynamic pricing.
Distribution grid management: Focuses on maximizing performance of feeders, transformers, and
other components of networked distribution systems and integrating with transmission systems and
customer operations.”
The U.S. NIST and the Smart Grid Interoperability Panel (SGIP) created the Smart Grid
Conceptual Model (SGIP CM, 2010) which describes the seven (7) primary domains that
comprise Smart Grid: Bulk Generation, Transmission, Distribution, Customer, Markets,
Operations and Service Provider. (See Figure 1)
“The Smart Grid Conceptual Model is a set of views (diagrams) and descriptions that are the
basis for discussing the characteristics, uses, behavior, interfaces, requirements and
standards of the Smart Grid.“ (SGIP CM, 2010)
The two domains with the greatest direct impact on the electrical supply chain are the
customer (See Figure 2) and bulk generation (See Figure 3) domains as they form the core
drivers for change in the electrical system.
The other domains will, in general, need to adapt to the changes in these two domains but
all domains are interconnected and therefore affect each other. Changes occurring in the
wholesale and retail markets will directly impact other domains. New services and service
Smart Grid and Dynamic Power Management
241
Fig. 1. Smart Grid Conceptual Model
Fig. 2. Customer
Energy Management Systems
242
Fig. 3. Bulk Generation
providers will enable new capabilities which will be consumed by other domains. The
operations domain integrates and balances network resources with the objective of
achieving safe, secure and reliable real-time operations of the power system.
The bulk generation domain is categorized into: 1) non-renewable, non-variable, 2)
renewable, non-variable and 3) renewable, variable generation. The first two categories
represent traditional generation that can be dispatched when needed. The third category
represents a new challenge for the grid.
Within the bulk generation domain, large quantities of renewable generation need to be
integrated into the grid. The ideal generation would be in the form of renewable, non-
variable. This would permit the generation source to be dispatched by the regional
balancing authority. Renewable, variable generation such as wind and solar require fast-
responding reserve generation such as spinning reserves or natural gas turbines to take over
when the wind stops blowing or the sun becomes blocked by clouds. This requirement adds
significant costs and impedes the growth of variable renewables, even if the occurances are
rare. Renewable generation on the grid currently amounts to 4% of the overall generation.
The goal of increasing this to 30% will result in a grid that has significantly more variability
than the current grid. Could a more cost effective and reliable approach include bringing
customer energy curtailment resources into the feedback loop through the use of
dispatchable high-performance demand response?
3. Smart Grid feedback loops
Bringing the customer further and further into the energy loop is an important facet of
Smart Grid development that requires more analysis.
Smart Grid and Dynamic Power Management
243
Fig. 4. Balancing Feedback Loop
Smart Grid is a system of systems tied together with large, wide-area feedback loops. These
feedback loops constitute the basic behavioral operating unit of a system of systems.
(Meadows, 2008) They can bring either stability or instability to the system. They can create
growth or shrinkage of the system.
Feedback loops return an amplified portion of the output signal back around to the input
where it either adds or subtracts from the input signal. This simple basic structure forms the
foundation for automatic control theory which is widely applied within a number of
domains including manufacturing automation, aircraft control and automotive systems.
If the fedback signal tends to subtract from, or offset, the input signal and decrease the
output, it is a negative or balancing feedback loop. If the fedback signal adds to the input
signal, it is a positive or reinforcing loop. The system and feedback loop have transfer
functions, usually expressed in terms of Laplace transforms, which relate the output signal
to the input signal. The behavior of the loop when any given input signal is applied can then
be determined. The transfer function has solutions called poles and zeros under which it
either drives the loop toward oscillation or becomes zero. Both conditions have negative
impact if the loop is a balancing loop.
An example of a simple on/off balancing loop is the home thermostat. The desired balance
point is the temperature setpoint. The feedback signal is the room temperature. When the
room temperature reaches the setpoint temperature the heater is turned off until the
temperature decreases below the setpoint. This digital loop inherently oscillates and relies
upon the high capacity and slow response of the room and heating system to achieve
acceptable results.
Reinforcing feedback loops amplify the output by building upon themselves resulting in
exponential growth or collapse. The rate of growth is determined by the amount of feedback
or gain.
An example of a simple reinforcing loop is compound interest where the interest earned on
a financial account is fedback into the account resulting in the exponential growth of the
account value over time.
A fundamental property of feedback loops is that they have a propensity to oscillate. This
oscillation is caused by loop time-delays, or deadtime, that lead to the phase-shifting of
feedback signals. If the resulting phase-shift is equal to 180 degrees, then a negative
feedback signal turns into a positive feedback signal. This causes balancing loops to become
Energy Management Systems
244
reinforcing loops and if the strength of the feedback is sufficient (i.e. product of loop gains
>= 1.0) , they become unstable and oscillate. Sufficient upfront system design is required so
that this condition does not arise. (Shinskey, 1979)
Fig. 5. Dynamic Power Feedback Loop
Fig. 6. Simplified Renewable Generation Demand Response Loop Diagram
Smart Grid and Dynamic Power Management
245
Complex systems of systems are affected by large numbers of interacting feedback loops.
Some of these loops have little effect on overall system behaviour while other loops can
dominate system behaviour. In this context, an important and dominant smart grid
feedback loop is the one that connects variable, renewable generation, such as wind and
solar energy, with the power consumption of the customer. This loop is shown in Figure 5.
The balancing authority has the responsibility to maintain the electrical grid in balance at all
times with the power supply equal to the power demand. As power from wind and solar
generation is fed onto the grid, the balancing authority only has the ability to dispatch a
decrease in renewable generation by disconnecting it from the grid but not the ability to
increase its power output. Compounding this issue is the power variability due to wind and
solar fluctuations. This is in contrast to traditional grid operations which typically vary over
a 24-hour period with reserve generation capacity being brought online or taken offline
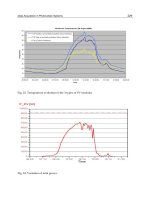
based on demand load. PJM studies have shown significant impact on the bulk electrical
system due to wind variability with a corresponding impact on the LMP (locational
marginal pricing) wholesale energy price. (See Figure 7)
Source: PJM
Fig. 7. Wind Variability
The balancing authority can compensate for this variability by dispatching fast-responding
generation, adding sufficient power storage capacity and fast ramp-down of customer load.
All of these options however have an associated cost and response time. (Hirst & Kirby,
2003) Fast-responding generation in the form of spinning reserves or natural gas turbines
are effective but very costly. Bulk storage represents a very good solution in theory but
economical grid-scale storage systems are still being developed. Reducing customer load
through energy demand response represents a solution that has already been proven
successful in its ability to provide the dispatchable curtailment of large quantities of power
but its use as a high-speed compensator for renewable variability represents an area of
growth and opportunity. (Kalisch, 2010)
The feedback system consisting of renewable generation, a balancing authority, utilities,
service providers and customers can be described by a simplified renewable generation
Energy Management Systems
246
demand response feedback loop diagram, Figure 6. This loop does not include fast-response
generation or power storage elements.
The demand response loop is being driven by the uncontrolled renewable generation signal.
If the renewable generation decreases, then the signal to the loop calls for a decrease in
customer demand. The signal then propagates through several control and time-delay
elements before aggregated customer power ramp down occurs. The feedback signal
provides near real-time information including state and status data along with the actual
power curtailment. Based on this information, the loop balances the curtailment with the
generation. In order to remain stable and not oscillate, the loop needs to respond faster than
the renewable generation driving signal.
This is very similar to industrial supervisory setpoint control. Supervisory control often
utilizes a cascade loop consisting of a primary outer-loop which sends a setpoint signal to a
secondary inner loop. The inner loop has faster response dynamics than the outer loop
allowing it to track changes in the supervisory setpoint without becoming unstable and
oscillating. Many considerations, such as loop windup, need to be taken into account due to
the interactions between these two loops. (Skinskey, 1979)
The importance of inner loop response time means that the time-delays and latencies within
a demand response loop need to be minimized as much as possible so that the overall loop
response can be minimized. This includes both communication latencies and process delays.
Applying this concept to demand response for renewable energy, the resulting loop
dynamics determine how fast and effective the demand response loop will be in
compensating for variations in renewable generation. The faster the loop response, the more
effective demand response will be in mitigating real-time variance in renewable generation.
One of the primary elements that contributes time-delays is customer load response.
4. Customer load response
Customer demand response can be characterized by the magnitude and speed of load
response. This applies to both dynamic pricing and demand response event signalling. Four
categories have been identified for classifying demand response performance. Each
category, described below, will have different feedback loop dynamics and will affect the
customer in different ways. Systems with large energy storage capacity are ideal for demand
response applications in all categories listed.
Category 1: soft demand response
The response time required in soft demand response is often flexible and can vary from
hours to days. Soft demand response events are targeted at the daily power consumption
macro cycle which is driven by higher usage during the day followed by lower usage during
the night. Energy curtailment can typically be planned and scheduled in advance.
Load response strategies include both load shedding as well as load shifting. Load shedding
involves curtailing equipment that is not mission critical and load shifting is the
rescheduling of energy-intensive operations to a different time period. This includes
production lines and processing equipment.
Equipment typically curtailed includes:
1. External and internal lighting including parking lot lighting
2. External water fixtures
3. Air handlers