Environmental Monitoring Part 13 potx
Bạn đang xem bản rút gọn của tài liệu. Xem và tải ngay bản đầy đủ của tài liệu tại đây (896.74 KB, 35 trang )
23
ICT for Water Efficiency
Philippe Gourbesville
Nice Sophia Antipolis University / Polytech Nice Sophia,
France
1. Introduction
Global change poses unprecedented threats to society through impacts on both the natural
environment and engineered infrastructure. Specifically, growing global population
requires urban and infrastructure development at the same time as global warming
demands massive investment in measures for both adaptation to future climate and
mitigation through reduced emissions. The water sector is at the heart of this 21
st
century
challenge, and the need of the hour is to have a major revision of our approaches and
implementation of technology for the management of water resources, flood risk and
pollution.
As mentioned recently by the Water Supply and Sanitation Technology Platform (2005) –
WSSTP - representing all the European water sector actors, “water supply, storm-water
drainage, wastewater collection and treatment, as well as quality and quantity management
of natural water resources need to be efficiently secured or, where necessary, improved.
Only through a paradigm shift from fragmented towards integrated urban water
management economic development, social balance and ecological integrity can be secured.
[ ] During the last three decades the European water industry has built up a great
competitive strength based on innovative supply and sanitation concepts, technology,
knowledge and skills; availability of financial resources; wide experience in many industrial
sectors; close cooperation with European R&D organisations and universities, including
active involvement in R&D projects in the various European Union R&D Framework
Programmes; expanding markets in the European Union and outside; European Union
policy on sustainability, environment and energy; a broad spectrum of efficient
governmental structures, tailored to specific local needs. The three largest companies
providing water supply and sanitation services in the world are European. In addition, a
large number of European Small & Medium Enterprise’s (SME’s) export their expertise and
equipment across the world. Several European firms and institutes have prominent
positions in the open market for major water and sanitation studies and implementations.
The European water sector is a major economic player - 1% of GDP - with a turnover in the
European Union of about 80 billion Euro and an average growth rate of 5% per year,
compared to 2.5% per year average growth rate for the European Union economy.”
The diagnostic provided by the profession at the European level and with the support of the
WSSTP mentions that sustainable approaches for the development of water projects are
needed to deliver social, economic and environmental benefits. These demands are pressing
issues in the new European Member States, and in developed and developing countries
outside Europe. Technologies need to be properly integrated with social, economic and
Environmental Monitoring
412
organisational measures. Until now a sectoral approach in water resources management has
been dominating and is still prevailing. Many actors are not fully integrated, and many
stakeholders remain uninvolved. This has led to fragmented and un-coordinated
implementation of policies and technologies, and often leads to inefficient or even
unsustainable solutions. To achieve sustainability, Europe, as all countries, has to apply an
integrated and participatory approach for water resource management. The water industry
is too slow in studying and eventually adopting new technologies. The World Water
Council (2009) states: "Without major technological innovations there is little hope of
bringing the water equation into balance. There is no doubt that many technological changes
can help improve services for millions and reduce the stress on water systems around the
world.”
To remain in the forefront of this competitive business, innovative skills are essential. The
knowledge and experience in water supply and sanitation that is available for example in
Europe is dispersed across a large number of small utilities and enterprises. Although not
directly visible to the outside world, a considerable body of knowledge has been developed
in designing and optimising water infrastructure and management systems over the past
150 years. This diversity of solutions adapted to local conditions in Europe is quite valuable
assets in the world market. The energies of all actors in the sector must be combined to
merge the dispersed knowledge and expertise and use it to enhance the competitiveness of
the water sector.
The challenges faced by the water sector in Europe and worldwide are serious and well-
documented. Future water shortages require immediate action on development of
resources, reduction of demand and higher efficiency in treatment and transmission. Future
flood risk management requires immediate action in risk assessment, defence and
alleviation systems, forecasting and warning systems and institutional and governance
measures. Such development requires considerable investment in research from
governments and large corporations and this is now becoming apparent in many countries.
The challenge is made even more difficult, however, by the requirement for solutions to be
sustainable and moving towards a “low carbon economy” which are also increasingly being
stipulated by government and European Union Directives. For example, the drive for higher
reliability in water resource is therefore accompanied by a drive for reductions in cost,
emissions, ecological and environmental impacts.
Technology has been revolutionised over recent years and now, matured with mass
production allowing wider uptake of methods and devices (Gourbesville, 2009). After the
development phase, technology is now entering an application and implementation phase
which is targeting several fields including environment. A relevant example is given by the
European Union who has defined a major priority for the next 20 years on “ICT for
sustainable growth” with the ambition to lead innovation at the worldwide scale. In such
context, ICT refers to technologies that provide access to information through
telecommunications. It is similar to Information Technology (IT), but focuses primarily on
communication technologies. This includes the Internet, wireless networks, cell phones, and
other communication mediums. As defined by the European Commission, improving the
quality of life should not damage the environment for future generations. Achieving
sustainable growth requires better management of all natural resources, from energy to
water and ICT - Information and Communication Technologies - can enable this far more
efficiently (Holz, 2004), so improving environmental protection without holding back
economic development.
ICT for Water Efficiency
413
Key concerns are the impact of climate change and the inefficient use (or over-use) of
natural resources, such as drinking water and energy supplies. However, in order to achieve
these objectives, the European Commission focuses its efforts on several specific areas such
as Energy Efficient Buildings, Smart Electricity Grids and Smart Metering, Freight, Logistic
and Transport, Greener ICT, Water Management. In this last domain, the European Union
wishes to recognize the added value of ICT solutions and to support their implementation
in the water domain by elaborating, validating and disseminating recommendations,
guidelines and specifications on specific technologies and uses. This strategy is duplicated at
the international level with the priorities of the National Science Foundation (NSF) in USA
and the Green Growth project developed in South Korea.
If the diagnostic is now shared globally, it request coordinated efforts in order to implement
the various ICT solution into the water sector. This sector is complex and requires a careful
analysis able to underline needs and to identify the added value provided by ICT solutions
according to a realistic roadmap for implementation.
2. Methodology for assessing priorities
Obviously, in the coming years the new technologies from the IT sector will affect the full
water cycle and the management of the water related services. This process represents a
major challenge for the 21
st
century. However, the impact of these new technologies –
from sensors to Decision Support Systems - could be stronger and really significant if
priorities are properly defined and implemented within the R&D strategies. The main
driver of the strategy has to be to achieve a comprehensive architecture of an Information
System (IS) dedicated to water uses and connected to others systems involved in human
activities.
By definition, Information systems are implemented within an organization for the purpose
of improving the effectiveness and efficiency of that organization (Silver, 1995). Capabilities
of the IS and characteristics of the organization, its work systems, its people, and its
development and implementation methodologies together determine the extent to which
that purpose is achieved. The IS is associated to an architecture which provides a formal
definition of the business processes and rules, systems structure, technical framework, and
product technologies for a business or organizational information system.
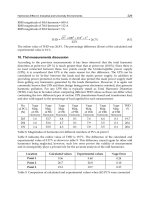
Fig. 1. General methodology for development of ICT solutions in the water sector.
In order to elaborate a specific IS for the management of the water cycle, a methodology is
needed for identifying priorities and strategic investments to do in the ICT domain. The
Water cycle
1 - Water domains identification
2 - Invariant activities identification
3 - Business processes description & analysis
4 - Identification of needs in ICT solutions
Environmental Monitoring
414
requested approach has to investigate all domains and provide a map of the various process
taking places in the different domains of the water uses cycle. This formalization exercise,
using mainly concepts and processes, is now requested in order to ensure the coherence of
technical choices in a holistic approach.
The methodology has to start from the water cycle, to identify the various water domains
and the associated activities. The activities can be then defined with business processes
which can be analysed regarding the need of ICT solutions. The proposed methodology is
summarized on the Figure 1.
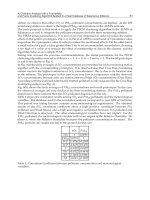
2.1 Domains of the water cycle
The water cycle is frequently defined as the hydrologic cycle which describes the continuous
movement of water on, above and below the surface of the Earth. The hydrologic cycle
involves the exchange of heat energy, which leads to temperature changes and drives states
of water. The water cycle figures significantly in the maintenance of life and ecosystems.
Fig. 2. Domains of water cycle.
In order to preserve this essential resource, the concept of Integrated Water Resources
Management (IWRM) has been developed (Jønch-Clausen T. & Global Water Partnership
(GWP), 2004). The purpose of the approach is to “promotes the coordinated development
and management of water, land and related resources, in order to maximize the resultant
economic and social welfare in an equitable manner without compromising the
sustainability of vital ecosystems." Operationally, IWRM approaches involve applying
knowledge from various disciplines as well as the insights from diverse stakeholders to
devise and implement efficient, equitable and sustainable solutions to water and
development problems. As such, IWRM is a comprehensive, participatory planning and
implementation tool for managing and developing water resources in a way that balances
social and economic needs, and that ensures the protection of ecosystems for future
Water
cycle
Protection of
natural
environment
Water uses
Natural
hazards
mitigation
ICT for Water Efficiency
415
generations. In such approach, ICT solutions can play a key role but focus has to be given to
the most demanding and relevant domains of the water cycle.
In order to identify which and how ICT solutions can be implemented, it is necessary to look
at the water cycle through an approach based on functional domains and business
processes. This methodology allows considering each action involved into the resource
management and identifying the potential needs of ICT.
The water cycle can be divided in three domains which are associated to specific activities
and business processes:
Protection of natural environment and ecosystems;
Natural hazards mitigation and disaster prevention;
Water uses.
The first domain considers all actions needed to assess and advice on the environmental
impacts of development proposals and projects related to specific water uses. Results are
used by regulatory services. The domain covers also all conservation actions of water related
ecosystems.
The second domain is focused on water related natural hazards mitigation actions. Floods,
water-borne and vector disease outbreaks, droughts, landslide and avalanche events and
famine are the processes covered by this domain. Every year, disasters related to
meteorological, hydrological and climate hazards cause significant loss of life, and set back
economic and social development by years. The disaster is defined as a serious disruption of
the functioning of a community or a society causing widespread human, material, economic
and/or environmental losses.
The last domain covers the added influence of human activity on the water cycle. Generally,
the water uses refer to use of water by agriculture, industry, energy production and
households, including in—stream uses such as fishing, recreation, transportation and waste
disposal. All of those uses are directly linked to specific activities and processes which are
potential targets for deployment of ICT solutions. In order to stick to the reality oft he water
management operated by entities in charge of water services, the traditional classification
can be reviewed. The main water uses appear then as: agriculture, aquaculture, industry,
recreation, transport/navigation, and urban.
2.2 Water uses, activities and business processes
According to the defined water domains, the water uses represent the largest field where
ICT solutions can be developed and implemented. The various uses may be classified and
defined as follow.
Agriculture: Irrigation water use is water artificially applied to farm, orchard, pasture,
and horticultural crops, as well as water used to irrigate pastures, for frost and freeze
protection, chemical application, crop cooling, harvesting, and for the leaching of salts
from the crop root zone. In fact, irrigation is the largest category of water use
worldwide.
Aquaculture: Aquaculture is the farming of aquatic organisms including fish, molluscs,
crustaceans and aquatic plants. Farming implies some sort of intervention in the rearing
process to enhance production, such as regular stocking, feeding, protection from
predators and so forth. It also implies individual or corporate ownership of the stock
being cultivated. This activity uses part of the water bodies in order to develop
activities.
Environmental Monitoring
416
Industry: This water use is a valuable resource for such purposes as processing,
cleaning, transportation, dilution, and cooling in manufacturing facilities. Major water-
using industries include steel, chemical, paper, and petroleum refining. Industries often
reuse the same water over and over for more than one purpose.
Recreation: It often involves some degree of exercise as well as visiting areas that
contain bodies of water such as parks, wildlife refuges, wilderness areas, public fishing
areas, and water parks. Some of the activities that imply the uses of water for this
purpose are: fishing, boating, sailing, canoeing, rafting, and swimming, as well as many
other recreational activities that depend on water. Recreational usage is usually non-
consumptive; however recreational irrigation such as gardening or irrigation of golf
courses belongs to this category of water use. Besides, recreation and tourism represent
a growing sector for industry at the worldwide scale.
Energy: Derived from the force or energy of moving water, which may be harnessed for
useful purposes, such as Energy production. There are several forms of water power
currently in use or development. Some are purely mechanical but many primarily
generate electricity. Broad categories include: conventional hydroelectric (hydroelectric
dams), run-of-the-river hydroelectricity, pumped-storage hydro- electricity and tidal
power.
Transport/navigation: It refers to the transport of goods or people using water as a
means of transportation. This water use refers only to commercial transport, since
recreational transports such as sailing is considered above in Recreation water use.
Urban: Urban water use is generally determined by population, its geographic
location, and the percentage of water used in a community by residences,
government, and commercial enterprises. It also includes water that cannot be
accounted for because of distribution system losses, fire protection, or unauthorized
uses. For the past two decades, urban per capita water use has levelled off, or has
been increasing. The implementation of local water conservation programs and
current housing development trends, have actually lowered per capita water use.
However, gross urban water demands continue to grow because of significant
population increases and the establishment of urban centres. Even with the
implementation of aggressive water conservation programs, urban water demand is
expected to grow in conjunction with increases in population. The urban environment
is associated to a high dynamic which implies a growing complexity related to
number of inhabitants and management of water resources in order to fulfil the needs
of population.
The water uses are associated to business processes and are linked to economical and social
values. In most of the cases, five major activities are taking place within each water use and
appear as invariants. These key activities are: Investigating /surveying, observing /
monitoring, designing, building and decommissioning, operating. Each activity could be
defined.
Investigating/surveying: Consists in the gathering of information of the previous and
actual state and/or working of the domain in study. This assembly of information can
be done either by a systematic collection of field data (survey) or a collection of
information or data from a methodical research of available documents and/or the
production of new ones in order to understand or to improve the actual state of the
domain.
ICT for Water Efficiency
417
Observing/monitoring: From a general point of view, this activity refers to be aware of
the state of a system. It describes the processes and activities that need to take place to
characterise and monitor the quality and/or state of the domain in study. All
monitoring strategies and programmes have reasons and justifications which are often
designed to establish the current status of the domain or to establish trends in its
parameters. In all cases the results of monitoring will be reviewed and analysed. The
design of a monitoring programme must therefore have regard to the final use of the
data before monitoring starts.
Designing (including risk assessment): Refers to the process of devising a system,
component, or process to meet desired needs. It is a decision making process (often
iterative) in which the basic sciences, risk assessment and engineering sciences are
applied to convert resources optimally to meet a stated objective. Among the
fundamental elements of the design process are the establishment of objectives and
criteria, synthesis, analysis, construction, testing and evaluation. In order to obtain a
design that achieves the desired needs for the domain in study, the two previous steps
should have been accomplished and taken into account.
Building & decommissioning: Consists in carrying out the proposed solution (design)
for the domain. In order to execute this design, construction and/or decommission
activities may be executed. It is essential a minimal environmental impact when
accomplishing these activities. The tolerable environmental impact will be obtained
from the risk assessment of the designing step.
Operating: It refers to the action of manoeuvring a system. It may include the
combination of all technical and corresponding administrative, managerial, and
supervision actions. Operation may also include performing routine actions which keep
the system in working order. This latest actions might turn out as response of problems
detected during monitoring.
Fig. 3. Invariant activities taking place in the various domains and water uses.
Investigating /
Surveying
Observing /
Monitoring
Designing
Building &
Decommissioning
Operating
Environmental Monitoring
418
The final step of the approach is dedicated to the identification of the various business
processes which are taking place in each activity. A business process is defined as a
collection of related, structured activities or tasks that produce a specific service or product
(serve a particular goal) for a particular customer or customers. It implies a strong emphasis
on how the work is done within an organization, in contrast to a product's focus on what. A
process is thus a specific ordering of work activities across time and place, with a beginning,
an end, and clearly defined inputs and outputs: a structure for action. Some processes result
in a product or service that is received by an organization's external customer. These are
called primary processes. Other processes produce products that are invisible to the external
customer but essential to the effective management of the business. These ones are called
support processes. In keywords, a business process has a goal, has specific inputs and
specific outputs, uses resources, has a number of activities that are performed in some order,
may affect more than one organizational unit - horizontal organizational impact - and
creates value of some kind for the customer. An example of a business process for a water
utility can be meter reading. It has to be done in concordance of the billing period. The goal
of this process is to give inputs to the billing department, and see the progress of the
customer’s consumption. Depending on the technology used for the metering (smart or
manual metering), different resources (technology, personnel) are used.
The uses in urban environment, carried out by water utilities, can be defined with a limited
number of business processes – 29 in total - summarized into the table 1 and which are
covering drinking water, waste water and storm water management. The final step of the
approach is then to identify for each business process how ICT solutions can be
implemented and provide added value. This diagnostic has to be shared by professionals
and operators in order to ensure a coherent deployment. This validation process can be
made through an associative body gathering representatives from all involved sectors.
1 - Asset management
16 - Water primar
y
network mana
g
ement
and water balance
2 - Crisis mana
g
ement 17 - Water secondar
y
network mana
g
ement
3 - Field intervention mana
g
ement 18 - Leak detectio
n
4 - Field works 19 - Meter readin
g
(AMR & MMR)
5 - Use of GIS 20 - AMR & MMR mana
g
ement
6 - Maintenance of GIS 21 - Public service contract mana
g
ement
7 - Mana
g
ement of plant maintenance 22 - Waste water network mana
g
ement
8 - Electro mechanical maintenance 23 - Storm water network mana
g
ement
9 - Laboratory activity and quality control
24 - Waste water treatment plant
management
10 - Automation & sensors 25 - Sewer inspection and sewer cleanin
g
11 - Real time network mana
g
ement 26 - Billin
g
12 - Plannin
g
and desi
g
n of new assets and
plants
27 - Customer care & communication
13 - Water resources mana
g
ement 28 - Innovation & pilots
14 - Environment mana
g
ement 29 - Supports
15 - Drinkin
g
water treatment plant
management
Table 1. Business processes for urban uses.
ICT for Water Efficiency
419
3. The @qua approach
The European Union has defined a key objective for his industrial development on
interoperability of systems. This approach is dedicated to various domain including
environment and water. In order to support this vision, the European Commission has
launched a Thematic Network called @qua under the CIP-ICT PSP Programme. The ICT
Policy Support Programme (ICT PSP) under the Competitiveness and Innovation
Programme (CIP) aims at stimulating innovation and competitiveness through the wider
uptake and best use of ICT by citizens, governments and businesses, particularly Small and
Medium-sized Enterprises (SMEs). The approach is based on leveraging innovation in
response to growing societal demands.
In his programme frame of ICT Policy Support Programme (ICT PSP) 2011, the General
Direction Information Society (DG INFSO) of the European Commission has launched a
new theme network dedicated to Innovation Communication Technologies for water
management. This domain represents a sector which the European Union wishes to develop
during the next 10 years and it’s contemplated in different initiatives of the Digital Agenda
for Europe 2020 which will allow at the same time improving the user’s services quality and
developing a sustainable management of resources. These objectives will be achieved with
the improvement of already available technologies, adaptation of the existing solutions and
the identification of R&D axes to work on the next years.
@qua Innovation Network (), founded by 17 partners and managed
by Nice Sophia Antipolis University gathers thus ICT and water services leading actors
from SME to majors, research entities developing competences in both sectors, local and
regional authorities directly responsible for water policy and water management. Partners
have developed significant expertise about the interface of ICT and water and at the same
time, covering the full spectrum of the water related domain. @qua provides a forum to
exchange and to share expertise in deploying innovative ICT solutions for water
management, studies feasibility of standardized ICT solutions and interoperability in the
field of water management across the EU and develops specifications and guidelines
according to a jointly defined “level of sharing” among representatives of professional
sectors. Focus of @qua is on gathering and sharing experiences on how to overcome barriers
to the introduction of ICT solutions for innovative water management and on how to ensure
their wider uptake and best use. Partners have the ambition to develop and to promote the
interoperability principle and the use of common standards in the water industry. In a
holistic and consistent approach, @qua addresses all the issues of the water management
from resources to societal changes, using a wide range of ICT solutions: data acquisition,
numerical modelling, real-time monitoring and field operation management.
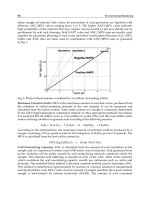
3.1 The @qua methodology
The @qua thematic network members have developed a general methodology based around
few steps which can be summarized as follow:
Step 1. Water business processes and ICT solutions: identification of gaps and expectations
of the water domain professionals on ICT solutions;
Step 2. Identification and validation of innovative ICT solutions by the ICT professionals
with the objective to bridge the identified gaps during the Step 1;
Step 3. Develop the “level of sharing” of each ICT solution in order to address
interoperability, standards, architecture and roadmap for implementation issues;
Environmental Monitoring
420
Step 4. Produce guidelines, standards and specifications on specific ICT solutions needed
by the water domain in order to achieve a more efficient water management.
The two main characteristics of the defined approach are:
the global analysis based on “business processes” and associated added value;
the definition and the use of concept of "level of sharing" to decide which ICT
innovations could be widely disseminated throughout the water profession.
Fig. 4. The @qua methodology.
The initial step, led by water utilities and water engineering companies, is dedicated to the
analysis of the business processes, both for the artificial cycle and the natural cycle of water,
and both for design and for operations. The business processes are described at a macro
scale, where the tiny differences between entities are not seen and where just the common
"backbone" is visible. These business models are used as "base maps" in order to show the
unequipped - or poorly equipped - steps in terms of ICT. A special attention is turned to the
analysis of added value of these unequipped steps. The diagnostic characterizes the added
value not only on the economic point of view, but also on sociological and ecological
dimensions. In addition to the common map of the water business processes itself, the result
of this step is the list of the steps / processes that "deserve" to be equipped with new ICT
tools. This effort of analysis according to the business processes vision represents an
essential input in the water domain. Until now this diagnostic was not established for
several reasons and especially due to the low maturity of water industrial domain regarding
ICT solutions and uses.
The second step is led by the ICT sector representatives and consists in a technologic
analysis of the needs and requests written by the water companies’ representatives. The step
includes not only the assessment of the feasibility, the potential availability and the cost of
the requests, but it will also propose other tracks, unimagined or not foreseen during the
previous step. The water companies have a partial vision of ICT solutions and they need a
better knowledge of the current trends of the ICT industry / market. Alternating the
leadership of the steps between the "water people" - water companies and other
stakeholders - and the "ICT people" brings an efficient synergy.
The third step is focused on the determination of the "level of sharing". This concept is a
central element which is developed and used by the @qua network. For the time being, the use
and the implementation of existing ICT solutions in the water domain is made case by case,
with a quite variable customization which is covering a simple technical adaptation like
Step 1
• Water business processes and ICT solutions: identification of gaps and
expectations
Step 2
• Identification and validation of innovative ICT solutions & bridge the gaps
Step 3
• Develop the "level of sharing" of each ICT solution and address interoperability,
standards, architecture and roadmap for implementation issues
Step 4
• Produce guidelines, standards and specifications on ICT solutions needed by the
water domain
ICT for Water Efficiency
421
wavelength, to in depth R&D development like the use of alternative energy sources for power
supply in waste water monitoring actions. The partners of the @qua network have significant
experience of implementation and development actions. The spectrum of their expertise is
covering most the business processes involved in the water domain. From this experience and
according to their identified needs in innovative ICT solutions, they define, for each
technology identified as a priority, the requested level for developing an efficient interface
between the different components involved into the business process. Such work represents a
major output for the @qua network and constitutes clearly an added value provision by the
network to various professional communities. It is clear that in a wide community as the
European water profession, the status of the various Information Systems has a very high
variety. This step will analyse the "IS/IT context" parameters in the profession: maturity of the
IS, level of integration (integration of the IS itself as well as integration in the business
processes), level of alignment with the strategy, and the local parameters (ERP/ software
already installed, other relevant IT projects, trends of the local IS/IT market, etc.). This step
proposes the ideal "level of sharing", i.e. the level which will maximize the effectiveness and
efficiency of the new ICT tools by taking into account the actual current IT/IS situation. This
output defines the outcomes of the @qua network, which could go from the very theoretical -
methodologies, data models, architectures, principles of standardization, etc. - to the very
concrete elements such as list of devices compliant with the selected telecom standards,
deployment of a common software and instructions of customization, etc.
In a final step, the production of the guidelines and specifications whose needs are
identified in the previous steps. According to the results of the previous step, these results
can go from very generic guidelines to more precise technical specifications such as
hardware requirement for sensors, software architecture, strategy for implementation and
deployment in water services, metadata architecture, business process description and
standards. A similar approach has been partly applied with HarmonIT project
() on the specific field of the hydroinformatic systems
interoperability and the development of the OpenMI standards ().
In the case of the @qua approach, the spectrum is much more wider because it’s addressing
most of the business processes involved in all water uses and domains.
3.2 The expected results and impacts
The water domain - and water stakeholders - is very wide and covers a huge number of
business processes especially if all domains and activities are considered. This situation
legitimates the mapping process and the prioritization of gaps that need to be bridged.
Clearly the efforts have to be focused on five major areas directly linked to the urban water
use which where both expectations and possibilities are the highest:
a. Real time monitoring
Specially real time networks monitoring including Automated Meter Reading(AMR);
Installation of leak detectors in the network;
Real time quality management (disinfectant, turbidity, pH, temperature,
conductivity, RedOx, etc.);
Sensors at all Points Of Use (POU);
Real time information of customers and stakeholders;
Related technologies such as Supervisory Control And Data Acquisition (SCADA),
GIS, telecommunications, sensors (especially low cost sensors), inverse models,
decision support systems.
Environmental Monitoring
422
b. Cities of Tomorrow
In the current vision , there is an absolute need of generalized ICT in the operation
of the cities of the future, or sustainable cities, or water-sensitive cities;
Cascading usages of water (incl. re-use and recycling), rainwater harvesting, storm
water management, desalination, managed aquifer recharge, micro treatment
plants, etc. are the core techniques of the cities of the future These techniques need
a very high level of monitoring and thus, a sophisticated density of ICT;
Leakage reduction in distribution networks;
Improving water efficiency in cities.
c. Asset Management and Field Work Management
In-pipe and “through road” condition assessment sensing technologies;
Continuous performance, condition and risk assessment sensors and prediction
models;
Optimised network operation and “just in time” repairs and investment programmes;
GIS/GPS information;
Buried asset electronic identification and tagging devices, wireless communication
through road materials;
"Wearable computers" for field workers, giving access in real time to all data bases
of the company, with interfaces consistent with field conditions.
d. Energy Efficiency
Smart grid in water distribution systems (real time management of pumping
strategy, refined demand forecast, optimization of network management and of
operating costs);
Tools for energy saving in treatment plants;
Real time status monitoring (open/closed) of manual valves (cf. above : equipment
of field operators);
Monitoring and control of heat recovery in wastewater;
Tools for Smart Metering / Smart Pricing (e.g. condition-based tariffs).
e. Water efficiency
Improving water efficiency in cities;
Improving water efficiency in agriculture, including detection of illegal abstraction;
Ecosystems and land-use management in perspective of project scope and available
resources.
4. Some ICT solutions for water efficiency
The analysis of the domains and the business processes demonstrates the relevance and the
key position of the data acquisition process through sensors located in the various sectors of
the water cycle. This need is recurrent and could be seen in the three domains and takes a
central position in surveying, monitoring and operating activities.
4.1 The sensor revolution
The analysis of the domains and the business processes demonstrates the relevance and the
Following the PC revolution in the 1980s and the Internet revolution in the 1990s, the on-going
revolution is connecting the Internet back to the physical world, creating that world its first
electronic nervous system or Information System. The sensor revolution is based on devices
that monitor environment - natural & built - in ways that could barely imagine a few years ago.
ICT for Water Efficiency
423
A sensor is any device that can take a stimulus, such as heat, light, magnetism, or exposure
to a particular chemical, and convert it to a signal. Sensors have certainly been around for a
very long time with scales (weight sensors), thermometers (temperature sensors) and
barometers(pressure sensors). More recently, scientists and engineers have come up with
devices to sense light (photocells), sound (microphones), ground vibrations (seismometers),
and force (accelerometers), as well as sensors for magnetic and electric fields, radiation,
strain, acidity, and many other phenomena.
While the concept of sensors is nothing new, the technology of sensors is undergoing a rapid
transformation. Indeed, the forces that have already revolutionized the computer, electronics,
and biotech industries are converging on the world of sensors from at least three different
directions:
Smaller. Rapid advances in fields such as nanotechnology and (micro electro-mechanical
systems (MEMS)) have not only led to ultra-compact versions of traditional sensors, but
have inspired the creation of sensors based on entirely new principles. The reduced size fits
perfectly with the constraints of the water supply and open possibilities into the monitoring
and operating activities.
Smarter. The exponentially increasing power of microelectronics has made it possible to
create sensors with built-in "intelligence." In principle, at least, sensors today can store and
process data on the spot, selecting only the most relevant and critical items to report. One of
the emerging concepts in this domain is the ubiquitous computing paradigm. This approach
is highly relevant for the water domain especially for all warning and monitoring systems
which may avoid the centralized design.
More Mobile. The rapid proliferation of wireless networking technologies has cut the tether.
Today, many sensors send back their data from remote locations, or even while they're in
motion.
In the urban water domain, the new sensors are already deeply impacting several business
processes with Automated Meter Readers (AMR), water quality control devices and
operating supervision. Such trend is following the recent evolution observed in energy
distribution sector. An emblematic evolution is the one taking place with the introduction of
the smart metering concept for water consumption monitoring.
4.2 From mechanical meters to smart metering
Water meters reading remains one of the core business process of water utilities or public
services in charge of drinking water supply. This activity requests a good level of organization
and a good management of the devices. To date, water meters have been accumulation meters,
pulse meters or interval meters which are all mechanical devices. The data are collected
directly regularly on the field. This process can report about consumption and can detect some
leakages into the network. However, reactivity is low due to the limited visits on the field. The
past decade has seen an evolution of conceptual design of advanced or smart metering and its
terminology. Driven by electricity investment, metering has evolved from accumulation
meters to interval meters with simple communications, to advanced or smart metering with an
increased range of metering functionality. This increase in electricity meter functionality and
complexity has started to be mirrored in the water industry.
Interval metering is comparatively more expensive than pulse metering, as the interval
meter is required to constantly monitor the water flows through the meter and record this
volume at the expiration of the metering interval. By using a fine pulse quantum and
analysing the time stamps of these pulses, pulse metering data can be used to approximate
Environmental Monitoring
424
interval water metering data and hence deliver similar benefits. Use of pulse metering
where a time stamp is made when a certain quantum of water is consumed, is more
common in the water industry and these pulse meters are available at reasonable cost.
Smart water metering for the water industry will extend beyond the capability of
Automated Meter Reading (AMR). Smart water metering is expected to, as a minimum,
establish more granular - within a day - water usage data, two-way communications
between the water utility and the water meter, and potentially include communications to
the customer. With respect to a customer’s household, smart water metering could enable:
Recording of water consumption within a day;
Remote meter reading on a scheduled and on-demand basis;
Notification of abnormal usage to the customer and/or the water utility;
Control of water consumption devices within a customer’s premise;
Messaging to the customer;
Customised targeting of segments.
The options to be considered for smart water metering are:
Choice of communication to the water authority/water utility and the home;
Choice of consumption data measurement (pulse or interval metering).
Fig. 5. Smart water metering logical architecture.
Options for the implementation of smart water metering communications arise through
choices on:
Water authority/water utility communications: The method and frequency of data
collection through either drive-by collection, leveraging electricity Advanced Metering
Infrastructure (AMI) communication networks or standalone water AMI
communications networks;
Customer communications: The method of communicating consumption information to
customers: either in real-time across a Home-Area-Network (HAN), or in a historical
manner through bills.
Since 2006, various pilot projects - from 100 to 500 smart meters – have been implement
worlwide and espacially in Europe within France, Italy, Spain and Malta. The projects are
carried out by the water utilities who are supporting development and implementation in
ICT for Water Efficiency
425
various municipalities and for different situations (type of building, type of cities, ). Most
of the projects are based on wireless devices and very few are deployed on the wire
networks. Following the first experiments, the main water utilities have already initiated the
implementation of smart meters at a large scale with for example more than 350 000 units
for France.
The pilot studies and experiments carried out since several years by the water utilities have
demonstrated the savings in water consumption due to the use of the smart metering. The
savings are taking place at various levels such as:
Reduction of individual consumption. The details of the consumption are accessible
through various media such as a specific website or a small electronic terminal. The
information provided to the consumer immediately generates a reduction up to 15%;
Reduction of water consumption at the macro scale (city to block). The smart metering
allows to identified non conform water consumption and consequently help to reduce
leakages after and before the smart meter itself. Text messages could be sent to
consumers when the consumption is initiating a non coherent pattern with the previous
consumption. The water utilities can also detect major leakages on the networks.
The knowledge in real time of the water consumption allows to identify seasonal needs
of the population and to anticipate the volumes of resources to mobilize. This approach
allows a more functional use of resources and contributes globally to reduce the
consumption.
The knowledge in real time of the water consumption opens the doors to a new
approach about pricing, based on seasonal and even hourly values.
Today, according to various publications and sources (Oracle, 2011), about a third of water
utility managers in USA say they are in the early stages of adopting smart meters, despite
the fact that 71 percent of water users say that having more detailed information on their
water consumption would promote better water conservation. This figure is representative
of the worldwide situation. From the water utilities point of view, the following benefits to
adopting smart meters could be identified:
enabling early leak detection ;
supplying customers with tools to monitor/reduce water use;
providing more accurate water rates;
curbing overall water demand;
improving the ability to conduct preventative maintenance.
The financial efficiency of the smart metering has been already demonstrated through
various study cases and pilots (Marshment Hill Consulting, 2010) In developing countries
where development of infrastructures and management of water resources represent a great
challenge, the opportunity to invest in the smart metering concept is clearly a key issue
which request an integrated effort in the global urban management.
5. Conclusion
The water sector represents a major challenge for the 21
st
century. The climate evolution
combined with the growing of pressure of populations will generate new stresses on a
limited resource which has to be carefully managed and protected. The fast development of
ICT solutions allows today to enter a new area which may be characterized by the idea to
move from a scarcity of data to a continuous flow of data - “data rich world” - about natural
and built environment. This new situation will become a reality in the coming two decades
Environmental Monitoring
426
and will allow potentially improving, globally, the water management. However, if this
perspective represents a clear benefit both for natural and manmade environments, it
request the development of a coherent vision based on a process allowing to integrate the
fragmented activities developed until now in the water sector. The ICT solutions will allow
this integration process but they have to be coordinated under guidelines and standards
which have to be jointly defined by the various actors of the water sectors. Regulating
bodies, public services, water utilities and IT producers are invited through organisations
like @qua, to engage an active dialog in order to develop a coherent strategy. The suggested
approach, based on business processes, represents a solution which has to be extended to all
activities and domains of the water sector. It implies a real mobilization of all actors from
who have to formalize their processes. Of course this effort requests a maturity in the
process itself in order to be able to characterize the tasks and their dynamic.
The water sector represents a vast area where ICT solutions can be implemented and
provide a real improvement. In order to benefit of these solutions, the water sector has to be
pro active and structured in order to express needs. This challenging and exciting task will
mobilize many professionals from both sectors and will request debates within the society
on choices regarding water and its management.
6. Acknowledgment
The @qua thematic network and this work is funded under the ICT Policy Support
Programme of the 7
th
Framework Program (FP7) of the European Commission.
7. References
Gourbesville, P. (2009) Data & hydroinformatics: new possibilities and new challenges. Journal of
Hydroinformatics, Vol 11 No 3–4 pp 330–343, ISSN: 1464-7141
Jønch-Clausen T. & Global Water Partnership (GWP) (2004) IWRM and Water Efficiency Plans
by 2005: Why, What and How?, GWP, 45p, Sweden, ISSN: 1403-5324
Holz, K.P., Hildebrandt G., Weber L. (2006) Concept for a Web,-based Information System for
Flood Management, Natural Hazards, 38, pp 121–140, ISSN: 0921-030X
Marshment Hill Consulting (2010) Smart Water Metering Cost Benefit Study, Marshment Hill
Consulting, Melbourne, Available from:
/>metering-cost-benefit-study.pdf
Oracle (2011) Smart Grid Challenges & Choices, Part 2: North American Utility Executives’
Vision and Priorities, Oracle, USA, Available from:
Silver, M.S.; Markus M. L.; Mathis Beath C. (1995) The Information Technology Interaction
Model: A Foundation for the MBA Core Course, MIS Quarterly, Vol. 19, No. 3, Special
Issue on IS Curricula and Pedagogy (Sep., 1995), pp. 361-390, ISSN 1937-4771
Water Supply and Sanitation Technology Platform – WSSTP (2005) Water Safe, strong and
sustainable. European vision on water supply and sanitation in 2030, WSSTP, Brussels,
ISSN-1725-390X
World Water Council (2009) Politics gets into water. Triennal report 2006-2009, World Water
Council, Marseille. Available from:
/>eports/Activity_reports/TriennalReport_2006-2009.pdf
24
Monitoring Information Systems to
Support Adaptive Water Management
Raffaele Giordano, Giuseppe Passarella and Emanuele Barca
Water Research Institute - National Research Council, Bari,
Italy
1. Introduction
Decision making in water resources management is widely acknowledged in literature to be
a rational process, based on appropriate information and modeling results. Information
plays a fundamental role in improving our understanding of the consequences of, and
trade-off among, the alternatives in water resources management.
Environmental monitoring networks have the potential to provide a great deal of
information for environmental decision processes. Monitoring is widely used to increase our
knowledge both of the state of the environment and of socio-economic conditions.
Environmental monitoring has demonstrated its capacity within resource management to
support decision processes providing knowledge of baseline conditions, to detect change, to
establish historical status and trends, to promote long-term understanding or prediction,
and to establish the need for, or success of, interventions.
Our knowledge of the complexity of water system processes is increasing, together with our
awareness of the uncertainty and unpredictability of the effects of water management on
system dynamics. Consequently, the demand for environmental information is growing
posing new challenges to monitoring system design. This chapter discusses these new
challenges and proposes an innovative monitoring design approach to deal with
complexity. The conceptual architecture of an Adaptive Monitoring Information System
(AMIS) is proposed. The AMIS properties are used in this work to define a framework to
assess the capabilities of current monitoring systems to support water managers to cope
with complexity and uncertainty. The framework is used to identify the main limitations
and to define the potential improvements of TIZIANO monitoring system, developed to
monitor the state of groundwater monitoring in the Apulia Region (South Italy).
2. New challenges for monitoring systems and information management in
Adaptive Management (AM)
Incorporating uncertainties about future pressures on river basins into water resources
management sets new challenges for environmental resources management. One learning
process being developed to address this challenge is Adaptive Management (AM)
(Holling 1978). Learning more about the resources or system to be managed and its
responses to management actions, in order to develop a shift in understanding, is an
inherent objective of AM (Walters, 1997; Fazey et al., 2005). Learning in AM leads to a
Environmental Monitoring
428
focus on the role of feedback from the implemented actions. Such feedback-base learning
models stress the need for monitoring the discrepancies between intentions and actual
outcomes (Fazey et al., 2005). Monitoring becomes the primary tool for learning about the
system and its performance under different management alternatives (Campbell et al.,
2001).
To this aim, we assume that learning can be defined as a change in a person-system
relationship, that is, the understanding of a person’s place in the system and how they
perceive it (Fazey et al., 2005). This definition implies that, because understanding is the
goal which is achieved by the learner, each person may understand the environmental
system differently and, therefore, act differently (Fazey et al., 2005). From the information
production and management point of view, this implies that mental models influence an
actor’s perception of a problematic situation by influencing not only what data the actor
perceives in the real world and what knowledge the actor derives from it (Timmerman and
Langaas, 2004; Pahl-Wostl, 2007; Kolkman et al., 2005), but also what is noticed and what is
taken to be significant (Checkland, 2001). It is important in information production and
management that there should be a clear understanding and sharing of information users’
mental models.
Therefore, contrarily to the traditional approach, in which information needs elicitation was
intended in a top-down perspective, the design of a monitoring system for AM should begin
by bringing together the interested parties to discuss their understanding of the system, the
management problem, the information needed and how this information should be used.
This implies involving a wide variety of stakeholders (i.e. scientists, managers, policy
makers and members of the public at large) in a debate in which assumptions about the
world are teased out, challenged, tested and discussed (Checkland, 2001), leading to the
establishment of a common understanding about the system to be managed (Pahl-Wostl,
2007). This shared understanding can be structured in a system cognitive model, which
allows the emergent properties of the system (i.e. variables to be monitored, thresholds, etc.)
to be identified.
Among the different methods for Cognitive Modelling, an integration between Cognitive
Maps (CM) and Causal Loop Diagrams (CLD) would seem particularly interesting to
support monitoring system design. Given the peculiarities of the two modelling devices,
CM can be used to disclose individual understanding of the system and to support the
debate among participants, whereas CLD has great potentialities to simulate system
dynamics.
When defining the cognitive model to be used as basis for a monitoring system, it is
essential to address certain issues related to complex system dynamics. Firstly, the issue of
scale must be tackled, since complex systems have structures and functions that cover a
wide range of spatial and temporal scales. The impact of a given management action may
vary at different scales (Campbell et al., 2001). Moreover, structures and processes are also
linked across scales. Thus, the dynamics of a system at one particular scale cannot be
analysed without taking into account the dynamics and cross-scale influences from the
scales above and below it (Walker et al., 2006).
To deal with interaction between scales, we assume that the complex web of interacting
systems can be broken down recursively into a network of individual systems, each of
which determines its own fate and affects that of one or more other systems. The
hierarchical structure of relationships between systems and subsystems (Campbell et al.,
2001) implies that working on a particular scale often requires insights from at least two
Monitoring Information Systems to Support Adaptive Water Management
429
other scales, i.e. the level below, to understand the important processes that lead to the
emerging characteristics of the level considered, and the level above it. Two sets of variables
have to be considered for every system-subsystem pair. One set is required to describe the
properties of the subsystem, whereas the second set is needed to describe the contribution of
the subsystem to the performance of the whole system. This duality should be repeated at
every level of the system hierarchy (Bossel, 2001).
Therefore, during the participatory process aimed at developing the cognitive model,
participants should be required to think about their understanding of the total system, its
essential component systems and the relationships that exist between them. The variables
forming the cognitive model have to be able to describe the performance of the individual
system and its contribution to the performance of the other systems. Using this inter-scale
cognitive model as a basis for the design phase allows us to define a monitoring system
capable of dealing with complex relationships between different scales, thus overcoming
one of the main drawbacks of traditional monitoring practices.
However, adopting this inter-scale approach usually results in a demand to monitor a
broader set of monitoring variables than traditional monitoring approaches. Some of these
variables are fairly cheap to measure, but others, such as trends in very rare and important
species, can be very expensive to monitor (Walkers, 1997). Thus, the development of an
affordable monitoring program to support Adaptive Management involves substantial,
scientific innovation in both method and approach, aimed at simplifying the set of
monitoring variables by identifying the key components of the system.
The key components of the system, or key variables, are those that influence the system
dynamics and bring about the most important changes (Walker et al., 2006; Campbell et al.,
2001). Since these variables influence the overall dynamics of the system, they are of direct
interest to managers, who are frequently focused on fast variables. These variables operate
at different scales and with different speeds of change. The slowly changing variables
determine the dynamics of the ecological system, whereas the social systems can be
influenced by slow and/or fast variables (Walker et al., 2006). The conceptual models
developed integrating the stakeholders’ understanding of the system can be used as a basis
for identifying the key variables (Campbell et al., 2001). To this aim, the analysis of CM can
provided information about the relative importance of the different variables, by analysing
the complexity of the causal chain. Those nodes whose immediate domain is most complex
are taken to be those most central and, thus, the most important.
The identification of the key variables can also be supported by a strict integration between
system monitoring and system modelling. This, in turn, is essential to any analysis of the
implications of water policies. It allows the difficulties in understanding the dynamic
feedback of the systems to be overcome, a particularly difficult task in an environmental
context because of the number of factors involved. Moreover, humans have a limited
capacity to understand the complexity of feedback in ecological systems (Fazey et al., 2005).
This leads to erroneous connections between cause and effect and, thus, to erroneous
conclusions about the impact of management actions. Conversely, models suggest which
variables may be critical to monitor the impact of management actions, by posing elaborate
hypotheses of which variables and relationships are critical to understanding the problem in
question. The models then consider the dynamic implications of these hypotheses through
the simulation of different scenarios. This allows monitoring networks to be designed (and
re-designed) according to the model results. The potential of models to simulate future
scenarios can be exploited to support the categorisation of the variables according to speed
Environmental Monitoring
430
of change, i.e. slow changing variables and fast changing variables. Scenario simulation can
draw attention to the role of the slow-changing variables in influencing system dynamics
(Walker et al., 2006). The categorisation of variables according to speed of change can be
used to program the frequency of data collection, making it easier to identify each variable’s
trend.
The integration between monitoring and modelling has to be considered as an iterative
process. In fact, while models can simulate system dynamics, allowing the identification of
key variables, the availability of new data allows the revision and updating of models.
Moreover, the speed of change of the variables can also be considered iterative. Indeed,
variables classified as slow changing in the model may be identified as fast changing by the
monitoring system. In this case, the monitoring sample interval has to be changed. Thus,
clearly a re-assessment process is needed both in models and in monitoring.
Simulation of system dynamics facilitates the identification of thresholds, which can be
broadly defined as a breakpoint between two states of a system. When a threshold is
exceeded, a change in system function and structure results. Such changes regard the nature
and extent of feedback, resulting in changes of directions of the system itself. The changes
can be reversible, irreversible or effectively irreversible (Walker et al., 2006). Two different
types of thresholds can be defined, i.e. positive and negative. A positive threshold
represents a desirable change in the state of the system. Such a change can be due to
implemented management actions. A negative threshold can be considered as the starting
point of a non-acceptable system trajectory. The recognition of these thresholds is
particularly important in the case of irreversible changes. In this situation, actions are
needed in order to avoid exceeding the threshold. The integration between monitoring and
modelling provides information about the current state and the future trajectory of the
system.
The position of the threshold is strictly linked to past experience. There are no examples
where a new kind of threshold has been predicted before it has been experienced.
Typically, the identification of thresholds is based on an analysis of systems similar to the
one under investigation (Walker and Meyers, 2004). To this aim, a database is going to be
implemented to collect empirical data on possible regime shifts in socio-ecological
systems (Walker and Meyers, 2004). Some authors suggest using variances in variable
trends to detect an impending system change (Brock and Carpenter, 2006). Integrating
these two different approaches can be very useful. In other words, the existing experience
regarding regime shifts, coming both from other systems and from the tacit knowledge of
experienced and highly skilled people, can be structured and included in the system
model. The variance can be calculated using monitoring data and the position of the
threshold can be changed.
Integrating system modelling and monitoring iteratively highlights the importance of
collecting information on trends. In fact, the availability of time series of data on the
different variables allows the behaviour of the system variables and the trajectory of the
system to be defined. The detection of trends can support the revision of the hypothesis
concerning system dynamics, which is at the basis of the models. For these reasons it is
fundamental to develop a monitoring system which is sustainable over time. To this aim,
two important issues needs to be addressed, i.e. the need firstly to increase the adaptability
of the monitoring system to policy and learning processes, and secondly to reduce
monitoring costs through the adoption of scientific and technical innovation in information
collection.
Monitoring Information Systems to Support Adaptive Water Management
431
3. Adaptive monitoring and information system
Considering the issues described in the previous section, the conceptual architecture of a
monitoring system for AM was defined (figure 1). From now onward, we refer to this
system as Adaptive Monitoring Information System (AMIS).
Fig. 1. AMIS conceptual architecture. The figure has been adapted from the Information
cycle elaborated by Timmerman and others (2000), to emphasise the two learning
processes.
As described previously, the basis for AMIS design is the conceptual model of the system,
which simplifies the system and makes the key components and interactions explicit. The
definition of this model is based on the integration between a participatory process,
allowing experienced stakeholders to provide their understanding of the system, and
models able to simulate future scenarios. The conceptual model is structured using the
integration between Cognitive Maps and Causal Loop Diagrams.
Two different conceptual models, i.e. the “water management conceptual model” and the
“information management conceptual model” are defined as the basis of AMIS. The former
concerns the interpretation of the problem considered, while the latter concerns the
information needed to solve the problem considered, and the “frames” used to interpret the
information (Pahl-Wostl, 2007; Kolkman et al., 2005).
The AMIS architecture consists of four main boxes, i.e. Conceptual model elicitation, Design,
Data collection and Interpretation. The links between them represent the iterative process of
monitoring design, which is at the basis of AMIS. The figure was elaborated starting from
the information cycle developed by Timmerman et al. (2000). This cycle depicts a framework
where information users and producers communicate information needs that link the
Environmental Monitoring
432
monitoring and decision processes. The monitoring program needs to be adapted to the
different stages of the policy definition process, because each stage requires different types
of information (Cofino, 1995; Ward, 1995) to make water management and governance
adaptive.
Two possible learning processes can be identified. The first one concerns the water
management conceptual model. Once information has been examined, a perspective is
developed, and an insight is gained and integrated into the conceptual model itself
(Kolkman et al., 2005). Information may prove initial models to be wrong and support the
debate between actors, which may lead to a revision of models, through reflection
and negotiation, in a social learning process. This learning may, in turn, support changes
in the water management conceptual model. Moreover, feedback on management
actions may generate new questions or new insights. This may make the originally agreed
upon information appear inadequate, resulting in new information needs. Thus,
the information needed to support a decision process evolves according to the actors’
learning process, leading to revision/adaptation in monitoring strategies and data
interpretation.
The second learning process relies on feedback from applied monitoring practices. As a
result of experience in implementing the monitoring program and assessing its results,
adaptation to monitoring may be needed (Cofino, 1995; Smit, 2003). The causes for
adaptation can be found within monitoring practices: too little attention may have been
spent on specifying the information needs; the information needs may have been specified
in such a way that no adequate information can be produced from it, or so that it does not
reflect the actual information users’ needs; the selected indicators may not adequately
measure what they are purported to measure; or the strategy to collect information may not
have produced the right information. Furthermore, the available budgets may restrict the
number of indicators that can be measured or the intensity of the network in terms of
locations and frequency. New information sources may become available (e.g. progress in
remote sensing technologies, etc.).
To this aim, an important innovation in AMIS concerns data collection methods. AM often
results in a demand to monitor a broad set of variables, with prohibitive costs if the
monitoring is done using only traditional methods of measurement. This is particularly
true in developing countries, where financial and human resources are limited. In these
areas, the monitoring network may cover only small part of the territory or the grid may
be too sparse, making the monitoring data unsuitable for the decision process.
Furthermore, traditional monitoring is costly, reducing its sustainability over time. The
resulting works may be still valuable as one-off assessments, but they do not provide
information about the trends of environmental resources and the evolution of
environmental phenomena. Thus, the outcomes of environmental policies are often
difficult to assess.
To deal with these issues, AMIS is based on the integration of alternative sources of
knowledge. Thus, AMIS can be considered as the shared platform through which traditional
monitoring information and innovative information sources (e.g. remote sensing
monitoring, community monitoring, etc.) are integrated. Therefore, AMIS is able to adapt to
data and information availability, supporting adaptive management even in data poor
regions.
In Table 1, a comparison between the conventional approach and monitoring to support
IWRM and AM is proposed.
Monitoring Information Systems to Support Adaptive Water Management
433
Current monitoring practices Needs for IWRM
- Based on monitoring objectives and
disciplinary needs
- Information users have unrealistic
expectations of the information that
will be produced
- Data accessibility is limited
- Abundant and detailed information is
provided
- The information provided is highly
specialised
- The available information is divided
over various organisations
- Information is transferred to the
information users
- Based on policy objectives and
information users’ needs
- The information that will be produced
is jointly agreed between information
users and producers
- Data are publicly available and
accessible
- The information provided is concise
and addresses the policy objectives
- The information is targeted towards
specific audiences
- The information combines results from
various organisations and is integrated
over disciplines
- Information is communicated to the
information users and a broader
stakeholder or public audience and
evaluated before being incorporated
into policy support
Additional needs for AM
- The outcomes of the monitoring
program (data) are the focus.
- The purpose of the monitoring program
is to evaluate environmental status set
against target values.
- Monitoring follows management and
policy implementation.
- The monitoring program design and the
responses on this design are as
important as the results: the focus is on
learning.
- Monitorin
g
becomes the primar
y
tool for
learning, i.e. understanding the system,
assessing the effectiveness of
management activities evaluating the
s
y
stem chan
g
es, and measurin
g
pro
g
ress
towards participatory defined goals.
- Monitoring, management and
governance are interdependent.
Table 1. Comparison among current, IWRM and AM monitoring
3.1 Learning process using AMIS
Learning aspects in the AMIS are not about the monitoring as a simple process or its data,
but about an increase of the system understanding, communication between stakeholders to
influence decision making (McIntosh et al., 2006). While giving floor to and later using
knowledge, concerns, demands, and expertise from different points of view, which result
from a stakeholder involvement, one will indeed achieve better decision making with more
alternatives of choice on the one hand, and a broader and more balanced acceptance of the
decision making in management.
To initiate and later-on ensure learning processes using a monitoring system, all relevant
stakeholder groups need access to it. Being involved when objectives are defined, data and
processes transparently observed, stakeholders get enabled to learn about variables and
Environmental Monitoring
434
interactions of “their own” systems and “their own” decisions which could lead to a
revision or adaptation of management decisions (Pahl-Wostl, 2007. Further, this creates the
feeling that stakeholders "buy in" into the product, that the monitoring system is “their” and
therefore deserves more credibility (McIntosh et al., 2006). According to recent approach, the
involvement of stakeholders can be extended to monitoring activities and not only to the
design phase. The use of local knowledge enhances the understanding of environmental
system, particularly in data poor areas. Moreover, adopting a community-based approach to
monitoring can promote the public awareness of environmental issues.
Thus the intensive dialogue between science and many different stakeholders offers the
opportunity for a mutual development, assessment, enhancement and implementation of
new or already existing concepts, methods and tools, and helps improve the quality and
acceptance of the decisions that are made. Last not least when using success-stories in
management, based on the AMIS design, for the further development and enhancement of
the monitoring system, the learning cycle is closed.
The following criteria, implemented into an AMIS, are indispensable to serve as a learning
tool (cf. McIntosh et al., 2006):
1. Understandability: for each group of participants one should use “professional”
indicators and perception-oriented “public” indicators to support learning processes for
both of them
2. Representativity in involvement. Regardless of the method used to solicit user groups
of the AMIS, every attempt should be made to involve a diverse group of stakeholders
or broad audience that represent a variety of interests regarding the issue addressed.
While key stakeholders should be invited to the process of indicator formulation, there
should be also an open invitation to all interested parties to join the evaluation of the
system. This adds to the public acceptance and respect of the results of the AMIS. If a
process is perceived to be exclusive, both key members of the decision-making
community and the wider public may reject monitoring.
3. Scientific credibility. Although participatory monitoring as it is understood in the
AMIS design incorporates values and beliefs, the scientific components of the
monitoring system must adhere to standard scientific practice and objectivity. This
criterion is essential in order to maintain credibility among all groups, expert-decision-
makers, scientists, stakeholders, and the public.
4. Objectivity. The stakeholder community must trust the facilitators of a participatory
monitoring as being objective and impartial. In this regard, facilitation by university
researchers or outside consultants often reduces the incorporation of stakeholder biases
into the scientific components of the monitoring system.
5. Understanding uncertainty. Understanding scientific uncertainty is critically linked to
the expectations of real world results associated with decisions made as a result of the
modelling process. This issue is best communicated through direct participation in the
modelling process itself.
6. AMIS’ own adaptability to incorporate new users groups, changed frameworks and
newly gained (quantitative and qualitative) data. The monitoring system developed
should be relatively easy to use and up-date by the administrators. This requires
excellent documentation and a good user interface. If non-scientist users cannot
understand the monitoring system as a source to work with, local decision-makers will
not apply it to support real management problems.
Monitoring Information Systems to Support Adaptive Water Management
435
3.2 Technical adaptability of an AMIS
In this section some technical aspects related to the adaptive degree of AMIS are described.
Firstly, AMIS should be flexible and able to incorporate new information and data, of
different type and with different formats. Using a relational database (RDBMS) is a sound
basis to be open for new information requirements, because it is very flexible and
extendable. The information can be well structured and redundancy can be avoided. The
user can create new tables and link them to the existing database.
To satisfy the information needs of various user groups according to their knowledge of
environmental system behaviour, different types of information for different purposes must
be produced. One important aim of the AMIS is to provide the user with various methods
and predefined algorithms to produce information. AMIS should provide the user with
user-friendly predefined methods and algorithms to produce information, such as data
visualisation tools as well as automatically generated information from incoming data.
Fig. 2. Technical components of AMIS.