Nuclear Power System Simulations and Operation Part 13 pptx
Bạn đang xem bản rút gọn của tài liệu. Xem và tải ngay bản đầy đủ của tài liệu tại đây (484.55 KB, 15 trang )
Non-Linear Design Evaluation of Class 1-3 Nuclear Power Piping
169
2. A load set includes generally several loads. When plasticity taken into account, the
structural responses (deformation and stress state) depend on how and in what order
these loads are applied.
3.
The “collapse-load” defined in ASME III is generally less than the true collapse-load,
ASME PVB Code, Section II-1430 (ASME, 2009b). This implies that one cannot
determine the collapse-load by simply taking the load-level at which a computational
divergence occurred, see also Fig. 2.
4.
In practice, when a piping system found to be “overstressed” somewhere in the piping
system, one attempts to avoid to analyze the whole piping system in a non-linear finite
element analysis. (We do analyze the whole piping system in many cases.) Instead, a
critical part, for example, a bend or a T-branch, where the maximum overstress taken
place, is first identified, and “cut” out from the piping system. Thereafter, a refined
finite element model using e.g. 3-dimensional or shell elements is built for this critical
part. Finally, relevant displacement solutions on the “cut” faces from the linear analysis
are used as boundary conditions for the refined finite element model. This means that,
the collapse-load analysis is made on a component level.
5.2 Plastic analysis according to ASME III
The prediction of the collapse-load according to ASME III should be done in accordance
with the Plastic Analysis specified in NB-3213.25, 3228.3 and Appendix II-1430. Below we
first discuss the modeling issues and, thereafter, describe briefly how the “collapse” load
according to NB-3213.25 can be determined.
NB-3228.3 states that the true material stress-strain relationship should be used. Explicitly, it
means that the true yield stress and strain hardening rule should be used. It has been
observed in earlier performed work that the material is modeled by specifying the following
when using non-linear finite element software e.g. ANSYS: (1) the true yield stress in a von-
Mises material and, (2) a small plastic modulus (e.g. 10 MPa) in bilinear kinematical
hardening. Strictly speaking, this is far away from what NB-3228.3 requests. In such a
modeling, no hardening has been taken into account.
Notice that for some metals strain hardening is significant and, in addition, exhibits a strong
Bauschinger’s effect. In such cases, a correct prediction of the response history can most
likely not be made without considering hardening effects. This will particularly be true if
cyclic loading and shakedown process should be modeled, see Section 6. Intuitively, one
may think that the prediction of the collapse-load is in nature static analysis, where external
loads are increased incrementally and, hence, repeated unloading-loading processes are not
involved. This leads, in turn, to a conclusion that hardening effects are not important. Such
reasoning is fundamentally wrong. The following facts must be reminded: While increasing
external loads, the development of plastic deformation somewhere in a structure, changes
the way that the structure carries the external loads. Consequently, stresses in the structure
must be redistributed. That is to say, stresses at some material-points will increase and at
some other material-points decrease. In other words, some material-points undergo a
loading process and some others an unloading process. The loading and unloading
processes will, depending on the structure and applied loads themselves, repeatedly take
place during the entire course of the development of plastic deformation.
NB-3228.3 suggests also taking large deformation into account in predicting the collapse-
load. This is explicitly required especially when Service limit Level D considered. For this
case plastic instability should be examined, see Section 3.5.1.
Nuclear Power - System Simulations and Operation
170
Again, we remind that the load-level, at which the computation diverges, cannot be
considered as the collapse-load. Instead, a load-displacement curve should be plotted, see
e.g. Figs. 2 and 3. Thereafter, the “collapse point” should be determined using a procedure
described in NB-3213.25. In Fig. 3 this procedure is illustrated, where P
ca
and P
c
stands for
the “collapse” load according to ASME III and the true collapse-load, respectively. As
illustrated, P
ca
can be far less than the true collapse-load P
c
, which will definitively be the
case if thin-walled structures dealt with.
5.3 Limit analysis according to ASME
The Limit Analysis described in ASME III differs from the Plastic Analysis discussed
previously in two aspects: (1) In the Limit Analysis, an elastic-ideally-plastic material is
assumed, and (2) the yield stress
σ
needs not necessarily be set to the true material yield
stress S
y
, instead, to some allowable stress value which, for example, is 1.5S
m
for Class 1
piping when Design Condition considered, and min(2.3S
m
, 0.7S
u
) for Class 1 piping when
Level D loads considered.
In this sense, the limit analysis specified in ASME III provides only a useful estimation of the
lower-bound of the collapse-load. Other related results, e.g. plastic strains at particular
material points, are much less reliable and, thus, should not be used for decisive judgement
purposes.
We have mentioned earlier that the setting of the yield stress in a Limit Analysis has only
been explicitly stated in ASME III for two cases: Class 1 piping when loads of Design
Condition considered, and Class 1 piping when Level D considered. We have suggested
that, for other cases, the yield stress can be set to the stress limit value that is used in
connection with the linear design evaluation. Namely, we suggest to set
σ
for Class 1 piping
to 1.5S
m
, min (1.8S
m
, 1.5S
y
), min (2.25S
m
, 1.8S
y
), min(2.3S
m
, 0.7S
u
) for Design, Level B, C and
D loads, respectively. In such a way, the yield stress
σ
depends on the piping Class, the
load set under consideration, and the design requirement (equation number) which is not
satisfied in the linear design evaluation. And so will be the predicted collapse-load.
Suppose that a piping system is subjected to a non-reversing load P, which should be
considered as a load in four different conditions: Design, Level B, C, and D conditions,
respectively. The above suggestion can be more clearly illustrated in Fig. 4, where P
A
, P
B
, P
C
och P
D
denotes collapse-loads are predicted in the Limit Analyses.
In Fig. 4 we also illustrate the consequence if the yield stress is always set to 1.5S
m
in the Limit
Analysis. That is, it always requires
2
3
A
PP≤
no matter which Service limits a load P is
designated to.
Alternatively, as discussed in Sections 3.3.1 and 3.5.1, we may set the yield stress
σ
to 1.5S
m
in the Limit Analysis and, instead of using the factor
2
3
when determine the “collapse-load”,
we use a “relaxed” factor,
4
5
(for Level B loads) and 1.0 (for Level C loads).
In a common engineering language, the design philosophy may be interpreted as below:
Under a normal operating condition (Level A), stresses in piping components shall be kept
low within elastic range. In connection with emergency events (Level C), various
components can be subjected to so high stresses that those components, which undergo a
sufficiently high deformation, may continue to be used if certain specific tests can be passed.
Non-Linear Design Evaluation of Class 1-3 Nuclear Power Piping
171
In connection with faulted events (Level D), components which undergo a sufficiently high
deformation should be replaced by new components. We consider that our suggestions
coincide with the design philosophy upon which AMSE III has been built.
Response/Displacement (d)
Load P
The true collapse point
P
D
P
C
P
B
P
A
3
2
P
A
m
S5.1=σ
)5.1,8.1min(
y
S
m
S=σ
)8.1,25.2min(
y
S
m
S=σ
)7.0,3.2min(
u
S
m
S=σ
A
PP
3
2
≤
Fig. 4. Principal sketch of using a
Limit Analysis to predict the collapse-loads for Design, Level
B
, C, and D, when yield stresses set to different
σ
6. Non-linear transient analysis
For reversing loads, a non-linear evaluation requires generally to use a non-linear finite
element analysis to trace transient structural responses. This is directly applicable for all
load cases which do not include any dynamic load defined by floor response spectra.
For such cases, the first essential goal of the evaluation is for most cases to examine if
the 5%
strain limit rule
can be satisfied. When material plasticity involved, the non-linear transient
analysis should be conducted with direct integration algorithms such as Newmark’s
integration, see e.g. Bathe (1996) and Crisfield (1996), as the tangent stiffness (matrix) has to
be updated at each time-increment. Notice that it is the
Plastic Analysis specified in NB-
3213.25 that we conduct in a non-linear transient analysis, which implies that the true
material stress-strain relationship, i.e. the true yield stress and the true strain hardening
behavior, should be used.
Unlike a collapse-load analysis which can be conducted on a component level, a non-linear
transient analysis must always be conducted on the whole system level. Furthermore, when
the non-linear analysis is made on the whole piping system, it is normally not possible to
model all components with sufficient accuracy, as too simple element models may be used
for certain components, for example, T-branches and bends. In such cases, in addition to the
Nuclear Power - System Simulations and Operation
172
non-linear transient analysis, one needs possibly cut these components out from the whole
piping system and try to find their equivalent “static problem” and to predict their
“equivalent” collapse-loads.
In non-linear transient analysis, one focuses on historic transient responses, such as transient
stresses and strains. Hence, the use of realistic non-linear material models is of vital
importance. Among several important issues, the strain hardening behavior of piping
materials have been intensively discussed in recent years.
The ultimate strength of the many materials that are listed in ASME is about twice as much
as their initial yield strength and, for some exceptional cases, more significant hardening
effects can be observed. For example, the yield stress is 35
ksi, whereas the ultimate strength
reaches 90
ksi for materials SB-581 through SB-626, see Tab.1B, Division II, Part D (ASME,
2009b). To predict a correct transient response, the strain hardening effect is an important
part in a non-linear transient analysis as cyclic loading and possibly a shakedown process
are of main concern.
The strain hardening behaviour is better illustrated in Fig. 5, where two typical hardening
rules, i.e. isotropic and kinematic rules, associated with von Mises yield criteria are shown
on a deviatoric plane. In isotropic hardening, the von Mises yield surface expands in the
radial direction only during the development of the plastic deformation. (The “initial”
cylinder expands and forms the “current” one.) In kinematic hardening, however, the size
and shape of the yield surface remain unchanged, but the centre of the yield surface (the
central axis of the cylinder) moves during the development of the plastic deformation. (The
“initial” one moves and forms the “current” one.) In this way, the kinematic hardening rule
allows to include the Bauschinger’s effect. There is a third available rule which is a
combination of the isotropic and kinematic rules, and requires a more elaborated material
test-data when it should be used.
Fig. 5. Isotropic and kinematic hardening behavior on a deviatoric plane
Linear or multi-linear kinematic hardening models in commercial finite element software,
e.g. ANSYS or others, are frequently found to be used for non-linear piping analysis. It has
been, however, shown in recent reports by Rahman et al. (2008), Hassan et al. (2008) and
Krishna et al. (2009) that such non-linear finite element analyses can only provide a
reasonable modeling of plastic shakedown phenomena after a few initial load cycles. For
continuous ratcheting responses, such analyses cannot provide reasonable results, neither
for the accumulated local strain nor for the global dimension change. They showed through
experiments on straight and elbow pipe components that several nonlinear constitutive
Non-Linear Design Evaluation of Class 1-3 Nuclear Power Piping
173
models available in most general finite element software, such as Chaboche (1986), Ohno
and Wang (1993), and other more recently developed models (Abdel Karim and Ohno, 2000;
Bari and Hassan, 2002; Chen and Jiao, 2003) can provide a much improved prediction.
7. Concluding remarks
We have in this chapter categorized the design evaluation given in ASME III for nuclear
piping of Class 1, 2 and 3 into
the linear design and non-linear design evaluations. The
corresponding design requirements, in particular, those
non-linear design requirements, have
in the report been reviewed, analyzed and clarified in association with every defined load
set, through
Design Condition to Service Limit Level D. Efforts have been made to formulate
the
non-linear design evaluation requirements in a format so that they are easy to be
followed, understood and applied in connection with piping analysis.
The
non-linear design evaluation requires in principle two types of non-linear finite element
analyses: collapse-load analysis and non-linear transient analysis. We have in the chapter
attempted to describe in detail their computational aspects in a close accordance with the
requirements given in ASME III.
The design requirements given in ASME III for nuclear piping have been developed in more
than several decades. However, it has been a known issue that its formulation and
specification of design requirement items are far from fully clear, which are caused by
endlessly nested references in multiple levels to a large amount of contents. This is,
unfortunately, particularly true when design-by-analysis rules are considered. We hope this
chapter should be able to serve as a constructive source for a better understanding of and a
potential improvement for the design requirements for nuclear power piping.
8. Acknowledgement
This work is partially funded by ÅFORSK through Agreement Ref. No. 10-174, which is
gratefully acknowledged.
9. References
Abel Karim, M. and Ohno, N. (2000). Kinematic hardening model suitable for ratcheting
with steady state, Int. J. Plasticity, 16, 225-240.
ANSYS, Inc., (2010). ANSYS Mechanical – Users’ Manual (Version 13), USA.
ASME (2009a).
The American Society of Mechanical Engineers, ASME Boiler & Pressure Vessel
Code
, Section III, Division 1 – Subsections NB, NC, ND, NCA and Appendices.
ASME (2009b).
The American Society of Mechanical Engineers, ASME Boiler & Pressure Vessel
Code,
Section II, Part D.
Bathe, K. J. (1996).
Finite Element Procedures, Prentice Hall, Englewood Cliffs, NJ.
Crisfield, M. A. (1996).
Non-Linear Finite Element Analysis of Solids and Structures. Vol. 1
Essentials. Wiley Professional, UK.
Bari, S. and Hassan, T., (2002). AN advancement in cyclic plasticity modeling for multiaxial
ratcheting simulation, Int. J. Plasticity, 18, 873-894.
DST Computer Services S.A., (2005). PIPESTRESS User’s Manual, Version 3.5.1, 2005.
Slagis G. S. & Kitz, G. T. (1986). Commentary on Class 1 piping rules, PressureVessels,
Piping and Components – Design and Analysis, ASME PVP, Vol. 107, 1986.
Nuclear Power - System Simulations and Operation
174
Jansson, L. G. (1995). Non-linear analysis of a guide and its stitch welds for repeated
loading,
Computers & Structures, Vol. 56, No. 2/3.
Krishna, S., Hassan, T., Naceur, I. B., Sai, K., and Cailletaud, G., (2009). Macro versus micro-
scale constitute models in simulating proportaional and non-proportional cyclic
and ratcheting responses of stainless steel 304. Int. J. Plasticity, 25, 1910-1949.
Ohno, N. and Wang, J. D. (1993). Kinematic hardening rules with critical state of dynamic
recovery - Part I: formulation and basic features for ratcheting behavior. Int. J.
Plasticity, 9, 375-390.
Rahman S. M., Hanssan, T and Corona, E. (2008). Evaluation of cyclic plasticity models in
ratcheting simulation of straight pipes under cyclic bending and steady internal
pressure”, Int. J. Plasticity, 24, 1756-1791.
Slagis, G. S. (1987). Commentary on Class 2/3 piping rules, Design and Analysis of Piping,
PressureVessels and Components (Eds: W. E. Short II, A.A: Dermenjian, R.J.
McGrattan and S.K. BHandari) , ASME PVP, Vol. 120.
Zeng, L., (2007). Design verification of nuclear piping according to ASME III and required
nonlinear finite element analyses. (Internal report), ÅF-Engineering AB, Sweden.
Zeng, L., Horrigmoe, G. and Andersen, R., (1996). Numerical implementation of constitutive
integration of rate-independent plasticity, Int. J. Comput. Mech., Vol. 18, No. 5.
Zeng, L. and Jansson, L. G., (2008). Non-linear design verification of nuclear power piping
according to ASME III NB/NC, Proc. 16
th
Int. Conf. Nuclear Eng. (ICONE16),
Orlando, USA.
Zeng, L., Jansson, L. G. and Dahlström L. (2009). More on non-linear verification of nuclear
power piping according to ASME III NB/NC, Proc. 17
th
Int. Conf. Nuclear Eng.
(ICONE17), Brussels, Belgium.
Zeng, L., Jansson, L. G. and Dahlström L., (2010). On fatigue verification of Class 1 nuclear
power piping according to ASME III NB-3600. Proc. 18
th
Int. Conf. Nuclear Eng.
(ICONE18), Xi’an, China.
10
The Text-Mining Approach Towards Risk
Communication in Environmental Science
Akihide Kugo
Japan Atomic Energy Agency
Japan
1. Introduction
As the failure of waste management had endangered the public safety, public concerns and
awareness regarding waste disposal facilities which may bring dioxin pollution risk, PCB
risk and other toxic threat have grown so much. A long-life radioactive waste disposal
facility also becomes one of the public concerns. As the high level radioactive waste is not so
familiar with the public, it brings the sense of fear of unidentified materials among local.
Therefore, the site selection of high level radioactive waste (HLW) final disposal facility
faces much difficulty in the world except in Finland and Sweden.
If concerns of environmental topics of the daily life could be properly connected with
nuclear power issues, people would certainly be easy to participate in the discussion about
the necessity of such facilities.
Therefore, the author investigated the relationship between the nuclear power issues and
environmental topics such as household waste management or the precautionary principle
analyzed by text-mining method. In this method, the author conducted the investigation
cooperated with university students as subjects. The elements of this experiment consist of
lectures on environmental topics, keywords of each lecture submitted by the students, and
questionnaire survey result on nuclear power generation answered by the students.
Many researches on the risk communication regarding nuclear power issues have been
implemented. For example, Kugo analyzed the public comments and discussion by using a
text mining method (Kugo, 2005, 2008). Yoshikawa also introduced the researches on the
human interface of the computer-aided discussion board (Yoshikawa, 2007). These
researches aimed to grasp the representativeness of the public opinion by analyzing
majority of the subjects.
However, the problem that the research data were not necessary reliable in term of the
representativeness of the public because of the fluctuations of subjects’ opinion existed. For
example, a person has the tendency to make a decision in a heuristic way in case of
requiring a prompt answer. Therefore, the new point of the method of this analysis was that
the author did not include the information of the majority of the subjects but the minority
based on the assumption that the reliance of the information of minority subjects was higher
than those of the majority since the minority submitted the keywords without heuristic
decision making.
Nuclear Power - System Simulations and Operation
176
2. Method and result of analysis
First, the author gave lectures on the risk perception and desirable autonomous ideas in the
area of various environmental sciences including nuclear power generation issues at a
university class. Students submitted a keyword that they considered as the best
representative for each lecture. The keywords submitted were classified into two groups by
cluster analysis and correspondence analysis on the keywords-subjects cross table. These
analyses result to calculate the eigenvalue of the cross tabulation.
On this calculation process, every small part of the keywords-subjects cross table called a
cluster. A relative relation of a cluster could be grasped, plotting two compounds of the
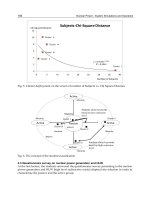
eigenvalue of clusters on the x-y axis position. Chi-square distance could easily be calculated
by using these x-y data. By chi-square distance from the centre, it could be majored of the
representativeness of the students.
This result of the analyses indicated that the keywords of frequent occurrence locate near
the centre of the chart and the keywords of less frequent occurrence locate at a
circumference part. Based on the keyword cluster deployment on the chart and its
characterization, the arrangement of the keyword cluster can be interpreted along with the
assumed mental model.
Students whose consciousness level was low would choose keywords that were easy to find
through the lectures (lecture titles, word appeared on the delivered documents, etc.). In that
case, the frequency of chosen keywords would be high because those keywords were
limited to in the documents. On the other hand, students whose consciousness level was a
little higher would choose keywords that were emotional or used in the discussion during
the lectures. If these keywords depended on the students internal idea, not limited to in the
documents, the frequency of these keywords occurrence would be less than that of
keywords chosen by low-consciousness level students. Thus, the author paid more attention
to the less frequency keywords and students who submitted these keywords.
Second, the author conducted the questionnaire research pertaining nuclear power
generation and high level radioactive waste (HLW) disposal management at the end of all
lectures. The concepts of the questionnaire consisted of necessity, approval for facility
installation, and acceptance of adjoining facility. The students selected number of answer
from “yes” to “no” by seven grades. Consequently, two groups of the students above
described were characterized by ANOVA (Analysis of Variance) respectively. One was
passive, and the other was active toward the attitude of acceptance of a nuclear facility.
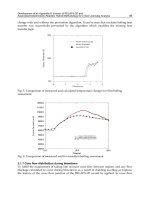
Third, by using keyword cross table, the author analyzed the correlation between the
keyword groups of the lecture at each theme. Thus, the communication points could be
extracted by paying attention to the correspondence of the pair of keywords chosen at two
themes of lectures. In this paper, the author shows the results of two cases such as keywords
group of the theme of nuclear power generation and household waste management, and the
theme of nuclear power generation and the precautionary principle as examples. The
concept of this correlation analysis shows in Figure 1.
2.1 Lectures on environmental science and keywords and assumed mental model
The students received the series of fifteen lectures (ninety minutes per a lecture) on
environmental science. In these lectures, they discussed various themes such as global
warming, waste problem, ozone hole, dioxin poison, radioactivity, precautionary principle,
The Text-Mining Approach Towards Risk Communication in Environmental Science
177
and some other themes. The basic concept of these discussions was that we should have
objective viewpoint not to avert the risk but to face it. After every lecture, students
submitted the most impressive keyword in the theme with a message of the reason. The
number of keywords was one hundred and sixty seven in total. The effective number of
students who attended the whole lecture was fifty.
Cluster I Cluster II Cluster III Cluster I
V
Cluster V Cluster VI
k
eyword
A
keyword Bkeyword
C
k
eyword
D
keyword E keyword F
Σx1i ΣX2i ΣX3i ΣX4i ΣX5i ΣX6i
10 1 5 1 2 1
keyword a ∑xi1 8 7 1
keyword b ∑xi2 5 1 3 1
keyword c ∑xi3 2 1 1
keyword d ∑xi4 2 1 1
-∑xi51 1
-∑xi61 1
Lecture II total
Lecture I
i
g
nor
pay attention
ignor
pay attention
Fig. 1. Concept of the keyword cross table analysis by the keywords of two lectures
Table 1 gives the themes of fifteen lectures and the number of the submitted keywords at
every lecture. In this research of the relationship between the theme of “nuclear power
generation” and “household waste management” and the relationship between the theme of
“nuclear power generation” and “the precautionary principle”, the author tried to find the
students’ common value in their internal mind. Table 2 shows the submitted keywords at
above designated three lectures.
Theme of Lecture Number of submitted keywor
d
#1
System of global environment 21 / 54 students
#2
Global warming 18 / 55
#3
Precautionary principle 13 / 57
#4
Dioxin 17 / 55
#5
Household Waste management 13 / 55
#6
Ecological footprint 10 / 56
#7
Ozone hole 9 / 53
#8
Energy 17 / 53
#9
Radioactivity 10 / 53
#10
Nuclear power generation 9 / 50
#11
Earthquake 9 / 49
#12
Environmental Sociology 11 / 46
#13
Safety and Relief 10 / 49
#14
Others - -
#15
Questionnaires survey - -
167 total
Table 1. Theme of lectures and the number of submitted keywords at every lecture
Nuclear Power - System Simulations and Operation
178
lecture on lecture on lecture on
Nuclear Power generation Househould Waste management the Precautionary principle
Friburg
(
the name of city) 3R(Reduce,Reuse,Recycle) Zero risk
MOX Fuel utilization in LWRs Quantity of disposal waste Dioxin
Nuclear fuel cycle Incentive Dioxin news report
Nuclear Power generation Globalization Risk
Nuclear energy revolution Discharge of the waste Problem of risk
Insecurity or understanding among citizen Plastics Risk communication
Renewable energy Recycle Risk management
Public opinion poll Circulative society Risk information
Radioactive waste Disposal cost Risk cognition
Thermal supply system Risk analysis
Waste Environmental hormone
Responsibility for disposal Dioxin concentration
Illegal disposal Precautionary principle
Table 2. The keywords at the designated lecture
The assumed basic mental model that consists of “instinct (inner part of mind)”, “emotion
(middle part of mind)”, and “reason (outer part of mind) shows in Figure 2.
Instinctive words
Emotional words
Rational words
Level of consciousness
Student selects a keyword that was easily found in the
book and the delivered documents at the class.
Student expresses their emotion in a
keyword.
Student rationally considers the subject of
discussion and selects a suitable keyword.
high
low
many less
Number of people
Fig. 2. The mental model of keywords chosen at the lecture (assumption)
If a student whose consciousness level was low submitted a keyword by request, he would
try to choose a keyword that was easy to find through the lectures (lecture titles, words
appeared in the book or the delivered documents, etc.). This action should be the
appearance of representative heuristic decision making, in other words. Consequently, the
frequency of occurrence of the keywords would be high.
On the other hand, students whose consciousness level was higher than the former would
choose keywords that were emotional or used in the discussion time. The frequency of
occurrence of these keywords would be less than that of keywords of low-consciousness
level students. These words were not limited to in the documents but depended on the
The Text-Mining Approach Towards Risk Communication in Environmental Science
179
students’ internal idea. If a student’s consciousness level were much higher than the other
levels, the frequency of their keywords would be less than those of keywords of students
whose consciousness levels were low or middle, since their keywords choice based on their
own opinion.
After the lecture on nuclear power generation, the author implemented correspondence
analysis and cluster analysis on the basis of “keywords - subjects cross table” in order to
apply the assumption of the above described mental model.
If the mental model were well, the words chosen by many students would be the title of the
lecture (i.e. nuclear power generation). The number of students who chose the keyword of
“nuclear power generation” was twenty-seven, which was the most. The number of
students who chose the keyword of “MOX Fuel utilization in LWRs” was eleven, which was
the second. The numerical information about the number of keywords submitted in the
lecture titled “nuclear power generation” shows in table 3.
In accordance with the assumed mental model, the keyword of “Insecurity or
understanding among citizen”, “Renewable energy”, Public opinion poll”, and “Nuclear
energy revolution” might carry the subjective image or the meaning of something
emotional. Conversely, “Nuclear power generation” and MOX fuel cycle”, “radioactive
waste” and “Friburg” might carry the objective image or neutral meaning. However, this
understanding remains vague for the student classification. Therefore, in order to
classify these keywords along with above described mental model, the author
implemented text-mining analysis described next section.
Keywords of the lecture titled by "nuclear power generation" Number of subjects
Nuclear power generation 27
MOX Fuel utilization in LWRs 11
Nuclear fuel cycle 3
Radioactive waste 3
Friburg (name of the city) 2
Insecurity or understanding among citizen 1
Natural renewable energy 1
Public opinion poll 1
Nuclear energy revolution 1
50
Table 3. Numerical information of keywords of the lecture on nuclear power generation
2.2 Text mining for keywords
The method of textual data mining was useful for analyzing public opinion. Ohsumi and
Levert reported the results of textual data mining method (Ohsumi and Levert, 2000). The
summary of the text mining method that consists of cluster analysis and correspondence
analysis shows below.
Every lecture gave the information of keyword list and their occurrences. This frequency of
occurrence data calls a contingency table. This “m×n” contingency table indicates
frequencies of the appearances of “n” different keywords of “m” different students in the
class.
Nuclear Power - System Simulations and Operation
180
In other words, the co-occurrence data represent a matrix X which has m rows and n
columns, or “m×n-dimensional vector F”.
(
)
(
)
0, ,
ij ij
mn
f
fiIjJ
×
=
≥∈∈F
{
}
{
}
1,2, , , 1,2, ,ImJn==
By using Chi-square statistics, the dimension of deviations from the expected values can be
identified.
Profiles:
(
)
()
()
()
()
()
,
IJ ij
Ii
Jj
PPiIjJ
PdiagP iI
PdiagP jJ
+
+
=∈∈
=∈
=∈
diag : diagonal matrix
()
11
1
1
,
,
mn
ij
ij ij
ij
n
m
ij
i
j
jj
i
i
ij
f
PN ff
N
f
f
f
f
PP
NN NN
++
==
=+
+
=
++
⎛⎞
== ≡
⎜⎟
⎜⎟
⎜⎟
⎜⎟
⎜⎟
⎜⎟
== ==
⎝⎠
∑∑
∑
∑
The data matrix (
Matrix X (m, n)) shows below based on above matrix or two-way table.
()
()
,
ij ij
i
j
i
jjj
mn
ij j
pq
xiIjJ x p p
pp p
+
+
×
++ +
=∈∈ = −=−X
Matrix X (m, n) is the same for the equation below.
()
()
()
, 0, 0; 0, 0
ij ij
ij ij i j i j
mn
ij ij
pf
yiIjJ y p p f f
pp ff
++ ++
×
++ ++
=∈∈ = = ≠≠≠≠Q
Then,
Matrix Q (m, n) replaced like below.
1/2 1/2
IIJJ
mn×
=QPPP
Consequently,
Matrix V (m, n) attributes to extracting an eigenvalue.
1/2 1 1/2
JJIIIJJ
mn
−−
×
′
=VQQ=P PPPP
Q transposed matrix Q
P transposed matrix P
t
J
IIJ
⎛⎞
=
⎜⎟
⎜⎟
=
⎝⎠
Row and column coordinates can be plotted on the single screen by using component scores
such as (Z
ik
, Z
ik’
) and (Z*
ik
, Z*
ik’
).
()
()
1
1
1
, 1,2, ,
1
, 1,2, , : ei
g
envalue
n
ij
ik jk
i
j
k
m
ij
jk ik
j
i
k
P
zziIkK
P
P
zzjJkK
P
λ
λ
λ
∗
+
=
∗
+
=
⎛⎞
=∈=
⎜⎟
⎜⎟
⎝⎠
⎛⎞
⎜⎟
=∈=
⎜⎟
⎝⎠
∑
∑
The graphic presentation based on above calculation clearly shows the relationships
between the keywords and students, with distance on the map being a representation of
correspondence.
The Text-Mining Approach Towards Risk Communication in Environmental Science
181
Such plotting does not indicate the relationship between row points and column points but
only the distances between row and column points.
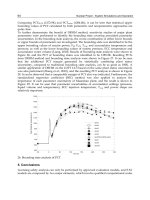
The result of analysis shows Table 4 that indicates the numerical information of the clusters
and Table 5 that indicates the numerical information of the keywords. It also illustrates on
the graphs shown in Figure3 and Figure 4. As shown in Table 4 and Table 5, fifty students
were divided into five groups; the nine keywords were divided into five clusters in other
words. Namely, The largest cluster of “I” (Cluster I) contains two keywords such as “the
nuclear power generation” (theme of the lecture) and “MOX Fuel utilization in LWRs (Plu-
thermal)” chosen by thirty-eight students. It should be safe to say that Cluster I represented
the group of students who had chosen instinctive keywords. Therefore, Cluster I located in
the vicinity of the centre by Chi-Square Distance (0.20).
The second cluster of “II” (Cluster II) contained only a keyword such as “insecurity or
understanding
among the citizen” that was chosen by a student. This cluster located far
from the centre by Chi-Square Distance (3.68).
The third cluster of “III” (Cluster III) contained two keywords such as “nuclear energy
revolution” and “Freiburg” that were chosen by three students. This cluster located more
distant from the centre by Chi-Square Distance (5.57).
The fourth cluster of “IV” (Cluster IV) that contained three keywords such as “renewable
energy”, “radioactive waste” and “public opinion poll” that were chosen by five students.
This cluster located far from the centre by Chi-Square Distance (7.92).
The fifth cluster of “V” (Cluster V) that contained only a keyword such as “nuclear fuel
cycle” that was chosen by three students. This cluster located in the longest distance from
the centre by Chi-Square Distance (10.07).
The relation between the Chi-Square Distance of each cluster and the number of student that
belonged to the cluster shows in Figure 5.
Then, author interpreted the meaning of cluster deployment on the screen as follows.
The keyword of the title of the lecture (“nuclear power generation”) was chosen
heuristically by most of the students. Therefore, the students who belong to the Cluster I did
not have considered the theme so seriously. The author concluded Cluster I as an instinctive
group. The keywords of “insecurity/understanding among citizen” (Cluster II) and
“nuclear energy revolution” (Cluster III) could be holding the connotation of unstable
condition. Students who belonged to these clusters must have expressed their emotion
towards the subject of discussion. Thus, Cluster II and Cluster III that contained the
emotional keywords were categorized into non rational groups. On the other hand, Cluster
IV that contained the keywords of “renewable energy”, “radioactive waste”, “public opinion
poll”, and Cluster V that contained “nuclear fuel cycle” hold no subjective message.
Students who belonged to these clusters must have grasped the topic of discussion and have
expressed their result of consideration. Thus, the author concluded these Cluster IV and
Cluster V as rational groups.
The curve of Number of Subjects – Chi square Distance relationship shown in Figure 5 had
the consistency with the assumption of the mental model shown in Figure 2.
As the author considered the assumed mental model fit well, the author could classify the
students into two groups along with the cluster deployment to investigate the attractive
discussion points. The students who belonged to “Cluster I”, “Cluster II”, and “Cluster III”
named the Passive group. The students who belonged to “Cluster IV” and “Cluster V” named
the Active group. The concept of this classification shows in Figure 6.
Nuclear Power - System Simulations and Operation
182
The author investigated the difference in an attitude between Active group and Passive group
by using questionnaire survey, which referred nuclear power generation and radioactive
waste management, as described in the next section.
Number of
subjects
Chi-squqre
distance
x-axis y-axis
Variation
within a
cluster
Portion of
cluster
size
Cluster I 38 0.20 -0.11 0.44 0.011 0.22
Cluster II 1 3.68 1.47 -1.24 0.000 0.11
Cluster III 3 5.57 -2.31 -0.46 0.015 0.22
Cluster IV 5 7.92 0.02 -2.81 0.017 0.33
Cluster V 3 10.07 3.17 0.04 0.000 0.11
total 50 - - - 0.032 1.00
Table 4. Numerical information of the clusters of the keywords at the lecture on "nuclear
power generation", based on the cluster analysis
Cluster I
Cluster II
Cluster III
Cluster IV
Cluster V
-4
-3
-2
-1
0
1
2
3
4
-5-4-3-2-1012345
Clusters
Fig. 3. Cluster deployment based on the cluster analysis of the keywords submitted at the
lecture on “nuclear power generation”. The area of the circle shows the number of students
The Text-Mining Approach Towards Risk Communication in Environmental Science
183
Keyword
Portion of
keyword
size
Number
of
sub
j
ects
Chi-
square
distance
x-axis y-axis
Nuclear Power generation 0.54 27 0.9 -0.08 0.51
MOX Fuel utilization in
LWRs (Plu-thermal)
0.22 11 3.6 -0.18 0.27
Insecurity or understanding
ii
0.02 1 49.0 1.47 -1.24
Nuclear energy revolution 0.02 1 49.0 -1.74 -0.04
Friburg (name of city) 0.04 2 24.0 -2.60 -0.67
Renewable energy 0.02 1 49.0 -0.13 -2.39
Public opinion poll 0.02 1 49.0 0.68 -3.12
Radioactive waste 0.06 3 15.7 -0.15 -2.85
Nuclear fuel cycle 0.06 3 15.7 3.17 0.04
total: 9 1.00 50
Cluster IV
Cluster V
Cluster
Cluster I
Cluster II
Cluster III
Table 5. Numerical information based on the cluster analysis of the keywords submitted at
the lecture on "nuclear power generation”
Nuclear power
generation
MOX Fuel
utilization
Insequrity or
understanding
among citizen
Nuclear energy
revolution
Friburg
Natural
renewable
energy
Public opinion
poll
Radioactive
waste
Nuclea fuel
cycle
-4
-3
-2
-1
0
1
2
3
4
-4-3-2-101234
Keywords
Fig. 4. Keywords deployment based on the cluster analysis of the keywords submitted at the
lecture of “nuclear power generation”