FINANCIAL AUDIT OF THE DEPARTMENT OF HUMAN SERVICES STATE OF HAWAII Fiscal Year Ended June 30, 2009_part2 pdf
Bạn đang xem bản rút gọn của tài liệu. Xem và tải ngay bản đầy đủ của tài liệu tại đây (1.51 MB, 11 trang )
Department
of
Human
Services
State
of
Hawaii
MANAGEMENT'S DISCUSSION AND ANALYSIS
(Continued)
Fiscal
Year
Ended
June
30, 2009
FINANCIAL
ANALYSIS OF THE GOVERNMENT-WIDE FINANCIAL STATEMENTS
The following table presents a condensed government-wide statement
of
net assets
of
the DHS
as
of
June 30, 2009 and 2008.
Condensed
Statement
of
Net
Assets
2009 2008
Current assets
$ 227,567,322 $
206,084,724
Capital assets, net
38,691,111
40,694,125
Total assets
$
266,258,433
$
246,778,849
Current liabilities
$
285,887,788 $ 228,951,037
Non-current liabilities
10,638,729 10,366,228
Total liabilities
296,526,517 239,317,265
Net assets
Invested in capital assets
38,691,111
40,694,125
Restricted 2,100,110 1,462,028
Unrestricted deficit
(71,059,305) (34,694,569)
Total net assets (deficit in)
(30,268,084) 7,461,584
Total liabilities and net assets
$
266,258,433
$
246,778,849
As noted earlier, an analysis
of
net assets over time may be a useful indicator
of
whether a
government entity's financial condition is growing stronger
or
weakening. During the fiscal year
ended June 30, 2009, the combined net assets
of
the DHS decreased by approximately $37.7
million.
The deficit in unrestricted net assets
of
the DHS was approximately
$71
million as
of
June 30, 2009. This deficit in unrestricted net assets is principally the result
of
liabilities for
program services that were incurred as
of
June 30, 2009, for which state allotments are not yet
available. The largest liability as
of
June 30, 2009, is the estimated amount
of
medical
assistance service provided as
of
June 30, 2009, for which the related claims and capitation
fees will
be
processed and paid SUbsequently.
Of
the estimated $209.2 million of medical
assistance payable, the state share
of
these costs is approximately $68.3 million. The estimated
federal share
of
these costs to be paid in the future was recorded as intergovernmental
revenues in the current fiscal year and is included in the balance due from other governments.
In addition to the estimated medical assistance payable, the liability for compensated absences
totaling $16.5 million as
of
June
30,2009,
is not funded by state allotments until the employee
uses the earned leave or is paid out upon termination. Therefore, there are no assets currently
available to the DHS to pay for these liabilities as
of
June 30, 2009.
12
This is trial version
www.adultpdf.com
Department
of
Human Services
State
of
Hawaii
MANAGEMENT'S DISCUSSION AND ANALYSIS (Continued)
Fiscal Year Ended
June
30, 2009
The DHS reported a total of approximately $38.7 million
in
net assets invested
in
capital assets
as
of
June
30,
2009. AlthoUgh the DHS
is
not the legal owner of the state buildings that are
reported as part of its capital assets, the portion of the state facilities used by the DHS are
required to
be
reported
as
part of its capital assets. The DHS uses these capital assets to
provide services; consequently, these assets are not available for future spending and the
related annual depreciation expense of the cost of these facilities
is
included
in
the statement of
activities for the fiscal year ended June
30,
2009.
The changes
in
the net assets of the DHS from governmental activities are summarized below.
The DHS directs its resources towards assisting people to meet their basic needs for food,
shelter, medical care and other essentials for daily living. As such, the DHS does not conduct
business-type activities and the accompanying analysis of the changes
in
net assets focuses
on
the cost of services and who provides the funds to pay for the costs.
Changes
in
Net
Assets
Percent
2009
2008
Change
Revenues
Program revenues $ 1,438,627,284
$
1,127,375,107
27.61
%
General revenues
704,630,309 792,666,479
(11.11)
%
Total revenues
2,143,257,593 1,920,041,586
11.63
%
Expenses
Health care programs 1,416,740,049
1,216,926,710 16.42
%
General welfare assistance, employment
and support services 532,569,746 444,635,264
19.80
%
Child welfare and adult community
care services
167,333,630 172,630,298
(3.07)
%
Vocational rehabilitation and
services for the blind
27,593,427 29,098,769 (5.17)
%
Youth prevention, deliquency
and correction services
24,277,120
22,078,786
9.96
%
General administration
12,362,674
12,068,584 2.44 %
Commission
on
the status of women!
commission
on
fatherhood
123,155
175,123
(29.68)
%
Total expenses
2,180,999,801
1,897,613,534
14.93
%
Change
in
net assets,
before transfers
$
(37,742,208)
$
22,428,052
13
This is trial version
www.adultpdf.com
Department of Human Services
State of Hawaii
MANAGEMENT'S DISCUSSION AND ANALYSIS (Continued)
Fiscal Year Ended June
30, 2009
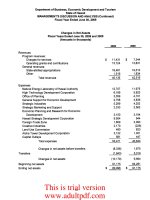
The total cost of all programs and services was approximately $2.2 billion, a 14.93% increase
from the prior fiscal year. Health care and general welfare assistance programs comprised
64.96% and 24.42%, respectively, of the total costs. The following chart presents each major
activity as a percent of the total cost of all DHS activities:
Health care
programs
64.9%
Commission
on the
status
of
women/commission
on
fatherhood
0.0%
General
administration
~
0.6%
Youth prevention,
deliquency and
correction
services
1.1%
l
Child welfare and
adult
community care
Vocational rehabilitation 7.7%
and services
for
the blind
1.3%
14
General welfare
assistance, employment
and
support
services
24.4%
This is trial version
www.adultpdf.com
Department of Human Services
State of Hawaii
MANAGEMENT'S DISCUSSION AND ANALYSIS (Continued)
Fiscal Year Ended June
30,2009
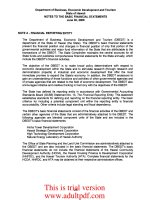
Program revenues consist primarily of operating grants from the federal government. Revenues
from these federal grants paid for 66.0% of the cost of
all
the
DHS's activities. The following
chart presents the percentage of costs funded
by
federal grants for each major activity of the
DHS for the fiscal years ended June
30,
2009
and
2008:
Fiscal Year 2009
100%
80%
60%
40%
20%
0%
-1 Il:.
__
L-
__
L-
__
L-_ li: _ I
__
I!
__
L
__
ll: _-1_ , _
Health care
programs
Fiscal Year 2008
General welfare
assistance,
employment and
support services
Child welfare
and adult
community care
services
Vocational
rehabilitation
and services for
the blind
Youth
prevention,
deliquency and
correction
services
General
administration
and other
100%
80%
60%
40%
20%
0%-1 " ' Jl L L ' L ' ' L r
Health care
programs
General welfare
assistance,
employment and
support services
Child welfare
and adult
community care
services
15
Vocational
rehabilitation
and services for
the blind
Youth
prevention,
deliquency and
correction
services
General
administration
and other
This is trial version
www.adultpdf.com
Department
of
Human Services
State
of
Hawaii
MANAGEMENT'S DISCUSSION AND ANALYSIS (Continued)
Fiscal Year Ended
June
30, 2009
FINANCIAL ANALYSIS OF THE FUND FINANCIAL STATEMENTS
As noted earlier, the
DHS
uses fund accounting to ensure
and
demonstrate compliance with
finance-related legal requirements. The
DHS
has two governmental fund types; the general fund
and special revenue funds. The general fund
is
used to account for all financial resources
except those required to
be
accounted for
in
another fund. The special revenue funds are
used
to account for the proceeds of specific revenue sources that are legally restricted
to
expenditures for specified purposes.
In
general, operating grants the
DHS
receives from
the
federal government are accounted for
in
the special revenue funds and all allotments of state
funds are accounted for
in
the general fund along with any other resources available to the
DHS
that are not accounted for
in
the special revenue funds.
Total expenditures reported
on
a modified accrual basis increased
by
$281.4 million over the
prior fiscal year. This increase
is
primarily related to health
care
program costs and general
welfare assistance, employment and support services costs administered
by
the
DHS
which
have increased
by
approximately $199.9 million or 16.4% and
$87
million or 19.58%,
respectively.
In
February 2009, the fee for service program was converted to the Ques
Expanded Access (QExA) managed care program. Aside from the monthly capitation payments
for QExA, the remaining claims for the fee for service program were also processed. Under the
QExA program fee for service claims will decrease
in
future years. The Supplemental Nutrition
Assistance Program payments increased for the fiscal year 2009, accounting for the majority of
the increase
in
the general welfare assistance, employment
and
support services costs.
At June
30,
2009, the total governmental fund balance of the
DHS
consisted of a deficit
in
unreserved fund balance of approximately $163.5 million. The deficit
in
the unreserved fund
balance of the general fund totaling $68.9 million
is
principally comprised of liabilities for
program services that were incurred as of June
30,
2009, for which state allotments were not
yet available. The deficit
in
the unreserved fund balance of the special revenue funds totaling
$94.6 million
is
principally the result of encumbrances that were not liabilities
as
of
June
30,
2009, and, therefore, the related intergovernmental revenues were not recorded.
Reservations of governmental fund balances for encumbrances totaled approximately
$111.1
million at June
30,
2009. Reservations of governmental fund balances indicate the amount of
resources that are not available for new spending because
it
has been reserved to liquidate
purchase and contractual commitments.
The following table presents total revenues and expenditures of the governmental funds of the
DHS for the fiscal years ended June
30,
2009 and 2008:
REVENUES
State allotted appropriations
Intergovernmental revenues
Non-imposed employee fringe benefits
Total
2009
$ 679,001,321 $
1,438,627,284
25,628,988
$ 2,143,257,593 $
16
2008
769,603,784
1,127,375,107
23,062,695
1,920,041,586
Percent
Change
(11.77) %
27.61
%
11.13 %
11.63 %
This is trial version
www.adultpdf.com
Department
of
Human Services
State
of
Hawaii
MANAGEMENT'S DISCUSSION AND ANALYSIS (Continued)
Fiscal Year Ended
June
30, 2009
Percent
2009
2008 Change
EXPENDITURES
Health care programs
$
1,416,591,781
$
1,216,613,055
16.44
%
General welfare assistance, employment
and support services
531,588,459
444,530,029
19.58
%
Child welfare and adult community
care services
166,620,741 172,981,946
(3.68)
%
Vocational rehabilitation and
services for the blind
27,426,109 28,950,428
(5.27)
%
Youth prevention, delinquency
and correction services
23,608,972 21,306,524
10.81
%
General administration
12,365,069 12,332,501
0.26
%
Commission on the status
of
womenl
commission on fatherhood
123,155 175,123
(29.68)
%
Total
$
2,178,324,286
$
1,896,889,606 14.84 %
BUDGETARY ANALYSIS
As required
by
Section 37-68, Hawaii Revised Statutes, the
DHS
prepares a budget that
becomes legally adopted when the State Legislature approves the executive budget with the
enactment of
an
appropriations act. A comparison and analysis of the general fund is presented
below as additional financial information:
Actual on Variance
Budgetary Favorable
Original Budget Final Budget Basis
(U
nfavorable)
Health care programs
$ 566,458,872
$ 486,984,224
$ 403,621,376 $ 83,362,848
General welfare assistance,
employment and support services
118,149,930
118,149,930
113,748,254 4,401,676
Child welfare and adult
community care services
99,189,767
96,588,198
93,265,043 3,323,155
Youth prevention, delinquency
and correction services
17,588,347
17,858,347
17,202,359 655,988
General administration
4,894,274 9,535,401
9,215,583 319,818
Vocational rehabilitation and
services for the blind 4,085,181
4,118,261
4,048,372
69,889
Commission on the status
of
womenl
commission on fatherhood
158,079 158,079
119,168
38,911
$ 810,524,450 $ 733,392,440
$ 641,220,155
$ 92,172,285
17
This is trial version
www.adultpdf.com
Department
of
Human Services
State
of
Hawaii
MANAGEMENT'S DISCUSSION AND ANALYSIS (Continued)
Fiscal Year Ended
June
30, 2009
The differences between the original and final budget for the individual programs were due to
intrafund transfers.
Planned expenditures for May and June 2009 of approximately $83.4 million for the health care
programs were deferred and lapsed to the State Treasury. Thus the amounts expended
in
comparison to the amounts bUdgeted appear favorable.
CAPITAL ASSETS
As of June 30, 2009 and 2008, the cost basis of capital assets, net of accumulated depreciation,
used
by
the DHS are presented
in
the table below. Approximately $1.7 million of capital assets
were added in the fiscal year ended June
30,
2009. Annual depreciation totaling approximately·
$2.7 million decreased the net cost basis during the fiscal year ended June 30,2009.
Capital Assets, Net
of
Depreciation
2009
2008
State office buildings and improvements $ 15,844,457 $ 15,937,021
Buildings and improvements for
the Office of Youth Services
11,805,623
13,331,354
Total buildings and improvements 27,650,080
29,268,375
Furniture, equipment and vehicles 11,041,025 11,425,744
Nondepreciable land
6
6
Total
$
38,691,111
$
40,694,125
In
addition to the capital assets listed above, the DHS leases numerous office facilities from
third-party lessors under operating lease arrangements. Those leases for additional space
beyond the state facilities listed above
as
buildings and improvements are necessary to provide
program services throughout the State.
ECONOMIC FACTORS
The DHS has three primary types of welfare assistance programs: (1) financial assistance
in
the
form of cash benefits; (2) food stamp assistance that
is
also delivered
in
the form of cash
benefits; and (3) medical assistance
in
the form of Medicaid fee-for-service coverage or
managed care medical coverage under the Quest program. Individuals, couples and families
may
be
eligible for one or all of these forms of assistance. However, eligibility for one program
does not automatically make
an
individual/family eligible for other programs. The DHS tracks
eligible individuals, couples or families
as
a single case (caseload).
18
This is trial version
www.adultpdf.com
Department
of
Human Services
State
of
Hawaii
MANAGEMENT'S DISCUSSION AND ANALYSIS (Continued)
Fiscal Year Ended
June
30, 2009
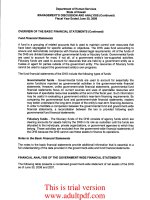
The average monthly financial assistance caseload was
in
a steady downward trend over the
past ten years starting
in
1998. Then,
in
fiscal year 2009, caseload started to increase over the
previous fiscal year (see figure
1).
More recently, the number of individuals receiving financial
assistance
in
Hawaii has trended flat
on
a month-to-month basis from January
to
December
2009 (see figure
2).
A total of 31,978 individuals were receiving financial assistance
in
December 2009 as compared
to
31,945
in
the same month
in
2008. The economic downturn
nationally has negatively impacted Hawaii's economy which
is
dominated
by
tourism and
is
highly dependent
on
revenue from visitor expenditures. Hawaii, like many other states, faces
challenges of high unemployment, layoffs, and reduced work hours for its residents. Future
trends
in
the number of individuals receiving financial assistance will depend
on
the pace and
timing of economic recovery both locally and at the national level.
The number of individuals
in
Hawaii receiving Supplemental Nutrition Assistance Program
(SNAP), formerly known as Food Stamp Program, benefits have been
on
a steep upward trend
from 88,171
in
April 2007, to 134,021
in
December 2009 which
is
an
increase of 45,850
individuals or
51
%.
Just
in
the past twelve months from December 2008 to the same month
in
2009, individuals receiving SNAP benefits have increased by 25,049 or 23%. The increase
in
individuals receiving SNAP benefits
is
attributed to Hawaii's declining economy and high
unemployment rates. The increase can also
be
attributed to additional funding for state SNAP
programs provided
by
the American Recovery and Reinvestment Act of 2009 (ARRA).
ANAf>.CIAL ASSISTAf>.CE Af\N lAL
AVffiAGE
MONTI-LY
CASe-OAD
BY
STATE
ASCAL
YEAR
38000
,
33000
+ ~ ____,~
23000
+ ~;;:__ ~ ~
28000
18000
+ x.
~=_
13000
+ _.,_ r r , ~ ,-_r_.______r___,__,_,_,_____,, _,____,._,._,._.,_.,._.,._.,.__.,_""T""""""1
1980
1982
1984
1986
1988 1990
1992
1994
1996
1998
2000 2002 2004
2006
2008
EFFECTIVE
SFY
1990
THE
STANDARD
OF
ASSISTANCE
WAS
INCREASED
ANNUALLY
UNTIL
SFY
1995.
Financial
Assistance
Includes
the
TANF,TAONF,ABD,
and
GA
Programs.
19
This is trial version
www.adultpdf.com
Department of Human Services
State of Hawaii
MANAGEMENT'S DISCUSSION AND ANALYSIS (Continued)
Fiscal Year Ended June 30, 2009
Figure 2.
F1NAIICIAL ASSlSTAIICEMONn
Y
INlVIDUALS
JLL
Y2000
TO
HE
PRESENT
80,000
70,000
60,000
50,000
40,000
30,000
20,000
Jul-OO
Ma Ol Nov-Ol JuI-02 Ma 03 Nov-03 JuI-04 Ma 05 Nov-05 Jul-06
Ma 07
Nov-07
Jul-OB
Ma 09 Nov-09
Financial Assistance includes the TAN=,TAQIIF,AI3D, and GA Programs.
Figure
3.
FOOD
STAMP
MONTH Y INlVICl.IALS
JLL
Y2000
TO
HE
PRESENT
140,000
130,000
120,000
110,000
100,000
90,000
80,000
Jul-OO
Ma Ol Nov-Ol JuI-02 Ma 03 Nov-03 Jul-04
Ma 05
Nov-05 Jul-06 Ma 07 Nov-07
Jul-OB
Ma 09 Nov-09
20
This is trial version
www.adultpdf.com
Department
of
Human Services
State
of
Hawaii
STATEMENT OF NET ASSETS
June
30, 2009
ASSETS
Cash and cash equivalents
Receivables
Due from other governments
Total current assets
Capital assets, net of accumulated depreciation
Total assets
LIABILITIES
Vouchers payable
Accrued wages and employee benefits payable
Due to State general fund
Due to other state agencies
Accrued medical assistance payable
Accrued compensated absences
Total current liabilities
Accrued compensated absences, less current portion
Total liabilities
NET ASSETS
Invested
in
capital assets, net
of
related debt
Restricted
Unrestricted (deficit)
Total net assets
Total liabilities and net assets
See accompanying notes to the basic financial statements.
21
$
53,694,530
7,965,202
165,907,590
227,567,322
38,691,111
$
266,258,433
$ 9,242,818
9,883,962
2,090,992
49,540,016
209,230,000
5,900,000
285,887,788
10,638,729
296,526,517
38,691,111
2,100,110
(71,059,305)
(30,268,084)
$ 266,258,433
This is trial version
www.adultpdf.com
-
__
_ _._ _ _.
Department
of
Human Services
State
of
Hawaii
STATEMENT
OF
ACTIVITIES
Fiscal Year Ended June
30,
2009
Program Revenues
Functions/Programs Expenses
Charges
for
Services
Operating
Grants and
Contributions
Net (Expenses)
Revenue and Changes
in Net Assets
$
$
932,044,704
$
414,216,915
68,334,137
21,111,106
2,920,422
Governmental activities:
Health care programs
General welfare assistance, employment and support services
Child welfare and adult community care services
Vocational rehabilitation and services for the blind
Youth prevention, delinquency and correction services
General administration
Commission on the status
of
women / commission on fatherhood
Total governmental activities
$
$
1,416,740,049
532,569,746
167,333,630
27,593,427
24,277,120
12,362,674
123,155
2,180,999,801
$
$
1,438,627,284 $
(484,695,345)
(118,352,831)
(98,999,493)
(6,482,321 )
(21,356,698)
(12,362,674)
(123,155)
(742,372,517)
General revenues:
State allotments, net
of
lapsed appropriations
Nonimposed employee fringe benefits
Total general revenues
Transfers
Change in net assets
Net assets
at
July
1,
2008
Deficit in net assets
at
June
30,
2009 $
679,001,321
25,628,988
704,630,309
12,540
(37,729,668)
7,461,584
(30,268,084)
See accompanying notes to the basic financial statements.
This is trial version
www.adultpdf.com