Financial Statement Analysis doc
Bạn đang xem bản rút gọn của tài liệu. Xem và tải ngay bản đầy đủ của tài liệu tại đây (173.24 KB, 52 trang )
Financial Statement
Analysis
Chapter 18
The Annual Report
Usually Contains
…financial statements.
–
notes to the financial statements.
–
a summary of accounting methods used.
–
management discussion and analysis of the
financial statements.
–
an auditor’s report.
–
comparative financial data for 5 to 10
years.
Objective 1
Perform a Horizontal
Analysis
of Financial Statements.
Horizontal Analysis
Increase/(Decrease)
2005 2004 Amount Percent
Sales $41,500 $37,850 $3,650 9.6%
Expenses 40,000 36,900 3,100 8.4%
Net income 1,500 950 550 57.9%
2005 2004 Difference
Sales $41,500 $37,850 $3,650
$3,650 ÷ $37,850 = .0964, or 9.6%
Horizontal Analysis
Trend Percentages
…are computed by selecting a base year
whose amounts are set equal to 100%.
•
The amounts of each following year are
expressed as a percentage of the base
amount.
Trend % = Any year $ ÷ Base year $
Year 2005 2004 2003
Revenues $27,611 $24,215 $21,718
Cost of sales 15,318 14,709 13,049
Gross profit $12,293 $ 9,506 $ 8,669
2003 is the base year.
What are the trend percentages?
Trend Percentages
Year 2005 2004 2003
Revenues 127% 111% 100%
Cost of sales 117% 113% 100%
Gross profit 142% 110% 100%
Trend Percentages
These percentages were calculated by
dividing each item by the base year.
Objective 2
Perform a Vertical
Analysis
of Financial Statements.
Vertical Analysis
…compares each item in a financial
statement to a base number set to 100%.
•
Every item on the financial statement is
then reported as a percentage of that base.
Vertical Analysis
2005 %
Revenues $38,303 100.0
Cost of sales 19,688 51.4
Gross profit $18,615 48.6
Total operating expenses 13,209 34.5
Operating income $ 5,406 14.1
Other income 2,187 5.7
Income before taxes $ 7,593 19.8
Income taxes 2,827 7.4
Net income $ 4,766 12.4
Vertical Analysis
Assets 2005 %
Current assets:
Cash $ 1,816 4.7
Receivables net 10,438 26.9
Inventories 6,151 15.9
Prepaid expenses 3,526 9.1
Total current assets $21,931 56.6
Plant and equipment, net 6,847 17.7
Other assets 9,997 25.7
Total assets $38,775 100.0
Objective 3
Understand
Benchmarking
Common-size Statements
•
On the income statement, each item is
expressed as a percentage of net sales.
•
On the balance sheet, the common size is
the total on each side of the accounting
equation.
•
Common-size statements are used to
compare one company to other companies,
and to the industry average.
Benchmarking
43.0%
38.2%
8.0%
10.8%
51.4%
28.8%
7.4%
12.4%
Percent of Net Sales
MCILucent Technologies
Cost of goods sold Operating
expenses
Income tax Net income
Objective 4
Using
Ratios
Ratio Classification
1
Measuring ability to pay current liabilities
2
Measuring ability to sell inventory and
collect receivables
3
Measuring ability to pay short-term and
long-term debt
4
Measuring profitability
5
Analyzing stock as an investment
Palisades Furniture Example
Net sales (Year 2005) $858,000
Cost of goods sold 513,000
Gross profit $345,000
Total operating expenses 244,000
Operating income $101,000
Interest revenue 4,000
Interest expense (24,000)
Income before taxes $ 81,000
Income taxes 33,000
Net income $ 48,000
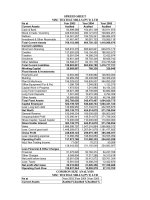
Palisades Furniture Example
Assets 20x5 20x4
Current assets:
Cash $ 29,000 $ 32,000
Receivables net 114,000 85,000
Inventories 113,000 111,000
Prepaid expenses 6,000 8,000
Total current assets $262,000 $236,000
Long-term investments 18,000 9,000
Plant and equipment, net 507,000 399,000
Total assets $787,000 $644,000
Palisades Furniture Example
Liabilities 20x5 20x4
Current liabilities:
Notes payable $ 42,000 $ 27,000
Accounts payable 73,000 68,000
Accrued liabilities 27,000 31,000
Total current liabilities $142,000 $126,000
Long-term debt 289,000 198,000
Total liabilities $431,000 $324,000
Stockholders’ Equity 20x5 20x4
Common stock, no par $186,000 $186,000
Retained earnings 170,000 134,000
Total stockholders’ equity $356,000 $320,000
Total liabilities and
stockholders’ equity $787,000 $644,000
Palisades Furniture Example
Current ratio =
Total current assets ÷ Total current liabilities
The current ratio measures
the company’s ability to pay
current liabilities with current assets.
Measuring Ability to
Pay Current Liabilities
Measuring Ability to
Pay Current Liabilities
•
Palisades’ current ratio:
•
20x4: $236,000 ÷ $126,000 = 1.87
•
20x5: $262,000 ÷ $142,000 = 1.85
•
The industry average is 1.50.
•
The current ratio decreased slightly
during 20x5.
Acid-test ratio =
(Cash + Short-term investments
+ Net current receivables)
÷ Total current liabilities
Measuring Ability to
Pay Current Liabilities
The acid-test ratio shows the company’s
ability to pay all current liabilities
if they come due immediately.
Measuring Ability to
Pay Current Liabilities
•
Palisades’ acid-test ratio:
•
20x4: ($32,000 + $85,000) ÷ $126,000 = .
93
•
20x5: ($29,000 + $114,000) ÷ $142,000 =
1.01
•
The industry average is .40.
•
The company’s acid-test ratio improved
considerably during 20x5.