Advances in Modern Woven Fabrics Technology Part 9 ppt
Bạn đang xem bản rút gọn của tài liệu. Xem và tải ngay bản đầy đủ của tài liệu tại đây (1.75 MB, 20 trang )
Color and Weave Relationship in Woven Fabrics
149
Friele, L.C.F. 1965, "The application of colour measurement in relation to fibre-blending",
Journal of Textile Institute, vol. 43, pp. 604.
Gabrijelcic, H. 2004, "ITMA 2003 – CAD/CAM Systems for Weaving", Tekstilec, vol. 47, no.
3-4, pp. 95-104.
Gabrijelcic, H. & Dimitrovski, K. 2004, "Influence of yarn count and warp and weft thread
density on color values of woven surface", Fibers and Textiles in Eastern Europe,
vol. 12, no. 1(45), pp. 32-39.
Grundler, D. & Rolich, T. 2003, "Matching Weave and Color with the help of Evolution
Algorithm", Textile Research Journal, vol. 73, no. 12, pp. 1033-1040.
Gutherie, J.C., Moir, J. & Oliver, P.H. 1962, "Two problems associated with the blending
Blending of colored fibers", Journal society of Dyers and Colour, , pp. 27-34.
Hoskins, J.A. & Hoskins, W.D. 1983, "Algorithms for the design and analysis of woven
textiles", Proceedings of the 1983 ACM Conference on Personal and small
computers, pp. 153.
Hoskins, J.A., Hoskins, W.D. & May, J.L.W. 1985, "Algorithms for color analysis”,
Proceedings of the 1985 ACM SIGSMALL symposium on Small systems, pp. 42.
Lambert, P., Staepelaere, B. & Fry, M.G. 1986, Color and Fiber, Schiffer Publishing Ltd.
Lourie, J.R. 1969, "Loom-constrained designs: An algebraic solution", Proceedings of the
ACM National Conference, pp. 185.
Lourie, J.R. & Bonin, A.M. 1968, "Computer-controlled textile designing and weaving",
Proceedings-IFIPS, pp. 884.
Lourie, J.R. & Lornzo, J.J. 1966, "Online Textile designing", Proceedings of the ACM National
meeting, pp. 573.
Mathur, K. 2007, Color Prediction Model for Jacquard Tapestry Woven Fabrics, Ph.D.
Dissertation, NCSU, North Carolina, USA.
Mathur, K., Seyam, A.M., Hinks, D., Donaldson, R.A. 2008, Prediction of Color Attributes
through Geometric Modeling, Research Journal of Textile and Apparel, Vol. 12, No.
1, pp 19-31.
Mathur, K., Seyam, A.M., Hinks, D., Donaldson, R.A. 2008, Towards Automation of
Color/Weave Selection in Jacquard Designs: Model Verification through Visual
Assessment, Coloration Technology, Vol. 124, pp 48-55.
Mathur, K., Hinks, D., Seyam, A.M., Donaldson, R.A. 2009, Towards Automation of
Color/Weave Selection in Jacquard Designs: Model Verification, Color Research
and Application, Vol. 34, No. 3, pp 225-232.
Mathur, K., Donaldson, A., Hinks, D., Seyam, A.M. 2005, Color on Demand for Jacquard
Fabrics, Research Journal of Textile and Apparel , Vol. 9, No.4, pp 26-37, Invited.
Miller, A. 1979, "A Computed Colour Catalogue of Fiber Blends and its use in Match
Prediction", Journal society of Dyers and Colour, vol. 79, pp. 604-612.
Seyam, A.M. and Mathur, K., A General Geometrical Model for Predicting Color Mixing of
Woven Fabrics from Colored Warp and Filling Yarns, The Proceedings of the 2nd
International Scientific Conference, Textiles of the Future, Kortrijk, Belgium,
November 13-15, 2008.
McDonald, R. 1997, Color Physics for Industry, 2nd edn, Society of Dyers and Colourists,
Staples Printers Rochester Ltd.
Menz, D. 1998, Color in Spinning, Interweave Press. Lourie, J.R. 1973, Textile
Graphics/Computer Aided, Fairchild Publications Inc., New York.
150
Advances in Modern Woven Fabrics Technology
Osaki, K. 2003, "High Quality Color Reproduction on Jacquard Silk Textile from Digital
Color Images", AUTEX Research Journal, vol. 3, no. 4, pp. 173-179.
Osaki, K. 2002, "Reproduction of Various colors on Jacquard textiles by only eight kinds of
color wefts", Proceedings of SPIE, pp. 740.
Peirce, F.T. 1937, “The Geometry of Cloth Structure”, Journal of Textile Institute, vol. 28,
T45.
Pierce, P.E. & Marcus, R.T. 1997, "Radiative Transfer Theory Solid Color –matching
Calculations", Research and Application, vol. 22, no. 2, pp. 72-87.
Pulton, D.P. & Porat, I. 1992, "The control of color by using measurement and feedback",
Journal of Textile Institute, vol. 83, no. 3.
Randall, D.L. 2005, Digital Imaging for Textiles- Next Generation. Available:
Techexchange.com [2004, December 20].
Reed, J., Jasper, W. & Hinks, D. 2004, "Quantitative measurement of Web Uniformity of
Blended Fibers", INTC.
Rich, D.C. 1986, "Colorimetry in Textile Design Systems", Textile Chemist and colorist, vol.
18, no. 6, pp. 16-18.
Richards, R. & Struve, G. 2005, Color Theory. Available:
[2005, July 13].
Ross, T. 2005, CAD and Color. Available: Techexchange.com [2004, December 20].
Seyam, Abdel-Fattah 2001, “Structural Design of Woven Fabrics: Theory and Practice.”
Textile Progress. UK: The Textile Institute. 31, pp. 1-36.
Seyam, A.M. 2004, "ITMA 2003: Weaving Technology", Textile World, pp. 34-39.
Takatera, M. & Shinohara, A. 1988, "Color Order and Weave On a Given Color-And-Weave
Effects", Sen-I Gakkaishi, vol. 44, no. 7, pp. 339-345.
Walowit, E. 1988, "Spectrophotometric color matching based on two-constant KubelkaMunk theory", Color Research and Application, vol. 13, no. 6, pp. 358-362.
Walowit, E. 1987, "An algorithm for the optimization of Kubelka-Munk Scattering and
Absorption Coefficients", Color Research and Application, vol. 12, no. 6, pp. 340343.
Part 4
Advanced Properties of Woven Fabrics
8
Sensory and Physiological Issue
Laurence Schacher1, Sourour Bensaid2, Selsabil El-Ghezal Jeguirim1
and Dominique Adolphe1
1Laboratoire
de Physique et Mécanique Textiles, University of Haute Alsace
Nationale d’Ingénieurs de Monastir, Unité de Recherche
Textile de Ksar Hellal, University of Monastir
1France
2Tunisia
2Ecole
1. Introduction
1.1 Economical, social, environmental, and industrial contexts
A significant added value of textiles is sensory in nature. During garment handling in a
shop, the customer engages a selection process that involves touching and trying on
clothing. A multifaceted multi-sensory, emotional and psychological experience occurs. A
decision is made and motivations are based on anticipated reality of preference, personality,
and emotion.
The Integration of sensory feeling in product development was not only focused in textile
industry. The use of sensory analysis methods started in the sixties for food products and
has been extended to many non-food products including personal care, pharmaceutical and
paper products. New design processes integrating the designers’ constraints and the
consumers’ expectations for better qualities perception have therefore been proposed in
other industries. Sensory analysis methods have been widely used as market research tools
in recent times and significant examples of application can be found in automotive industry.
The latter has recently performed several attempts to understand and characterise the
sensory preferences of end-users and to translate these features into technical specifications
for new products development (Giboreau et al., 2001). However, this trend may be more
prominent for textile industry as many factors can be given for conferring “character” to a
material observed through handling. Micro fibres, silk-like and peach-like, cool or soft
touches have been successfully developed in the past and new and exciting textile products.
Hence, finishing treatments are still studied and launched on the market for that purpose.
This phenomenon has been largely increased nowadays by the new textile industry
developments in terms of globalization and new virtual-environment applications demand
for variety and personalization. The main objective is to tailor products to the preferences of
each consumer (Nakano, 1994), (Okamoto, 1991).
2. Scientific context – State of the art
Recently, industrialists have moved away from usability-based approaches and towards
different ones to defining user requirements. This strategy provides a framework for
154
Advances in Modern Woven Fabrics Technology
considering the sensory, hedonic and practical user’s requirements within the product
design or product evaluation process. Therefore, considering the benefits that a product
should bring to its users, the next step is to determine the design characteristics through
which the product can deliver these benefits. It can be considered to referring to kansei
engineering which has been pioneered by Nagamachi (Nagamachi, 1995) in Japan since the
1970s. Kansei is a Japanese term for consumers’ psychological impressions and feelings
about a product. This approach encompasses physical, physiological, and psychological
point of views.
2.1 Physical point of view
More than eighty years have passed since the earliest efforts of Peirce (Peirce, 1930) in the
textile field to evaluate fabric hand thanks to physical measurement data. Several studies
have then been undertaken to use instruments to measure fabric hand, notably Kawabata's
method of the Japanese Hand Evaluation and Standardization Committee (HESC) in the
1970s (HSEC, 1980; Kawabata, 1988), and a number of mechanical devices, including KES
(Kawabata Evaluation System), FAST (Fabric Assurance by Simple Testing), and UST
(Universal Surface Tester), have been developed to objectively characterize fabric hand
quality (Pan & Yen, 1992; Pac et al., 2001; Fontaine et al., 2005; Issa et al., 2008; Maâtoug et
al., 2009). Along the instrumental tests, all fabrics are subjected to deformations similar to
those applied by the hand experts, using the same modes and rates. These tools are usually
fast, repeatable and well understood; however, they may not represent the textile good in
use as the measured mechanical parameters cannot directly reflect human sensation in a
precise way. Indeed, fabric perception, which can be defined as the human sensory response
towards fabric, obviously involves not only physical and mechanical factors, but also
physiological, perceptional and social factors.
2.2 Physiological point of view
Physiological approach is focused on the body - information derived from the sensory
organs. This information covers tactile, visual and olfactory properties. Tactile pleasures
concern holding and handling a textile product. This might be relevant in the context of
garments shopping. Olfactory pleasures concern the smell of the new product: the smell
inside a new car may be a factor that effects how pleasurable it is for the owner. Hedonic
characteristics of fabrics and garments are therefore to be considered by textile
manufacturers.
2.3 Psycho-physical point of view
The psycho-physical point of view relates to how the consumer mood is affected by
interaction with a product. It might be expected, for example, that a new garment would
provide a higher level of psychological pleasure than the old casual one. In the context of
textile products it would relate to, for example, the aesthetics of a product and the values
that a product embodies.
3. Methods to assess human perceptions: sensory analysis
In the 50s, sensory analysis emerged, first by the development of methods used by food
industry and in 1974 in USA; a complete methodology for descriptive analysis was
Sensory and Physiological Issue
155
proposed (Stone et al., 1974). The sensory analysis has shown a promising tool for taste
and smell in food industry and has been applied with success in cosmetic industries such
as Nestle, L’Oreal, Dior, (Young et al., 2005; Stone & Sidel, 2007). Textile materials have
been a subject of interest concerning sensory analysis. The first attempt is reported by
Binns (Binns, 1926). Since the early 80s, standard methods have been developed and
published. They are customization of methods established in food science (Depledt, 1998);
Barthelemy et al., 1990; Meilgaard et al., 1991). A methodology for sensory analysis of
tactile feeling of textile fabrics was developed in France and the results reported a creation
of tactile sensory profile (Depledt, 1998; Cardello et al., 2003; Philippe et al., 2003;
Chollakup et al., 2004 a; 2004 b; Bensaid et al, 2006). Automotive industry has also applied
sensory methods for their own products. Sensotact® reference frame is a commercial
example of an attempt to formalize and calibrate descriptions of tactile perceptual
dimensions. It was developed by French Renault Automotive Company (Sensotact, 2008).
Italian Fiat Company (Bandini et al., 1997) has also shown some relevant sensory design
engineering examples for their products.
3.1 Definition of sensory analysis
The basic assumption of sensory evaluation is the ability to perform objective measurements
of sensations using a panel of people as an instrument. The sensory analysis is defined as
« the examination of the organoleptical properties of a product using the human senses »
(ISO 5492, 1992). Fortin and Durand (Fortin & Durand, 2004) give the following assertion
« The sensory analysis can be defined as the study of the human response to a stimulus (…)
The sensory analysis qualifies and quantifies the felt perceptions of persons called judges or
panelists when they evaluate products or materials inducing our reactions senses. These
methods could be applied to food, perfumes, cosmetics, textiles, automotives… Based on
these definitions, it can be assumed that the sensory analysis of the products consists in the
description or their evaluation through words called descriptors or attributes linked to each
of our senses (sight, hearing, taste, smell, touch).
3.2 Measurement principle
The evaluation starts with the contact between the body and the environment and the
interaction of the product with the judge. It is the “sensorial stimuli”, which will be
analyzed in different manners regarding the personal history of the “judge” and will be
linked with the relationship existing between him or her and the evaluated object. The
analysis of the “sensorial stimuli” is a unique function dedicated to the human being and no
measurement device could reproduce it” (Fortin & Durand, 2004). In other words, the
sensory analysis method uses the human senses as measurement device. In this way, it is
essential to understand how the senses are working in general and the tactile sense in
particular. Every sensory information is issued from a stimulus applied on the sensorial
receptors by the environment. Generally, the stimulus feeling unrolls the following
procedure (Rosenweig & al., 1998; Richard & Orsal, 2001).
Signal reception: every sensorial system is activated when a stimulus is generated by an
external event applied on an organ. These sensory organs select stimuli, it is the filter
phase.
Transduction: the human sensors convert the external event in electric signals understood by
the nervous system. This step is followed by the transmission of this signal to the nervous
centers.
156
Advances in Modern Woven Fabrics Technology
Integration: The different information will be treated and computed by the central nervous
system which will generate the response in relation to the solicitation.
The sensorial sensors are usually grouped in sensorial organs and are specialized in one
particular sensorial solicitation.
A feeling is beginning when a stimulus activates a sensory organ. The sensory responses are
generated after 0.1 to 0.2 second after the stimulation. First, the stimulus is coded in terms of
quality and intensity. The response to a sensory stimulation could be physiological,
behavioral, verbal, or psychological; taken into consideration that, at least, only the three
first responses are observable (SSHA, 1998).
Generally, as a first step in fabric sensory analysis, monosense approach is preferred.
Usually, tactile only or visual only examinations are performed by panelists: for tactile
evaluation, tests are carried out in “blind” conditions in order to reduce biases that could be
induced by seeing the fabric such as subjective preference of a special colour or material.
However, human beings are equipped with multiple sensory channels through which they
experience objects in the environment. There is obvious evidence that perception of
information provided within one sensory modality can be greatly influenced by stimuli
caused by another modality. It is true that consumer can see the fabric when touching it and
tactile exploration of a textile surface is usually accompanied by visual sensory inputs and in
a context of purchase. In such conditions, the consumer has the possibility to see the colour
of the fabric and to know which kind of material it has been made from as well as its context
of use. During tactile exploration, one can also sometimes hear the sounds made as the
fingers explore the fabric. One can sometimes smell the odour of the fabrics. For all possible
combination, the correlation between visual and tactile properties has mainly been studied
(Lederman et al., 1981; Konyo et al., 2002, Cinel & al., 2002, Guest & Spence, 2003, Mucci et
al., 2005, Bensaid & al., 2008). In these studies, the superiority of vision in the multi-modal
sensational perception has been somehow demonstrated (Konyo et al., 2002). This first
modality corresponds to several marketing results showing that vision is the very first data
required by consumers and that the risk of not feeling, and trying on clothing before
purchase may be the greatest challenge for Internet clothing sales, and is an issue that must
be addressed. Some companies are developing Virtual 3-D try-on technology that might
reduce the risk of ill-fitting or inappropriately styled clothing for one's body type, by
providing the consumer with a view of the garment on his/her body. Inappropriate tactile
or sound or smell feelings would be more complex to address with such technologies.
However, Lederman et al. (Lederman, 1981; Lederman & al., 1986) have shown that the
extent to which the data from one modality is preferred over the other depends on the
nature of the task to be performed. Consequently, some tasks appeared best suited to vision
(e.g. determining the spatial density of texture elements), and some to touch evaluation (e.g.
determining the roughness of fine textures).
The touch feeling is known to be one of the most important senses. The skin which is the
main organ of the tactile sensibility covers our body with an average surface of 1.7m² for an
adult person. It is made of two layers: a top layer called epidermis which is renewed every
20 days and a bottom layer called dermis which contains nerves and blood vessels. The
touch feeling groups three main modalities: mechanical sensibility, thermal sensitivity and
pain.
The mechanical sensibility: also called touch sensibility corresponds to the response to
pressure, touch and vibration solicitations. This sensibility depends on numerous
Sensory and Physiological Issue
157
parameters such as shape, surface, duration and intensity of the stimulus. The mecanoreceptors are the key elements of this sensibility.
Six kinds of receptors have been listed, the Merkel disks, the tactile disks, receptors of the
hair follicles, the Meissner corpuscles, the Ruffini corpuscles and the Pacini corpuscles as
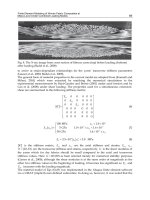
shown in the figure 1.
Fig. 1. Scheme of the skin and location of the touch sensors (Richard & Orsal, 2001)
The figure 2 displays the location (a), the size and the density (b) of the four kinds of
receptors in the internal face of the hand (Richard & Orsal, 2001). Every cerebral region
manages a precise skin part. This repartition has been presented in a caricature manner
through the “homoculus” display (figure3) where every organ is represented with a surface
in relation with its touch sensors density (Richard & Orsal, 2001). Nevertheless, the tactile
sensibility is not fully linked with the density of the touch sensors but it is more driven by
the number of connections in the sensitive cortex of the brain. On apes, some studies have
shown that the sensitive surface could be increased or decreased thanks to training. Figure 4
represents a map of the spatial discrimination for the different organs. The more sensitive
parts are the fingers tips and the tongue end.
Thermal sensitivity corresponds to two opposite sensibilities, the sensitivity to warm and the
sensitivity to cold. These feelings are detected by some specific points which are sensitive to
hot and warm and that are scattered all over the skin with a lower density than those
dedicated to mechanical stresses. Moreover, the sensitive points to cold are more numerous
than those sensitive to hot.
158
Advances in Modern Woven Fabrics Technology
Fig. 2. Touch Sensors location a) and density b) in the inside hand
Fig. 3. Homoculus caricature display
Pain is a feeling generated by a high level stimulation called “novice” because it induces
injuries in the organism. Different kinds of pain can be detailed: superficial pain which is
Sensory and Physiological Issue
159
coming from the skin, deep pain coming from the bones, from the muscles, from the joints
or the tendons. The receptors involved in this feeling are called “nocireceptors”.
Fig. 4. Spatial discrimination threshold of human organs
3.3 Sensory analysis: Methodology
In regard to the final goal of the evaluation, comparison, quality measurement, new product
characterization, etc, different kinds of tests issued of the sensory analyze set could be
performed (AFNOR V09-001, 1983; AFNOR XP V 09-501, 1999; ISO 6658, 1985). One of the
most frequently used, the descriptive test allows characterizing, comparing and quantifying
differences between tested products. The method requires a group of trained judges
(panelists), who are intensively trained to qualify and quantify their feeling and hedonic
judgment in an objective way. The product characteristics are dissected through their
expertise. The panelists first agree on specific and objective sensory vocabulary (ISO 11035,
1995) to describe the feeling of a product range (Nogueira & al., 2009).
Continuous training enables them to sharpen their perceptions and to perceive differences
of intensity between products for every criterion. Training the panels also leads to
homogeneity and reproducibility in the ratings (ISO 8586, 1993). Finally, a final grading
enables to build out product sensory identity maps or profiles, or fingerprints. The obtained
results are rich and powerful as they allow identifying all of a product’s perception
characteristics along with measures of the importance of those characteristics.
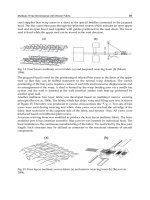
Figure 5 represents a sensory map of raw cotton woven fabrics before (non-treated) and
after various commercial post-treatments (m, sd, sp, k) evaluated by 11 trained panelists.
The tests were replicated twice and the order of presentation of the samples was
randomized for each assessor. The displayed differences on figure 5, even the smallest one,
are significant in regards to statistical analysis.
160
Advances in Modern Woven Fabrics Technology
non-treated
Attribute
m
sd
sp
k
« falling »
« rigid »
« slippery »
« soft »
« crumple-like »
0
1
2
3
4
5
6
7
8
9
10
Intensity
Fig. 5. Example of tactile sensory profiles of textile woven fabrics
However, the panelists are not representative of the end-users and therefore are not asked to
perform the hedonic studies. The complete sensory methodology process involves another
group of persons: the final consumers. This group is not trained, the persons being merely
questioned on their preferences (like-dislike). Both approaches lead to preference mapping
(Schlich, 1995) that allows specifying preferred sensory characteristics of products for given
groups of end-users. Figure 6 represents the main methods in sensory analysis.
Looking for:
differences
Discriminative
tests
minimum 20 judges
preferences
Descriptive
tests
6 - 10 trained judges
Fig. 6. Methods of sensory analysis
Hedonic tests
(Consumers)
Minimum 100 naive judges
Sensory and Physiological Issue
161
Sensory analysis is using “human beings” as a tool but it is employing objective methods to
collect their subjective sensory responses. One disadvantage of the sensory methodology is
the time consuming due to the panel recruitment, training and the validations of each step
of the methods using the appropriate statistical tools.
4. Innovating method and numerical tool to simulate complex systems
Several attempts have been made to model the relationship between tactile sensory
attributes of fabrics and their production parameters, or their instrumental measurements.
Hence, statistics and multivariate analysis (Bishop, 1996) and methods based on intelligent
techniques (neural networks, fuzzy logic...) have been used (Vassiliadis et al., 2010). The
intelligent techniques have proven a very efficient tool for the fast and precise solution.
Therefore, they have found increasing applications in the textile field such as properties
prediction and process optimization.
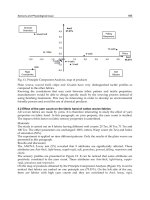
4.1 Artificial Neural Network
An artificial neural network (ANN), usually called neural network (NN), is a mathematical
model or computational model that tries to simulate the structure and functional aspects of
biological neural networks. A neural network consists of an interconnected group of
artificial neurons and processes information using a connectionist approach to computation.
Neural networks are non-linear statistical data modelling tools. They can be used to model
complex relationships between inputs and outputs or to find patterns in data.
There are many different ANN structures and learning algorithms available in the literature
(Haykin, 2000). Among these algorithms, multilayer perceptron (MLP) has been successfully
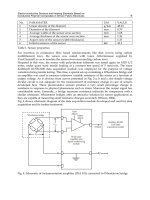
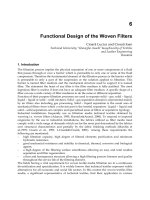
applied. A typical multi-layer neural network with a single hidden layer is shown in Fig.7.
Each neuron receives a signal from the neurons of the previous layer and these signals are
multiplied by separate synaptic weights. The weighted inputs are then summed up and
passed through a transfer function, which converts the output to a fixed range of values. The
output of the transfer function is then transmitted to the neurons of next layer. This process
is continued and finally the output is produced at the output node. Predicted output is then
compared with the desired output and an error signal is generated.
Fig. 7. A multilayer artificial neural network
The error signal is then minimised in iterative steps by adjusting the synaptic weights using
a suitable training algorithm (figure 7). Among the various kinds of algorithms for training
neural network, the back-propagation algorithm developed by Rumelhart et al. (1986) is the
162
Advances in Modern Woven Fabrics Technology
most widely used. Network weights are adapted iteratively until some appropriate stopping
criteria are met and the best weight vector that corresponds to the best generalization is
achieved.
4.2 Fuzzy interference system
The foundation of fuzzy logic, which is an extension of crisp logic, was first proposed by
Zadeh (Zadeh, 1965). The theoretical aspects of fuzzy logic and fuzzy arithmetic have been
explained in many standard textbooks (Zimmerman, 1996). In crisp logic, such as binary logic,
variables are true or false, black or white, 1 or 0. In fuzzy logic, a fuzzy set contains elements
with only partial membership ranging from 0 to 1 to define uncertainty of classes that do not
have clearly defined boundaries. For each input and output variable of a fuzzy inference
system (FIS), the fuzzy sets are created by dividing the universe of discourse into a number of
sub-regions, named in linguistic terms (high, medium, low etc.). If X is the universe of
discourse and its elements are denoted by x, then a fuzzy set A in X is defined as a set of
ordered pairs as A={x, µA(x)│xX} where µA(x) is the membership function of x in A.
Once the fuzzy sets are chosen, a membership function for each set is created. A
membership function is a typical curve that converts the input from 0 to 1, indicating the
belongingness of the input to a fuzzy set. This step is known as “fuzzification”. Membership
function can have various forms, such as triangle, trapezoid, sigmoid and Gaussian.
The linguistic terms are then used to establish fuzzy rules. Fuzzy rules provide quantitative
reasoning that relates input fuzzy sets with output fuzzy sets. A fuzzy rule base consists of a
number of fuzzy if-then rules. For example, in the case of two inputs and single output
fuzzy system, it could be expressed as follows:
If x is Ai and y is Bi then z is Ci
(1)
where x, y and z are variables representing two inputs and one output; Ai, Bi and Ci, the
linguistic values of x, y and z respectively.
The rule base contains linguistic rules that are provided by experts. It is also possible to
extract rules from numerical data. Once the rules have been established, the FIS can be
viewed as a system that maps an input vector to an output vector.
The output of each rule is also a fuzzy set. Output fuzzy sets are then aggregated into a
single fuzzy set. This step is known as “aggregation”. Finally, the resulting set is resolved to
a single output number by “defuzzification”. These main steps involved in modeling a
fuzzy system are shown in Fig.8.
Input data
Fuzzification
of input data
The fuzzy rules
establishing
Defuzzification
of output data
Output data
Fig. 8. General depiction of fuzzy system
4.3 Modeling the relationship related to sensory evaluation
4.3.1 Modeling the relationship between sensory properties and production
parameters
In order to face the competitive environment, textile companies are interested in designing
and producing new industrial products adapted to the specific needs of consumers with a
Sensory and Physiological Issue
163
minimal number of experiments. In fact, specific fabrics tactile properties desired by
consumers can be reached by adjusting the process parameters.
Several investigators have used statistics and multivariate analysis, such as multiple factor
analysis MFA and principal component analysis PCA for studying the influence of finishing
treatments on low stress mechanical properties and sensory attributes (El-Ghezal Jeguirim et
al. 2010 a; 2010b; 2011). Although classical computing techniques are relatively efficient to
interpret and analyze the relationship between sensory properties and production
parameters, some limitation related to the non-linear relations in sensory domain has been
reported (Zeng et al., 2008).
New methods based on intelligent techniques (fuzzy logic, neural networks...) are used to
treat a great number of textile applications (Dubois & Prade, 1997; Kwak et al., 2000; Jain et
al., 2004; Wong et al., 2006; Ertugrul & Ucar, 2000; Vassiliadis et al., 2010). Zeng et al. have
used the fuzzy logic technique for modeling the relationship between the production
parameters and the physical features of fabrics (Zeng et al., 2004). The instrumental features
have been measured on Kawabata Evaluation System. In order to reduce the inputs number,
a small number of relevant physical features have been selected using human knowledge on
fabric production and fabrics properties. In the modeling procedure, the fuzzy rules have
been extracted from measured numerical data. These extracted rules have been validated
and adjusted by human knowledge on production processes. In this way, the two
information sources (human knowledge and measured data) are both taken into account in
the fuzzy rules of this model.
El-Ghezal Jeguirim et al. (El-Ghezal Jeguirim et al., 2009) have developed neural network
and fuzzy logic based models to predict the sensory attributes, evaluated by a trained panel,
of knitted fabrics from the structure and process parameters. In their further work, the
intelligent techniques have been used for modeling the relationship between the
instrumental properties measured by Kawabata Evaluation System and the finishing
parameters of knitted fabrics (El-Ghezal Jeguirim et al., 2011). The prediction performance of
these models was considerably lower than the mean variations of experimental values.
These results showed the intelligent techniques ability to model the relationship between
manufacturing parameters and instrumental or sensory tactile properties. The fuzzy or
neural models provide contribution in industrial products engineering, with minimal
number of experiments and short cycles of product design. The prediction performances of
neural and fuzzy models were also similar. However, the ‘black box’ problem associated
with neural networks can hinder the widespread adoption of this method. In fact, the fuzzy
techniques have two advantages over the neural ones. In fuzzy models, the linguistic rules
can be interpreted and the linguistic sensory attributes can be integrated. Thus, it is possible
to observe how the fuzzy model performs its computations.
Moreover, better results can be obtained when these techniques are used in combination. In
fact, hybrid models based on neuro-fuzzy methodologies combine the self learning ability of
neural networks and the human-like reasoning style of fuzzy systems. Hence, neuro-fuzzy
models can provide enormous scopes to link sensory attributes or mechanical properties
with processes parameters of fabrics.
4.3.2 Modeling the relationship between sensory properties and instrumental
measurements
The sensory evaluation method has been adapted to textile products to characterize
consumer preference for textile products. However, sensory evaluation is time-consuming
164
Advances in Modern Woven Fabrics Technology
and expensive. Therefore, reliable and practical instrumental methods are needed to
accurately predict sensory tactile attributes, at least in the product development and quality
control stages. Several instrumental methods (Kawabata, 1975; 1980; Kawabata et al., 1982;
Tester and De Boos, 1990; Pan & al., 1993, Pan & Yen., 1992) have been developed for
measuring the tactile feeling of fabrics according to their physical mechanical, thermal and
surface properties. Hence, modeling the relationship between instrumental measurements
and sensory attributes becomes a key problem in tactile quality assessment.
Wide ranges of statistical or multivariate analysis have been proposed for characterizing this
relationship and selecting the relevant instrumental and sensory properties. In particular,
Weber-Fechner’s law (Matsuo et al., 1971; Bishop, 1996; Rombaldoni et al., 2010), Stevens’s
power law (Bishop, 1996; Elder et al., 1984; Rombaldoni et al., 2010), and PCA (Mackay el al.,
1999; El-Ghezal Jeguirim et al., 2010 b) have been usually applied.
Matsuo et al. (Matsuo et al., 1971) used the Weber-Fechner’s law to translate instrumental
measurements of a wide of fabric mechanical properties into corresponding hand
parameters. Although the method has the virtue of independence of fabric type, further
work would be needed to check the validity of the Weber-Fechner’s law for modeling the
complex sensory-instrumental relationship.
Elder et al. (Elder et al., 1984) used Stevens’s power law to examine the relationships
between subjectively measured softness and a compression and also between subjective
stiffness and a flexural rigidity. Excellent correlation was found, correlation coefficients for
the Stevens’s law being about 0.97. On the evidence of the results of Elder et al., Stevens’s
law appears to be an excellent model. Although the relationship breaks down in some cases,
this fact is probably because the subjective evaluation attribute cannot be adequately
represented by a single instrumental parameter. This problem may be overcome by relating
each sensory score to the sum of the different contributions made by a number of
instrumentally measured properties that are relevant to well-defined fabric types or end
uses. Rombaldoni et al. (Rombaldoni et al., 2010) investigated the possibility of predicting
the human psychophysical perception of crispness and coolness hand of men's suit woven
fabrics made from animal fibers (wool, mohair, cashmere and alpaca) from measurable lowstress mechanical and thermal parameters. In particular, the parameters chosen were weight
per unit area, thickness at 9.81 kPa, surface thickness, bending rigidity, extensibility at
98.1 N/m, shear rigidity, formability and thermal absorptivity. The sensory-instrumental
relationship was explored using the Stevens's power law. The correlation results were also
compared by the predictive power of other mathematical models: a linear function and the
Weber–Fechner law. The obtained results showed that the Weber–Fechner-law-based model
was the best to predict the sensory hand value.
Mackay el al. (Mackay et al., 1999) used Principal Component Analysis (PCA) to study
relationships between sensory and instrumental measurements of the effect of washing
processes on 1x1 rib knitwear fabrics. El-Ghezal Jeguirim et al. (El-Ghezal Jeguirim et al.,
2010 b) investigated the relationship between instrumental data and sensory attributes,
assessed by a trained panel by using PCA. The obtained results have shown that the
compression resilience, the geometrical and frictional roughness are significantly correlated
with the following sensory parameters thick, heavy, soft, elastic and crumple-like attributes.
The intelligent techniques, including fuzzy logic and neural networks are also used for
modeling the relationship between instrumental measurements and sensory properties. Hui
et al. have developed a neural network to predict the consumers sensory data from fabric
properties (Hui et al., 2004). The predicted results are highly correlated to the targets in the
Sensory and Physiological Issue
165
fabrics made by five materials: cotton, wool, polyester, nylon, and acetate. In the validation,
the results show that the proposed network also predicts the hand of linen and silk. Another
work for predicting fabric hand from physical measures has been done by combining fuzzy
logic and neural networks (Park et al., 2000). The obtained results revealed that the neural
networks and fuzzy logic provide an alternative approach for predicting sensory properties
from instrumental measurements of fabrics.
5. Applications study cases for cotton/woolen woven fabrics with difference
pattern
The main applications of sensory analysis in textile industry are focused on the analysis of
the factors affecting fabric hand. Many studies have been conducted to identify the effect of
construction factors, such as pattern, yarn properties, fabric materials, or finishing
treatments on the fabric tactile quality by using the sensory analysis (Bensaid & al., 2006; ElGhezal Jeguirim et al., 2010 a; 2010 b).
In order to provide reliable descriptions and evaluation of fabric hand, rigorous procedures
have to be implemented i.e. exploratory procedures, samples presentation and data analysis.
In this section, a detailed description of the followed procedure is presented before the
discussion of some studies’ results.
Description of the followed experimental protocol
Sensory analysis method has been developed in the group since 1999. It requires a group of
trained persons. In these cases, the sensory panel comprises nine adults between 20 and 50
years old. These persons, called assessors, have been trained according to a previously
established methodology (Nicod, 1990; NF-ISO, 1993). The tests are conducted in an
environmentally controlled room (20°C and 65% Relative Humidity) (NF EN 20139, 1992).
The assessors evaluate the products twice, in particular conditions, in order to avoid some
bias due to other senses. The presentation of the fabrics is randomised and the evaluation is
done without seeing the fabric using specially designed booth.
Sensory rating is done using a set of 15 individual sensory attributes (Table 1) to build
profile consisting of the descriptive, quantitative and objective analysis of the fabric. These
attributes have been consensually selected by the assessors and have been used for different
types of fabrics (NF-ISO 5492, 1992; NF-ISO 11035, 1995). Quotation is performed on a nonstructured scale 0-10.
Before every new product category evaluation, the assessors are retrained for ten sessions.
This step allows them to become familiar with the procedure of evaluation and to remember
the right meaning and extremes of each attribute.
The pertinence of the attribute is checked later using statistical tools.
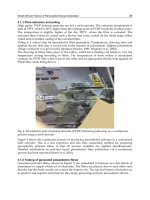
In this chapter the effect on the fabric hand of cotton fabrics of three series of parameters
will presented: effect of the weaving patterns, effect of the yarn count, and effect of finishing
treatments.
5.1 Effect of the weaving patterns on the fabric hand of cotton fabrics
Materials
In order to study the effect of weaving pattern, nine fabrics have been selected. The samples
have been woven with nine classical weft effect patterns on a Jacquard loom. The patterns
include a plain weave, 3-twill weave, 4-twill weave (Z direction), waved twill weave
166
Advances in Modern Woven Fabrics Technology
Bipolar attributes
Surface attributes
Handle attributes
cold-warm
thin-thick
light-heavy
supple-rigid
pilous
soft
granulous
sticky
grooved
greasy
slippery
falling
responsive
crumple-like
elastic
Table 1. List of the 15 attributes used for the sensory evaluation
(horizontal effect), 4-satin weave, 5-satin weave, 6-satin weave, 12-satin weave and crêpe
weave; the yarns are 100% cotton, 14 Tex for the warp and 25 Tex for the weft. In order to
highlight the influence of the pattern on the tactile feeling, we tested fabrics having close
characteristics. Hence, the saturation index in weft direction was kept equal to 52%. This
index is defined as following:
It
100 x D (yarn count within the fabric)
D max (maximum yarn count)
(2)
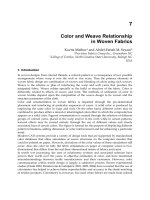
Microphotographs of the fabrics weaved in different patterns are presented in Figure 9.
Their characteristics are presented in Table 2.
Pattern
Weft count (tex)
Plain
3-Twill
4-Twill
4-Satin
5-Satin
6-Satin
12-Satin
Waved twill
Crêpe
25
25
25
25
25
25
25
25
25
Warp count
(tex)
14
14
14
14
14
14
14
14
14
Area density
g/m2
124.8
140.0
140.8
141.8
141.6
147.0
147.2
150.2
135.6
Saturation index
(%)
52
52
52
52
52
52
52
52
52
Table 2. Characteristics of the tested fabrics
Results and discussion
Statistical methods of data analysis have been applied. The ANOVA 2-way test (5%),
applied on product across assessor variables, outlined that only 4 attributes are not affected
by the fabric pattern (warm, sticky, greasy and elastic), the other 11 attributes are significantly
affected (Table 3). Four attributes are considered as non pertinent for this study: cold–warm,
sticky, greasy and elastic. The three first are material dependant and the same weft and warp
material (100% cotton) was adopted whatever the pattern is. The last one, elastic, could be
dependant of the pattern, but in woven fabrics case, the elastic behavior is relatively low in
comparison to the knitted fabrics. Hence, the marks given by the panellists are around 0
with a non significant difference between the different samples.
167
Sensory and Physiological Issue
Fig. 9. Microphotographs of the nine different patterns
Attribute
Product
Assessor
PdxAs
Warm
NS
×
NS
Falling
×
×
NS
Thick
×
×
NS
Heavy
×
×
NS
Rigid
×
×
NS
Sticky
NS
×
NS
Slippery
×
×
NS
Soft
×
×
×
Granulous
×
×
×
Greasy
NS
×
NS
Pilous
×
×
×
Grooved
×
×
×
Elastic
NS
×
NS
Responsive
×
×
NS
Crumple-like
×
×
×
Table 3. ANOVA 2-way test (5%) for all the attributes and all the fabrics
According to the column PdxAs, it appears that soft, granulous, pilous, grooved and crumple
like have been marked in a different manner depending of the judges.
168
Advances in Modern Woven Fabrics Technology
The sensory profile is the simplest way to visualize the results. Each horizontal line
represents the scale of one attribute, on which the mean score is plotted. All marks related to
the same product are joined by a line. Figure 10 shows the profiles of the nine weaving
patterns.
10
9
3-twill
8
4-twill
7
waved twill
6
5-satin
5
crêpe
4
12-satin
3
6-satin
2
4-satin
1
plain
re
sp
on
si
ve
cr
um
pl
elik
e
gr
oo
ve
d
pi
lo
us
so
ft
gr
an
ul
ou
s
sl
ip
pe
ry
rig
id
he
av
y
th
ic
k
fa
lli
ng
0
Fig. 10. The sensory profiles of the nine fabrics for the relevant attributes
According to this figure, it can be observed that the waved twill, the crêpe, the plain, and the
12-satin weaves have distinguished profiles.
The Friedman test (5%) ranges the products into groups. The obtained results show that the
nine fabrics are close, and they belong to the same group for cold–warm, light-heavy, sticky,
slippery, greasy, and elastic attributes, since the differences between fabrics are not significant.
However, the fabrics are divided into several groups for falling, thin-thick, supple-rigid, soft,
granulous, pilous, grooved, responsive and crumple-like attributes.
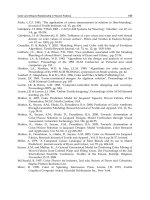
The Principle Component Analysis (PCA) is one of the most frequently used methods for
the analysis of data collected from sensory tests. It is applied on the mean score of the panel
across replication to analyze the pertinence of the attributes and to obtain graphical displays
of the multivariate data simplifying subsequent analysis and highlighting similarities and
differences between the woven fabrics. Sensory attributes were abstracted into two sensory
independent factors, which explain respectively 46% and 28% of the total variance. These
groups are carried to the map of products, in order to see the different correlations between
fabrics and attributes. The results are presented in Figure 11.
In this figure, it can be observed that:
the plain weave is the most rigid and crumple-like and the least falling and responsive.
the waved twill is the most granulous and grooved and the least soft and slippery.
the 12-satin is the most pilous, responsive, falling, soft, and slippery.
the crêpe has a rigid feeling; it is also less pilous, soft, and responsive than most of the
other fabrics.
Conclusion
Based on the obtained results, and as predicted, it is seen that the pattern strongly influences
tactile feeling. Several attributes have been affected: soft, slippery, grooved, granulous, pilous,
rigid, and falling. These results are in accordance with textile professionals’ expectations.